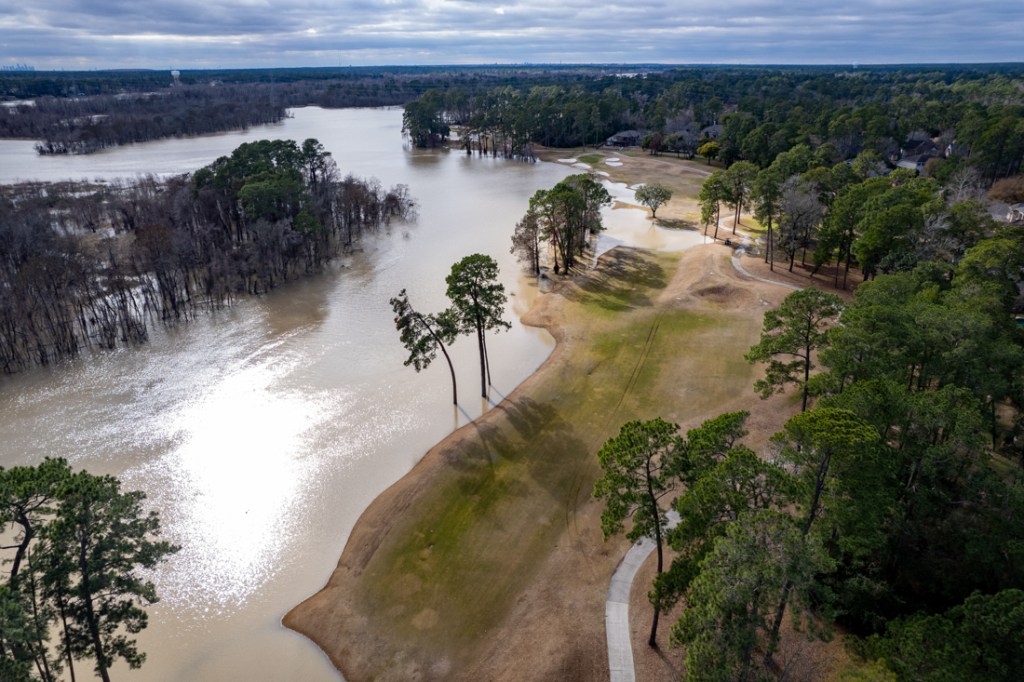
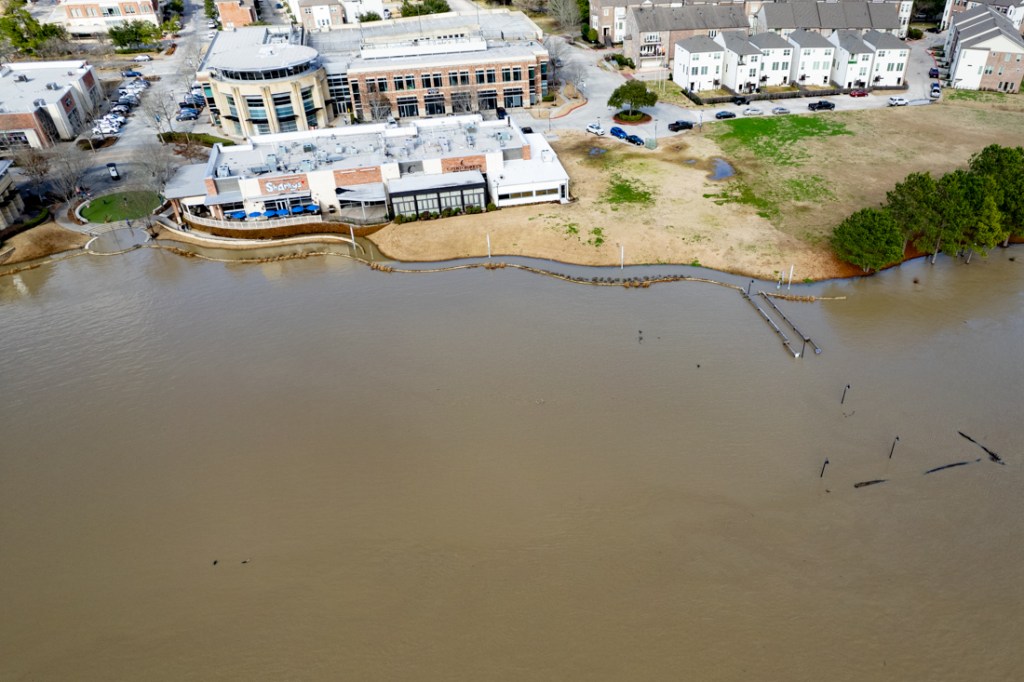
Sand Mine Leaks Upstream from Blocked Drainage Ditch

Just upstream from the blocked drainage ditch at Northpark Drive and the San Jacinto West Fork, Hallett Materials operates the biggest sand mine between I-69 and I-45. The mine complex sprawls across several square miles and has several leaks. During the last flood in January, those leaks likely contributed to sedimentation in the West Fork and a blocked drainage ditch immediately downriver from the mine.

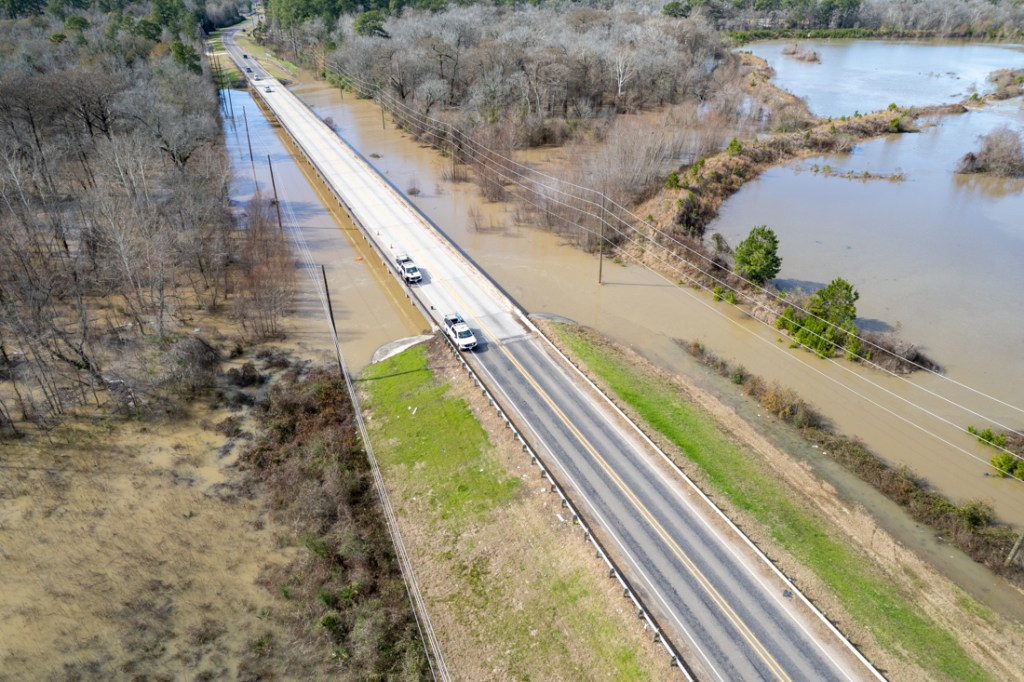
Blocked Northpark Ditch at West Fork
Contrary to a popular narrative among miners, this sand did not come from Spring Creek. That’s another watershed. Picture taken on 2/5/2024. The Hallett Mine is to the left (upstream) of the channel.
This picture of the blockage above shows the height of the sand relative to the top of the banks. Courtesy of a resident who prefers to remain anonymous.

Location of Mine Relative to Blockage

In late January, the West Fork experienced an estimated five-year flood after several days of nearly constant rains. Waking up after the flood was like a bad hangover. The blocked ditch above was just one of the problems. It is immediately downstream from the giant Hallett mine. See below.

Landsat image from Google Earth. Arrow shows direction of river’s flow. Circle shows location of blockage. Numbers show approximate location of leaks listed below.

Mine Leaks in Multiple Places

Let’s take a closer look at each of those three areas.

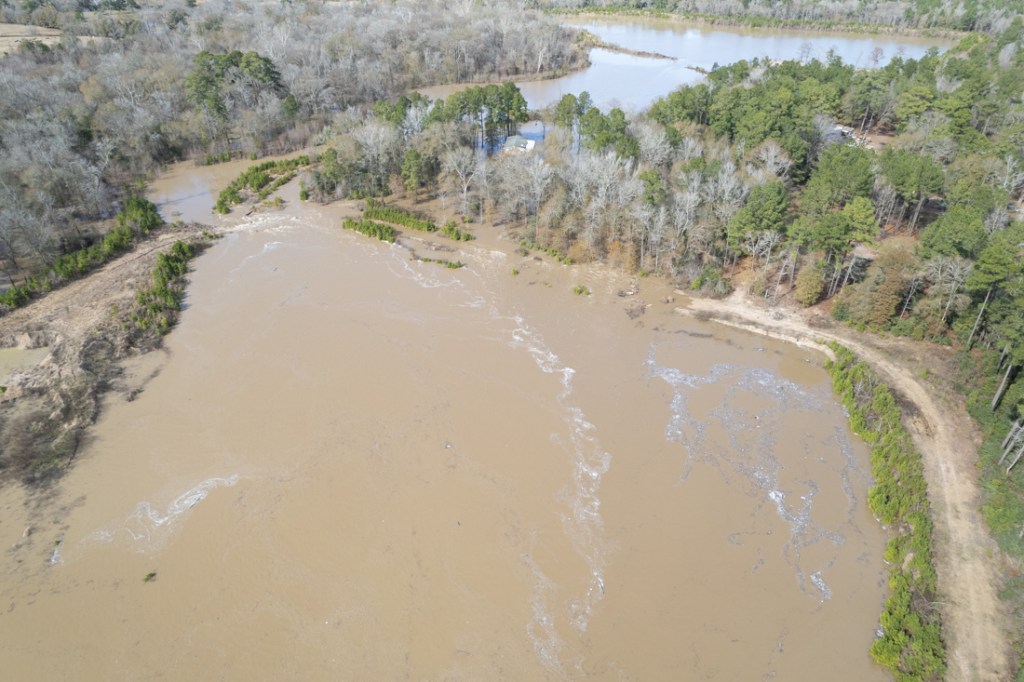
  1. One pond was wide open to the river through a large gap in its dike. The gap appears to have remained open since at least July 2023 and enlarged.
  2. A pipe was expelling water from a second pond straight into the river.
  3. A bulldozer appeared to have helped a third pond overflow across a road. Wastewater from the settling pond then flowed through woods and neighboring properties on its way to the river.

Pictures Taken on Feb. 8, 2024

Leak #1

Notice the huge gap in the dike of the pond in the center of the image below. Also notice that pond’s elevation compared to the one on the right.

The dike breach (center of image) first showed up in Google Earth in July 2023. It now appears considerably larger, indicating severe erosion from the recent flood.

The drought last summer and fall certainly didn’t cause the breach to enlarge.

Historical images in Google Earth show that this pond frequently breaches its dikes in different places. Something’s going through there!

Leak #2

A little farther downstream on the west side of the river, a pipe drains another Hallet pond directly into the river.

I photographed Hallett piping water into the river at this same location in 2020.
Leak #3:

Haven’t seen this before! On the east side of the river, in the woods next to Hallett’s main settling pond, a bulldozer apparently created a path for water to escape across a maintenance road. Water then flowed through woods 600-feet wide and onto neighboring properties before entering the river just above the blocked channel. See the series of images below.

Notice bulldozer tracks to left of perimeter road and wet area on road in the middle of the frame.

Flying closer, you can see that the bulldozer had pushed dirt from the road into the pond (see below, right side of frame).

Silty wastewater then escaped from the pond into the woods on the left.
The silty wastewater then migrated south (top of frame) through the woods.
Along the way, it invaded neighboring properties.
Then it drained back across the access road and into an abandoned mine (top of frame).

Hanover Estates now owns that abandoned mine. In the photo above, note the open path to the river in the upper right. It’s shown below in more detail.

Closer shot of wastewater exiting Hanover pond through another breach that leads straight to blockage (circled in red in the distance).

Apportioning the Relative Contribution of Different Sources

The Hallett mine owner told me that sand can’t escape his pits. I remain skeptical.

To be fair, some of the sediment in the channel blockage likely came from river-bank erosion and sand bars upstream.

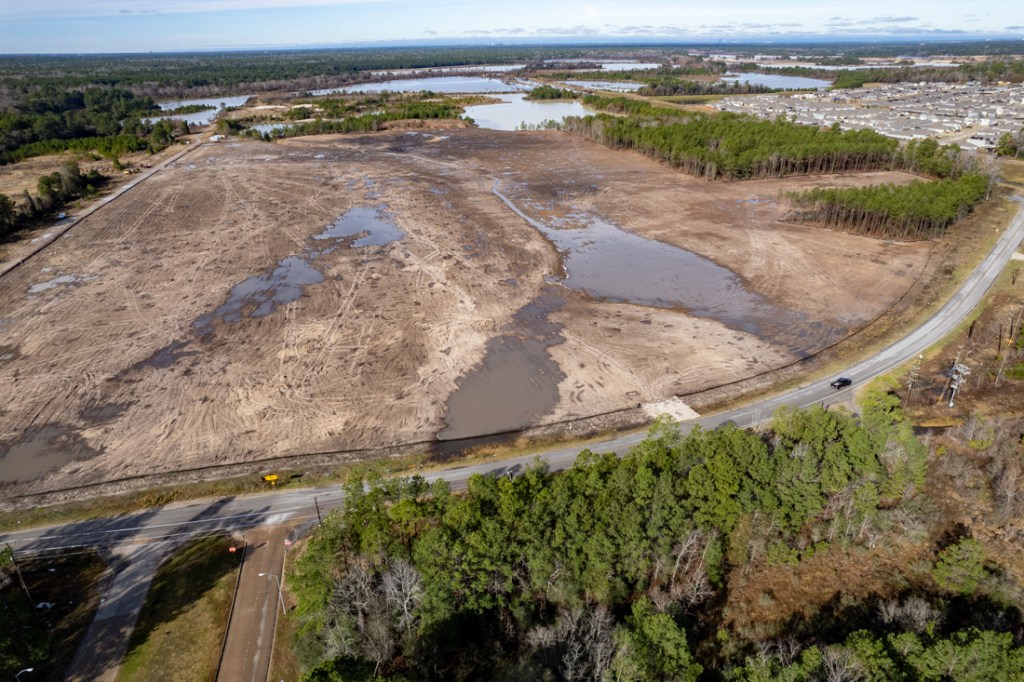
Also, a new development called Northpark South, now in the clearing stage, likely also contributed to the blockage. Silty stormwater flows unchecked from it into a second abandoned mine (also owned by Hanover Estates) and then into the blocked drainage ditch.

Northpark South, which drains into Northpark ditch is being built over wetlands.
Northpark South photo from January 24, 2024, looking south toward abandoned mine, blocked ditch and river in distance.

No one can say that Hallett and Northpark South contributed all of the material in the blockage. But it would be hard to pretend that none of it came from them.

The mine is still leaking two weeks after the flood!

And even before the flood, a giant ravine was sending stormwater from Northpark South into the second abandoned mine on the south side of the ditch.

ravine at Northpark South
Northpark South on December 28, 2023 before flood. Note ravine caused by erosion.

That mine drains into the blocked channel directly above the blockage. (See very first shot in this post.)

The SJRA, which is investigating sedimentation in the river basin, relies on a sediment gauge at I-45 – upstream from the mines and most of the new developments along the river. So they can’t really help sort out this issue.

The Calm After the Storm

Now that the immediate danger has passed, we need to investigate the contribution of mining and floodplain development to sedimentation.

When rivers and ditches fill up with sludge, it reduces conveyance.

Then, when the next flood comes, instead of water staying within the riverbanks, it may back up or overflow into living rooms.

The greatest area of deposition will normally be where floodwater slows down as it reaches a standing body of water like Lake Houston. We’ve seen what that led to.

Corporate waste-disposal practices are matters of public safety and concern. We need to examine them more closely.

If Hallett and/or the Northpark South developer wish to respond to this editorial, I will be happy to post their points of view.

Posted by Bob Rehak on 2/9/24

2355 Days since Hurricane Harvey

The thoughts expressed in this post represent opinions on matters of public concern and safety. They are protected by the First Amendment of the US Constitution and the Anti-SLAPP Statute of the Great State of Texas.

Another RV Resort Coming Near North End of Woodland Hills Drive

Yet another “RV Resort” is coming to the Kingwood/Porter area. This one will be at the north end of Woodland Hills Drive about a block north of Kingwood Park High School. Plans show parking for 43 RVs on the 4.4 acre property.

The Porter Strong RV Resort, which contains a recreation building, dumpsters, and concrete driveways, will back up to homes along Birchwood Springs Avenue in Woodridge Forest.

The drainage calculations look impressive…until you consider the way they estimated impervious cover.

Location map from construction plans obtained via a FOIA Request to MoCo Engineering. Note: High School is mislabeled. Should say, “Kingwood Park High School.”

Access from Porter For Now

Access to the RV resort – at least for now – will be via Needham Road and Collette Lane in Porter. However, plans show a dotted line for an extension of Woodland Hills Drive, which currently stops approximately 300 feet short of the development. It’s not immediately clear whether Montgomery County or the developer plans to extend Woodland Hills north at this time.

Drainage and Detention Plans

For the full construction and drainage plans, click here.

Drainage in this area flows south to Bens Branch. Note in the layout above that two 7-foot-deep, dry-bottom, stormwater-detention basins flanked by drainage swales will help intercept stormwater flowing south before it reaches adjoining properties.

FEMA shows no floodplains in the area and USGS shows no wetlands on the site.

The detention basins for the 4.4 acre site will hold 4.4 acre feet of stormwater before they start to overflow. That exceeds Harris County Flood Control District’s minimum recommendation for areas flowing into Harris County.

Moreover, the engineer claims the site only requires 3.4 acre feet in a 100-year storm. That calculation is based on Atlas-14 requirements adopted by Montgomery County.

The engineer indicates that the maximum discharge rate for the ponds, which will be pumped, is about 8 cubic feet per second less than the natural runoff rate for the site. So for everything up to the 100-year storm, runoff going into Bens Branch from this area should be reduced.

All that is good news. Now for the bad news.

The engineer seems to have based all those calculations on 29% impervious cover.

That seems unlikely for this type of project. The number of parking spots per acre is roughly equivalent to the Laurel Springs RV resort which claimed to have 66% impervious cover, but likely has much higher.

Best practices require excluding detention basins from impervious cover calculations. A quick glance at the construction diagram above suggests that concrete will cover much more than a third of the remaining property.

Also, the engineer says it will take 48 hours to drain the ponds after a 100-year rain. The ponds do not appear to empty by gravity, however. They will require pumps, which could present problems in a power outage. Such outages frequently occur in storms strong enough to create floods.

Pictures Taken on 2/1/24 Show Extent of Construction

Currently, the site is being cleared. Construction has not yet started. I took the shots below on 2/1/24. They show the extent of clearing as of last week.

Looking SW at construction site. Woodland Hills and Kingwood Park HS on left. Northpark Rec Area top center. Homes are in Woodridge Forest.

Looking W toward Woodridge Middle School at top of frame.
Reverse Angle. Looking E toward Woodridge Village. Surrounding areas already include a number of mobil homes and RVs.

Bens Branch Getting Crowded

I hope contractors build what the plans indicate. Bens Branch has enough flooding problems of its own. The Kingwood Area Drainage Analysis showed that parts of the stream could flood in a two-year rain.

Since that study, several high-density developments have been built nearby in the watershed. They include The Preserve at Woodridge, which apparently understated the amount of impervious cover, and Brooklyn Trails, which was grandfathered under pre-Atlas-14 requirements.

And then there’s the Northpark Drive Expansion Project, which is seeking more room for another detention basin to mitigate its own increases in impervious cover.

For now, the best thing to do is remain vigilant.

Posted by Bob Rehak on Feb. 7, 2024

2353 Days since Hurricane Harvey

The thoughts expressed in this post represent opinions on matters of public concern and safety. They are protected by the First Amendment of the US Constitution and the Anti-SLAPP Statute of the Great State of Texas.

River Wakes Up From Flood With Bad Hangover

After January’s five-day hydro-fest, Houston area rivers, streams and ditches look like they woke up with a bad hangover. Some areas are hiding under broad blankets of sand. The root balls of uprooted trees jutted up from the San Jacinto riverbed like tank traps on a battlefield, a testament to how shallow the river has become once again. And sand, in at least one case, has totally blocked off a drainage ditch.

Photos at US59 Bridge over San Jacinto West Fork

Kingwood-area resident Robin Seydewitz took the three images and video at the US59 Bridge this morning (2/5/24).

Newly deposited sand.
y20-second YouTube video by Robin Seydewitz, panning west to east under bridge. Shows debris build-up.

Sediment Build Up Alarming

The January flood was not as bad as Harvey. This was a much smaller flood – the type that happens far more frequently – like every 2 to 5 years depending on where you live.

The danger is not so much what this flood deposited, but what similar floods can deposit over time and how they can reduce the conveyance of rivers, streams and ditches. All the accretions add up like hairballs in your shower drain.

Here’s how one minor storm totally blocked a ditch after one storm.

Northpark ditch blocked by sand/sediment after January flood. Pictures taken before the storm last November show it flowing freely. Taken 2/5/24.

Upstream of this blockage along the ditch, the Northpark South development, built on wetlands, is dumping its drainage into the abandoned sand mine on the right.

The 5-square mile Hallett sand mine is upstream on the left. Two residents/neighbors of the mine have witnessed the company pumping sludge from its settling pond on several occasions since the flood. The latest was tonight as I posted this article. They may have contributed to the build up also.

The Hallett operation is so large that the company actually mines sand on both sides of the river. You can see a small part of their operation below at the top of the frame.

Reverse angle. Taken 2/5/24.

Of course, some of the sediment shown in these photos comes from river bank erosion.

But some also comes from sand mines and new developments that have clearcut thousands of acres without taking precautions to control runoff. See examples below.

Northpark South developer clearcut wetlands and is draining through sand mine into West Fork where blockage appeared. Picture taken Jan. 24, 2024 during lull in rain.
Looking back at 2023
Evergreen Development at SH242 and FM1314
Colony Ridge drainage ditch in East Fork Watershed. Few if any of the ditches and detention ponds in the development have erosion protection measures installed per Liberty County regulations. Colony Ridge is now 50% larger than Manhattan.

Of course, we have many responsible developers and sand miners. But we also have some who are not.

Turning Natural Events into Unnatural Disasters

Robin Seydewitz is the river enthusiast, canoeist, kayaker, and flood activist who took many of the photos above. She said, “Sand mines that don’t operate safely are a big part of the problem. So are developers who clearcut land without barriers or natural vegetation to stop sediment from running off. The lack of enforcement for drainage regulations is another part of the problem. We need more protection for the public. This is my opinion. We are not protected; the mine owners, operators and developers are.”

The moral of this story?

We need better enforcement of drainage regulations. And we need another river survey, like the one we had after Harvey, to see how much conveyance has been reduced.

“It is foolish to keep dredging parts of the river downstream without addressing root causes upstream.”

Robin Seydewitz

Posted by Bob Rehak on 2/5/24

2351 Days since Hurricane Harvey

The thoughts expressed in this post represent opinions on matters of public concern and safety. They are protected by the First Amendment of the US Constitution and the Anti-SLAPP Statute of the Great State of Texas.

Friendswood Clearing 553 Acres in Huffman

Friendswood Development Company has started clearing 553 acres west of Huffman-Cleveland Road. It will eventually extend from Northwood County Estates on the north to Cypress Point on the south. Plat records show that Friendswood has named the development “Sila.”

Long, Narrow, Dense Homesites

The new residential community will contain an unspecified number of homesites, most long and narrow. This will certainly increase the percentage of impervious cover relative to the surrounding area.

Detail from Sila Section 3 plat approved by Houston Planning Commission in 2023.

Existing homes sit on larger, heavily wooded lots. So, this and other new, nearby developments will change the character of the area considerably. Along with that will come more traffic and congestion.

To put that in perspective, I talked to one homeowner in nearby Northwood Country Estates who owns a five-acre lot.

Forty-five of the lots indicated above could fit on his property.

Drainage Plans

Friendswood appears to be almost halfway done with clearing land for Sila. Consistent with best practices and construction plans, contractors appear to be clearing one section at a time, installing perimeter catchment ditches, erecting silt fence, and stabilizing land before moving on to the next area.

Detail from Sila drainage impact analysis.

The drainage analysis also claims that the development will provide more than the minimum amount of required detention-basin capacity. The minimum required is .65 acre feet per acre. But the engineering firm BGE says it will provide .67.

The minimum requirement was established by Harris County Flood Control District in 2019 after Hurricane Harvey. So, it should accommodate 100-year rainfalls projected under Atlas 14, NOAA’s current standard for rainfall estimates.

Approximately the northern half of this area has been cleared to date.

Approximately Half of Land Cleared So Far

The pictures below, all taken on 2/3/24, show the areas cleared so far.

Looking west over Huffman-Cleveland Road at extent of clearing. Curvature in road is caused by wide-angle-lens distortion.

The yellowish runoff in the foreground of the photo above is from Saint Tropez another new, but different development seen in the background of two pictures below.

Note the ditches that channel runoff away from homes in Northwood County Estates in upper right.

A 1.5 inch rain the night before I took these photos caused the ponding water you see.

Reverse angle. A series of three connected stormwater retention basins will flank the main entry road. Area to right (south) has not yet been cleared.
Looking east toward Saint Tropez across Huffman-Cleveland Road. Friendswood appears to have planted grass in foreground to reduce erosion.
Silt fence protects neighbors in other areas cleared earlier.

Proposed Lake Houston Mitigation Bank

The Sila property will drain into hundreds of acres that are part of the proposed Lake Houston Mitigation Bank.

Looking W at wetlands and floodplain between Sila and the East Fork San Jacinto.

LH Ranch has proposed creation of the wetlands mitigation bank here.

East Fork San Jacinto River and Lake Houston Park beyond.

The preservation of so much land will help protect homebuyers from flooding. It will also provide wildlife habitat and an exceptional recreational amenity. Here’s the prospectus for the mitigation bank presented to the Army Corps. Corps approval still appears to be pending as of this writing.

Areas of Concern

Two areas of concern, however, exist near the land most recently cleared. Contractors have not yet erected silt fence or dug protective ditches behind some of the neighboring homes on Davidson Lane in Northwood County Estates.

Looking S. Neighboring homes in upper right were still unprotected from runoff when I took this picture on 2/3/24. Water flows from left to right toward East Fork San Jacinto out of frame on the right.
Looking W. Note how runoff is draining across neighbor’s property. A larger rain could have caused damage.

Neighbors in Northwood County Estates are also concerned with how existing drainage will tie into Sila’s drainage. Elevations on county drawings and Sila’s drawings differ in places. So residents are asking for confirmation that existing ditches will continue to drain properly.

Ditch at end of Davidson Lane in Northwood Country Estates.

For the most part, with the exceptions noted above, Friendswood seems to be responsibly navigating the perilous early phase of development between clearing and the installation of drainage.

Posted by Bob Rehak on 2/4/24

2250 Days since Hurricane Harvey

The thoughts expressed in this post represent opinions on matters of public concern and safety. They are protected by the First Amendment of the US Constitution and the Anti-SLAPP Statute of the Great State of Texas.

WLHP Developer Still Flooding Neighborhood

Overnight, the gauge at West Lake Houston Parkway (WLHP) and the West Fork received 1.44 inches of rain. And once again, runoff from Trammell Crow’s High Street Residential apartment complex on WLHP flooded surrounding streets and neighbors.

Visit from Engineering, Pollution Control and Constables

Harris County Engineering made a series of visits to the work site earlier this week in an effort to bring the developer into compliance with stormwater regulations. Harris County Constables and Harris County Pollution Control even accompanied the engineering staff to the site on 2/1/24.

After that visit, a member of the engineering staff told a neighbor that work at the site had been shut down until contractors came into compliance. Reportedly, mitigation work was the only work allowed on the site. But evidently, the developer had other priorities.

Sediment-laden runoff from construction sites is one of the main sources of sediment pollution in rivers and lakes. It has been linked to blockages that contribute to flooding.

Changes Between 2/1/24 and 2/2/24

On Friday, 2/2/24, I paid the site the Trammell Crow construction site a visit and saw some stormwater-mitigation work in progress. Specifically, contractors appeared to have:

  • Dug a small pond to let sediment settle out of water.
  • Dug a channel toward it.
  • Cleared muck off the sidewalk on Kings Park Way.
  • Placed a short length of wattle roll between the street and worksite along Kings Park Way. (Wattle is a temporary erosion control and sediment control device used on construction sites to protect water quality in nearby streams, rivers, lakes. During rain storms, the rolls intercept surface stormwater runoff and reduce the velocity of flow.) 
  • Placed wattle in front of one of the two storm drains on Kings Park Way along the southeast side of the development.
  • Erected a six-foot-high privacy fence around three sides of the site.
  • Stationed a guard at the worksite entrance. They clearly didn’t want anyone documenting what they were or weren’t doing.

Had they spent as much time erecting a runoff barrier as they did the visual barrier, they might have prevented another stormwater debacle.

Other work unrelated to stormwater mitigation also appeared to be underway at the site Friday afternoon.

Still No Results

By 8 am Saturday morning (2/3/24), my phone was blowing up. Irate neighbors were sending me videos. Once again, Kings Park Way and West Lake Houston Parkway were being flooded.

Screen capture from video sent by reader 8:43am 2/3/24. For full video, click here or on image.

By 10:30 am, the same intersection looked like this.

Someone had removed the wattle and a sand bag to let the street drain. Note the new privacy fence in background.

That’s one way to solve a street-flooding problem. Flush the silty muck down the storm drain.

At noon, here’s what you could see elsewhere with a drone.

Looking toward the same troubled corner from the other side of the fence. Note water seeping underneath.
Elsewhere, they had begun digging a trench to channel water toward the sediment pond.
But the trench from the troubling corner did not reach the sediment pond.

Unprotected Perimeter Remained

Beyond the main entry, no silt fence and water leaking under privacy fence, which was leaning over.
At the back of the property, no fence at all and water flowing into neighboring property.
Water was escaping all along the back of the property.

Perhaps the developer should have spent more time controlling stormwater and less time concealing the site with a half mile of privacy fence.

It makes me wonder whether their values are misplaced.

Posted by Bob Rehak on 2/3/24

2349 Days since Hurricane Harvey

The thoughts expressed in this post represent opinions on matters of public concern and safety. They are protected by the First Amendment of the US Constitution and the Anti-SLAPP Statute of the Great State of Texas.

Northpark Tree Transplantation Finished, Drainage Updates

Despite constant rain that brought widespread flooding to the Houston region last week, contractors finished the Northpark tree transplantation. They also made significant progress on two other parts of the road expansion project since my last update two weeks ago. I took the pictures below on 2/1/24 with one exception.

Among the highlights:

  • Dozens of trees were transplanted on the south side of Northpark at US59. The trees now form an arc around what will eventually become a decorative pond/retention basin on the south side of the intersection.
  • Excavation of a companion decorative pond/retention basin on the north side of Northpark is much farther along than in my previous report.
  • The first leg of 8-foot culvert linking the ponds with Ditch One is almost complete. The other two legs (under the railroad tracks and from US59 to Loop 494) should start within weeks.

Ideal Weather for Northpark Tree Transplantation

The cool, wet weather created ideal conditions for the transplanted trees to take root and thrive. Ralph De Leon, project manager, noted that the spacing of the trees also gives them room to spread and thrive.

Each transplanted tree has a ring around the base designed to retain supplemental water. The trees will receive extra water for two years to ensure they thrive after the shock of being transplanted.

Looking south. Transplanted trees will form a backdrop for what will soon become another decorative pond.

Pond Excavation Progress

Meanwhile, across Northpark, excavation of the first of two ponds is proceeding despite the wet weather.

Looking north. Across Northpark Drive, excavation of the pond/retention basin is already well underway.
Reverse angle of same area makes it easier to see the extent of excavation.

Excavated dirt is being stored temporarily at a sand mine on Sorters-McClellan Road. After the culverts are installed down the center of Northpark, contractors will retrieve the excavated dirt and place it over the culvert sections to form the road bed.

The pond above will go 8-12 feet deeper than you see now. The contractor is only digging down to the water table for now until: a) pond liners arrive and b) drainage connections for the ponds are complete. That’s because the contractors will have to continuously pump water as they excavate to the final depth.

Pond Landscaping Plans

That horse-shoe-shaped area on the left (above and below) will be a decorative focal point for the pond.

The trench you see above will contain a brick retaining wall that keeps the area from eroding into the ponds.

Final design of the north pond will look like this.

The peninsula will contain decorative trees, shrubs and other plantings.

The next diagram shows how the north and south ponds will closely mirror each other.

Current plans call for colorful crepe myrtles. Japanese ardisia, a ground cover, will ring the area.

Japanese ardisia, also called marlberry, is a flowering, evergreen ground cover introduced from the Far East. It is a low-growing, woody shrub that spreads laterally while growing to a height of 8-12 inches.

No Identifying Entry Signage

Unlike Kingwood Drive, where KSA owns the land behind the ponds, TXDoT owns all the land at Northpark Drive. So you will not see any prominent Kingwood identification as you do at Kingwood Drive.

Drainage Progress Between Railroad and Ditch One

The entry ponds above will drain to “Ditch One.” The ditch runs parallel to Northpark behind the businesses on the north side of the road.

Culverts will carry the water from the ponds eastward, then under Loop 494 and the railroad tracks. The culvert will then turn north and back east again behind the businesses (see red line below).

Route of culvert from entry ponds to Ditch Ditch One.
Route of drainage from north pond to Ditch One. Photo from 1/24.

The agreement with UnionPacific to tunnel under the tracks has been completed and the plans approved. However, tunneling has not yet started. UP indicated that their busy season ends after February, so boring under the tracks will likely be delayed until then for safety reasons.

Regardless, the link to Ditch One around the storage businesses above is almost complete. Culvert has already been buried parallel to the tracks and behind two storage businesses.

Looking SW. Culvert placement almost complete. Contracts use the dirt to level ground above the culvert.

Existing drainage will join the new culvert behind those businesses. Currently, contractors are working on the junction. See below.

The new 8′ pipe from the ponds is the one with the man standing inside of it.

Contractors are also working on the outfall into the ditch. Because of the expected velocity of the water, they must create concrete walls to prevent erosion of the surrounding earth that could undermine the pipe.

Start of the concrete outfall into Ditch One.
ditch one
Ditch One (center) will then carry the stormwater to the Kingwood Diversion Ditch and Bens Branch.

Ditch One will eventually be widened to handle the increased flow. Connecting the ponds at US59 to the link under the railroad tracks should start in the next few weeks.

The project requires the additional retention and drainage capacity shown above to handle runoff from the extra lanes of traffic.

In front of the businesses shown above, Northpark will eventually expand to 10 lanes from the current four. Six will carry traffic on a bridge over the railroad and Loop 494. Four turn lanes will remain at ground level – two on each side of the bridge. The two will let traffic turn north or south onto 494 from each direction.

Built to TXDoT Highway Standards

This entire project is being built to TXDoT highway standards. Those standards exceed normal neighborhood street standards. You would expect nothing less for what will eventually become a critical evacuation route for 78,000 people.

  • Lanes will be 12-feet wide instead of 10 to safely carry traffic at higher speeds.
  • Concrete will be much thicker than normal to carry heavier loads without cracking.
  • Storm drains will be sized to carry the volume of runoff you would expect from highways. The wider inlets will help avoid water flooding roads during intense rainfalls.

Greater Safety at Rail Crossing/Loop 494

Safety will also improve at the railroad crossing.

  • A bridge will carry most traffic over the railroad.
  • The entire train track at Northpark will have a one-piece steel and concrete foundation. That will reduce the chance of track shifting or dipping and causing a derailment.
  • Pedestrian/bicycle crossings will have “escape gates” in case people get caught on tracks when trains come through.

However, installation of those safety improvements will cause some inconvenience. To install that one-piece steel and concrete foundation, the railroad will shut down for three days. That will require closing off Northpark for three days also.

Originally, project managers hoped to have four lanes open at all times for the duration of the project. So this is a change.

All in all, a 3-day shutdown is small price to pay for a great improvement in safety.

The road closure is still months away.

For More Information

For more information about the project including construction plans, visit the project pages of the LHRA/Tirz 10 website. Or see these posts on ReduceFlooding:

Posted by Bob Rehak on 2/2/24

2348 Days since Hurricane Harvey

After Quitting Time, Contractor Pumps Silty Stormwater into Street

1/31/24 – At 5:20 today, about the time government inspectors usually knock off work and the sun was setting, I got a tip from a reader. The reader alerted me to flooding on Kings Park Way near West Lake Houston Parkway, adjacent to a new Trammell-Crow apartment complex that Harris County Engineering had cited for stormwater violations. I hustled down there. Here is what I found.

One Lane Flooded

The contractors were pumping silty stormwater into the street and flooding one lane of the road.

The hose pumping the water into the street appeared to be at least 4 inches.

They had placed sand bags around one storm drain to help filter the silt.

But the silty stormwater was so deep, it flowed in both directions…

…straight into another unprotected City of Houston storm drain down the block.

Mud covered sidewalks ankle deep…

…while an excavator dug a trench to make more muck flow toward the pump.

From the wet marks on the pavement, it appeared that the discharge had covered the entire right lane at one point.

This is Phase II of an apartment complex development. The land you see is owned by Kingwood Residences HTX and HTX II LLC. Both LLCs are owned by High Street Residential, a wholly owned operating subsidiary of Trammell Crow Company in Dallas. Their local headquarters are on 2800 POST OAK BLVD STE 400, HOUSTON TX 77056-6169. In case you chose to write them.

Public-Safety Issue

According to one study, “Sediment pollution is the single most common source of pollution in U.S. waters. Approximately 30% is caused by natural erosion, and the remaining 70% is caused by human activity. Construction activity is the most common source of sediment pollution. According to the Environmental Protection Agency, sediment pollution causes approximately $16 billion in environmental damage annually.”

Clogged drains affect road safety. Clogged rivers affect flood safety.

After Hurricane Harvey, the Army Corps found that sediment had blocked 90% of the West Fork. Dredging cost hundreds of millions of dollars. And another email from a boater that I found waiting for me when I got home from the disaster site alerted me to the fact that sediment is building back in at an alarming rate.

Perhaps Mr. Crow could help with the next round of dredging. In 2020, Trammell Crow Holdings was worth an estimated $19.6 billion.

Posted by Bob Rehak on 1/31/24

2346 Days since Hurricane Harvey

The thoughts expressed in this post represent opinions on matters of public concern and safety. They are protected by the First Amendment of the US Constitution and the Anti-SLAPP Statute of the Great State of Texas.

Developer on WLHP Cited for Stormwater Violations

In response to citizen complaints, Harris County Engineering has visited a construction site on West Lake Houston Parkway three times and issued an unspecified number of stormwater violations.

Both phases of the development, Kingwood Residences HTX and HTX II LLC, are owned by High Street Residential, a wholly owned operating subsidiary of Trammell Crow Company in Dallas. Apartments are being built on Phase I. Meanwhile, Phase II is still in the clearing phase.

According to Danielle Cioce, Manager of the County Engineering Department’s Watershed Protection Group, “They are in the process of making the necessary repairs. We will continue to monitor the site to ensure it comes into compliance and remains that way.”

However, as of today, the developer appeared to fall short of compliance. I saw no activity on the portion of the site still being cleared. The reason was unclear. Cioce did not respond to multiple requests for comment today.

Effective Stormwater Measures Still Not in Place

I visited the site myself three times in the last week and have seen few changes since my initial post on this subject two weeks ago in response to a reader complaint.

The developer lacked normal safeguards against sediment escaping from the site, such as silt fences. Neither did the developer have sandbags to catch sediment in street gutters before it entered storm drains.

Such sediment escaping into the San Jacinto West Fork has been connected with flooding in the Lake Houston Area. The Army Corps estimated that the San Jacinto West Fork was 90% blocked near here after Hurricane Harvey.

How much of the sediment in the river is natural and how much man-made? One study found that approximately 30% of sediment pollution is caused by natural erosion, and the remaining 70% is caused by human activity. Construction activity is the most common source of sediment pollution, according to the study.

During a break in the rains last week, I photographed the High Street Residential site on West Lake Houston Parkway. It lies between Upper Lake and Kings Park Way. Without any of the normal safeguards, silty water poured off the site straight into storm sewers.

Photo taken 1/24/24 at West Lake Houston Parkway and Kings Park Way shows silt stormwater escaping into street.
Same day. Slightly different angle shows volume of muck.
Same day. Ground level shot shows runoff streaming into unprotected drain. Note lack of silt fence.
Runoff streamed over curb.
The Army Corps, City, and TWDB recently spent $220 million on dredging the East and West Forks.

What Construction Plans Say Should Happen

I received the approved construction plans from HCFCD via a FOIA Request. They clearly state that contractors should have sediment protection controls in place before starting construction. Regulations also require the contractor to:

  • Document the date of installation of erosion control measures
  • Retain measures in place until permanent stabilization of soil
  • Make field adjustments as needed to maintain the effectiveness of all measures
  • Keep a record of weekly inspections that verify measures are functioning properly.

But that’s not all. See the two screen captures below from the construction plans.

Photos Taken 1/29/24 Show Aftermath of Last Week’s Rain

I returned to the site today, two and a half days after the rain stopped. Water was down slightly, but contractors still had not installed effective stormwater control measures.

Silt fence was missing. So were sandbags to guard the storm drains. In some places where silt fence had been installed, it had fallen over from the weight of runoff accumulated behind it. In other places sediment had collected knee-high to the top of the silt fences. See below.

Silt fence guarding the stormwater detention basin overwhelmed by eroded sediment. This suggests volume of runoff in other areas without silt fence.
Phase I has no silt fence along most of the perimeter. Shown here: construction in progress along Upper Lake is guarded by a chain-link fence.

The developer had installed sandbags in a gap in the silt fence, but left gaps in the line of sandbags.

Note gaps in silt fence toward corner. That faint line guarding the corner is a line of sandbags. But…

The gaps channeled stormwater straight toward the storm drain in the first sequence of photos. See below.

Enlargement from previous photo shows gaps in line that channeled runoff toward street drains.

Accidental or intentional. You be the judge.

Someone will have to spend a lot of time in the “how come” room on this one.

Posted by Bob Rehak on 1/29/24

2344 Days since Hurricane Harvey

The thoughts expressed in this post represent opinions on matters of public concern and safety. They are protected by the First Amendment of the US Constitution and the Anti-SLAPP Statute of the Great State of Texas.

All Floodwaters Receding, But Flood Warnings Remain in Effect

1/28/24, 2PM – After a week of near-constant rain and flooding, all river and lake gauges in the area show floodwaters receding, even if they aren’t below flood stage yet.

Whew! If you didn’t flood, you can stop worrying.

Nevertheless, the National Weather Service (NWS) still has flood warnings in effect for the areas:

  • Near the San Jacinto East Fork at FM1485 in New Caney. The warning affects people in Montgomery, Harris and Liberty Counties. Expect moderate flooding, primarily in low lying areas through Tuesday. The river is currently at 62′; flood stage is 58′ at that location.
  • West Fork around US59 until Monday afternoon. The river was at 51.4 feet, but bankfull is 45.3 feet.
  • Around Sheldon, below the Lake Houston Dam until tomorrow morning.

Photos Before, During, After Flood Crests

Below are 18 pictures I and a reader (who prefers to remain anonymous) took this week shortly before and after flood crests arrived. Each is dated and appears in chronological order. Together, they give you an idea of the extent of flooding. People who live in low-lying areas near major rivers were most affected.

But others, still suffering PTSD from previous floods, watched and waited with a sense of impending doom, wondering whether the water would claim their homes. It was a week of high anxiety and sleepless nights for many.

East Fork at Plum Grove

FM2090 over East Fork San Jacinto at Plum Grove. Thursday, 1/25/24.

It was hard to tell where the East Fork was at times. The river had penetrated an adjacent sand mine in multiple places and was flowing through it.

East Fork (upper left) broke through dike of abandoned sand mine and started flowing through it. Thursday, 1/25/24.
Rising water flooded the sand mine and isolated an adjacent house. Thursday, 1/25/24.
Looking west toward West Fork across Northpark South. Despite the ditch that contractors dug to drain the wetlands, a lot of water is still ponding. Thursday, 1/25/24.

West Fork in Humble/Kingwood Area

On Friday, 1/26/24, rising West Fork floodwaters near US59 invaded the neighborhood north of the bridge.
West Fork at US59 on Friday, 1/26/24. Rising water flooded turnarounds under the freeway on both sides of the river.
Friday, 1/26/24. Confluence of West Fork (right) and Spring Creek (left). Contrast enhanced to show that flow came predominantly from West Fork at this time.
Saturday 1/27/24. Homes isolated by floodwaters just south of New Caney ISD’s New West Fork High School (upper right).
Looking west, farther downstream on the West Fork at homes along Lake Point and North Shore Drives.
Saturday 1/27/24. KSA River Grove Park parking lot, boardwalk, and bridge to soccer fields were all under water.
Saturday 1/27/24. Golf course near Barrington subdivision flooded.
Saturday 1/27/24. Edgewater Park at US59 and West Fork partially underwater.
Kingwood County Club’s Forest Course becomes a Water Course south of Kingwood Greens subdivision.
At Kings Harbor on Saturday 1/27/24, water topped the pier, and the riverwalk, but didn’t get into businesses.
Sunday, 1/28/24. Looking at West Fork and adjacent sand mines from Northpark Woods. Note multiple breaches in dikes of two abandoned sand mines. Photo courtesy of reader.
Sunday 1/28/24. Courtesy of reader. Looking west past Northpark Woods (lower right). Note level of water in ditch. Google Earth measurement shows the water extends more than 3,000 feet up the ditch. That’s more than half a mile.
Farther up the ditch, you can see silty water from the mines on left and right mixing with water in the ditch. Photo courtesy of same reader.

Takeaways from Flood

I took several things away from this experience.

  1. Sediment mainly moves during floods. It’s too early to tell how much moved and whether it will be enough to impair the conveyance of rivers, bayous, creeks and ditches. But this flood represents a major opportunity for the engineers conducting the SJRA’s sedimentation study.
  2. Even relatively small amounts of rain (a couple inches per day) caused some major heartburn.
  3. The SJRA’s modeling nailed the flood peak on the West Fork. Even when the National Weather Service was predicting a peak in the 52′ range at US59, the SJRA said it would be 53.5′. The actual peak was 53.71, within tens of an inch.
  4. SJRA claimed the rainfall in the Lake Creek watershed was a major contributor. They don’t control that. It joins the West Fork downstream from the Lake Conroe Dam. A gage on Lake Creek showed 9.8 inches fell there in five days – among the highest totals for the region.
  5. The recent freeze killed a lot of vegetation that would normally have slowed runoff. That contributed to faster, higher peaks, according to testimony given during the SJRA board meeting last week.
  6. The SJRA did a much better job of communicating its gate operations to the public during this storm than ever before. It sent out a stream of press releases explaining what it was doing and why. I even received a personal call from an SJRA board member at 9pm before they increased their release rate to 19,500 cfs.
  7. The timing of the calls to news media got the news of the release on the 10 o’clock news before people went to bed. During Harvey, that didn’t happen. Many people were caught sleeping in bed by rising flood waters and had to evacuate by boat. Lesson learned.
  8. We need to do a damage assessment both upstream and downstream from the Lake Conroe dam to see where damage was concentrated. Did the SJRA do a good job of balancing upstream and downstream interests? Could gate operations have been improved?
  9. The SJRA says it waited to release water until it got within 6 inches of the top of its tainter gates. Had the water gone over the top of the tainter gates, they could have lost control. The gates would have become inoperable and the dam could have been placed in jeopardy.
  10. One leading hydrologist told me, “Understanding watershed hydrology is difficult. It rained quite a bit over a very large area. Watersheds all respond differently. The timing of the runoff reaching channels is crucial. How it combines with all of the other runoff from different places is key.”
  11. We need more floodgates on Lake Houston.

The worst of this event is behind us. Now comes the hard part. Cleaning up.

I wasn’t able to cover every area that flooded during this event. So, if you have photos of the flood or its impact that you would like to share, please submit them through the contact page of this website. Understand that all photos used here are in the public domain and may be shared by others. Finally, please indicate whether you would like a picture credit, and if so, how it should read.

Posted by Bob Rehak on 1/28/2024

2343 Days since Hurricane Harvey

How Bad Was That Storm?

A week of rain has ended. Flood crests are passing. And many are asking, “How bad was that storm?”

The short answer to the question: depending on where you live in the region, you got a 1- to 5-year rainfall.

Why is that? And how do you determine it? It’s simple. Let’s start with the rainfall.

Step One: Determine the Amount of Rainfall You Got

If you don’t have a rain gauge, go to the Harris County Flood Warning System. Elsewhere in Texas, you can go to the Texas Water Development Board’s Mesonet.

For demonstration purposes, let’s focus on the Harris County Flood Warning System.

By default, the home page shows a map with the locations of gages with rainfall in the last 24 hours. But you can also select other time periods in the sidebar. The storm dropped water during most of the week. So I selected “7 Days.” I also selected “All Gages” to see the varying amounts of rainfall across the region.

Then I clicked “Watersheds,” and “Channels.” Automagically, 7-day rainfall totals appear over a map that lets you see which watersheds the rain fell in. That determines how it will work its way downstream to the Gulf.

From Harris County Flood Warning System on 1/27/24 at 6:18 am.

On the low side, values ranged from 4″ to 6″ south of Lake Houston. On the high side, they ranged from 9″ to almost 11″ north and west of Lake Conroe. Such variation is common.

Step Two: Find the Duration and Distribution of the Rainfall

When you click on any gage location, a “For more information” box pops up. Click the link to see the distribution and duration of rainfall.

The gage at the San Jacinto West Fork and US59 received 5″ during five days. If a giant peak on one day outweighed all others, you might want to investigate that particular day further. But in this case, most days were within a half inch of each other.

Now, you’re ready to find how that compares to other storms.

Step Three: Compare Recorded Totals to Precipitation Frequency Estimates

Next, compare recorded rainfall to expected rainfalls of different intensities and durations.

Most hydrologists currently use precipitation frequency estimates called “Atlas 14.” NOAA determines them.

To find the estimates for your area, enter your address here. You should see a table like the one below although your numbers may vary slightly depending on where you live.

This is where some judgment comes in.

Determine the “best fit” between your observations and NOAA’s estimates.

So, I started by looking across the seven-day row and highlighted the first box. It showed 5.76 inches. The smaller numbers in parentheses indicate possible variation due to uncertainty. Almost all the lower numbers fell within this range.

At the high end of the observed rainfall totals, I highlighted the 10.4 inch box as the most representative. Again, all of the observed totals north and west of Lake Conroe fell into the range in parentheses.

Atlas-14 rainfall probability statistics for the Humble/Kingwood area.

Looking up to the top of the table, you can see that the highlighted boxes correspond to the volume of rain you could expect once every year to five-years. Meteorologists also refer to these as “100% and 20% annual-chance” storms.

If you live elsewhere on the map, you might find your area received a 50% annual-chance storm.

Rainfall Chances Do Not Automatically Translate into Flood Chances

For the record, the flood at the West Fork and US59 this morning peaked at 53.71 feet. That’s three feet LESS than a 10-year flood at this location.

From NWS at 6 am Saturday Jan. 27, 2024

So, in this case, the flood level was generally consistent with a 5-year rainfall upstream. But that’s not always the case.

Many people assume that a rainfall recurrence interval of 1- to 5 years automatically translates into the same probabilities for flooding. It doesn’t.

First, for large watersheds, such as the San Jacinto, rain can vary drastically. Variation upstream will determine how high the resulting water surface elevations are at various points downstream when peaks arrive.

Also understand that annual exceedance probabilities for floods incorporate many more variables than rainfall probabilities. For instance:

  • Landscape/Slope – Is it flat or hilly? Will water be bottlenecked or does it have room to spread out?
  • Degree of development – Are you surrounded by farms or do you live in an urban area which produces more runoff faster?
  • Soil type – More water infiltrates into sandy soils than clay.

Regardless, engineers still consider rainfall probabilities.

How Engineers Use Rainfall Estimates

Why are rainfall estimates important? Engineers must design drainage and infrastructure to handle extreme rainfalls.

For instance, most storm sewers are designed to handle the type of rain you can expect every year or two. When you see water ponding in streets or underpasses, it’s because the storm sewers can’t carry the water away fast enough.

Houston’s recently upgraded infrastructure design standards aim to keep structures safe in a 100-year event. It matters not whether the rain happens in five minutes or 60-days.

Engineers use these estimates when determining the elevation of homes, setbacks from a river, the size of stormwater detention basins and more.

When you see flooding of streets or neighborhoods, it’s generally a sign that:

  • Rainfall exceeded the design standard
  • Something changed, for instance, a sewer was blocked, sediment has clogged a drainage ditch, etc.
  • Someone miscalculated or cut corners during design and construction
  • Infrastructure was designed to old (lower) rainfall probability standards.
Last night, before the West Fork (upper left) peaked, water started flowing across Hamblen Road, cutting off some residents in North Shore.

Experts base the probability of extreme future events on the frequency of extremely rare past events using a branch of mathematics called extreme value analysis.

It’s important to understand that rainfall probability estimates change periodically – especially after major storms, such as Tropical Storm Allison or Hurricane Harvey. Meteorologists acquire additional data on extreme storms from these events.

All rainfall probability estimates represent best guesses given knowledge at a point in time.

NOAA is already working on Atlas-15 estimates. Atlas 15 will take climate change estimates into account for the first time.

Going forward, NOAA will compile new precipitation-frequency estimates every 10-years.

Posted by Bob Rehak on 1/27/24

2342 Days since Hurricane Harvey