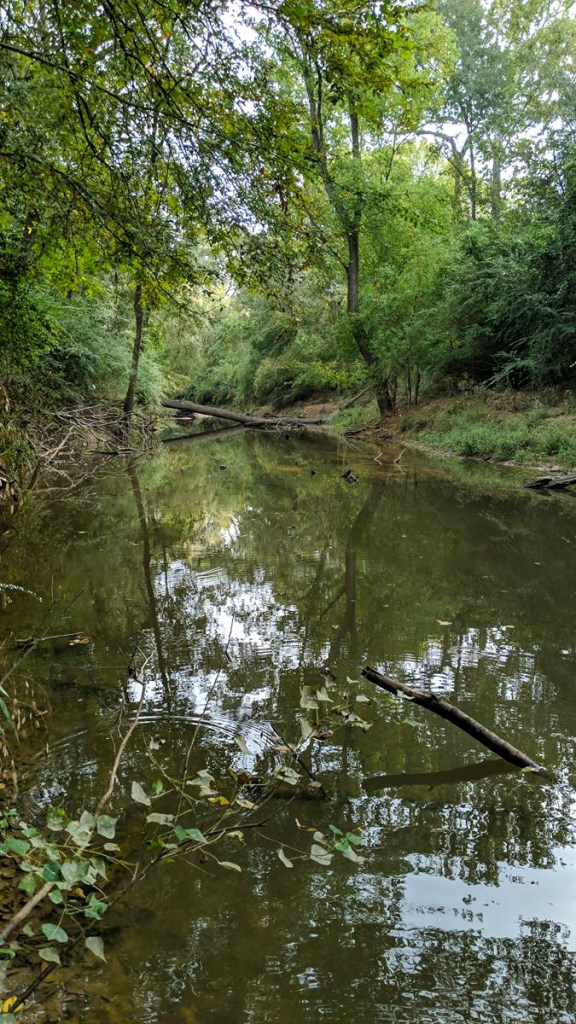
Harris County Flood Control, SJRA, and the Cities of Humble and Houston using funding provided in part by the Texas Water Development Board are searching for sediment solutions in the Upper San Jacinto River Basin. Their major scientific study includes all or parts of seven counties: Harris, Montgomery, Waller, Grimes, Walker, San Jacinto and Liberty – all land draining into Lake Houston.
From Technical Memorandum 1 of the Upper San Jacinto River Basin Regional Sedimentation Study.
The high-level goal: to better manage sediment in the river basin. Sediment reduces both floodway conveyance and the storage capacity of Lake Houston. Both contribute to the frequency and severity of flooding.
Among other things, the study partners hope to prioritize sediment hot spots so they can develop sediment solutions and recommendations.
I hope they look at Colony Ridge. It exemplifies a major hot spot and points the way to an obvious sediment solution – better enforcement of existing regulations.
Scope and Status of Sediment Study
The study is now about half complete. With much of the fieldwork complete, the partners will next focus on modeling, hotspot identification, area prioritization and sediment solutions, according to Matt Barrett, Water Resources and Flood Management Division Manager atSJRA.
To date, the study has examined a variety of factors:
Sediment Solutions Must Address Development Practices
Erosion occurs naturally. But poor development practices can accelerate the rate of erosion unnaturally.
Regulations in Liberty County call for backslope interceptor swales to prevent sheet flow over the sides of ditches. I have yet to see one such system anywhere in the 30+ square miles of Colony Ridge. What you typically see is this.
All that sediment washes downstream where it reduces the carrying capacity of rivers and the storage capacity of Lake Houston.
Liberty County regulations also call for planting grass on the side slopes of ditches and detention basins. The grass reduces erosion, too. But you don’t see much grass on those side slopes either.
Compare the ditch above with the ditch below in Harris County to see how grass and backslope interceptor swales can reduce erosion.
Small swales behind main slopes capture sheet flow heading toward the ditch. Pipes then take runoff to the bottom of ditch, thus reducing erosion on side slopes.
Here’s Colony Ridge again.
Three-mile-long Colony Ridge drainage ditch has no grass or backslope interceptor swales.
Address the Elephant in the Room Before the Next Disaster
Ironically, both Liberty and Harris County have almost identical regulations for erosion control. Harris County enforces them; Liberty County doesn’t.
Enforcement of development regulations is the elephant in the room.
So, as the SJRA and its partners search for sediment solutions, here’s one simple recommendation. Enforce regulations already on the books.
Colony Ridge and other developments that skirt regulations represent a disaster waiting to happen. Unfortunately, it will probably take a disaster, such as Harvey, to cause leaders to take action. But by then, it will be too late.
Posted by Bob Rehak on 10/20/23
2242 Days since Hurricane Harvey
The thoughts expressed in this post represent opinions on matters of public concern and safety. They are protected by the First Amendment of the US Constitution and the Anti-SLAPP Statute of the Great State of Texas.
https://i0.wp.com/reduceflooding.com/wp-content/uploads/2023/10/20231006-RJR_6038-1.jpg?fit=1100%2C733&ssl=17331100adminadmin2023-10-20 14:08:222023-10-20 17:39:42Search For Sediment Solutions Should Lead Straight to Colony Ridge
Ten days ago, the entire Republican Congressional Delegation from Texas asked State Attorney General Ken Paxton to investigate Colony Ridge, the controversial development in Liberty County. Today, he responded with a scathing letter that kicked Colony Ridge criticism up quite a few notches. Paxton also sent the letter to Governor Greg Abbott; Dade Phelan, Speaker of the Texas House; and Lieutenant Governor Dan Patrick.
Neighboring communities have also complained about crime, traffic, destruction of roads, and rapidly growing burdens on the Plum Grove Volunteer Fire Department.
Too Much Chaos to be Tolerated
Paxton asks whether a settlement the size of Colony Ridge should have been allowed to grow that large without annexation or incorporation. By some estimates, Colony Ridge now has upwards of 40,000 people. If accurate, that would make it larger than the three largest cities in Liberty County combined!
Paxton says, “…this unincorporated settlement has drawn far too many people and enabled far too much chaos for the current arrangement to be tolerated by the state.” Boom.
Colony Ridge Business Model Caters to Cross-Border Settlement
Then Paxton talks about the business model used by Colony Ridge. “Texas has seen a growing trend of real estate developers buying huge quantities of undeveloped land, creating primitive subdivisions, and selling the bare lots in a practice often paired with offering minimal-down-payment, high-interest owner-financed loans,” he says.
“These loans require little identity verification. Lax development codes for unincorporated areas mean residents can crowd onto a property and the residential population can expand quickly.”
Paxton continues, “This form of real estate development and financing has created an attractive opportunity for noncitizens to cross the border and settle in Texas, with fast-growing developments the size of entire cities forcing nearby areas to struggle to adapt to—and even subsidize—the influx of new residents enriching the developers.
Unmanageable Size
“The scale of the Colony Ridge development has proved unmanageable for effective law enforcement and other key standards of acceptable governance,” he says. “Violent crime, drug trafficking, environmental deterioration, public disturbances, infrastructure overuse, and other problems have plagued the area and nearby towns.”
Distorting the Intent of Municipal Management Districts
In the next page and a half of Paxton’s letter, he details how the developers, with the help of State Senator Ernest Bailes and Senator Robert Nichols, perverted the intent of Texas Local Government Code which deals with the creation of Municipal Management Districts (MMDs).
MMDs were intended to revitalize and beautify already developed urban commercial areas. They were not intended to develop raw land, according to Paxton.
The Colony Ridge MMD controlled by the developer started with 5 acres then annexed tens of thousands of acres – also owned by the developer.
“…the managers of this district function as the unelected, unaccountable leaders of a city that is inhabited by an unknown population including unvetted foreign aliens and whose unsustainable growth is protected by a specific state carve-out,” says Paxton.
“The burden displaced onto the surrounding areas to subsidize public services needed by those residing in Colony Ridge is significant.”
Ken Paxton, Texas Attorney General
Criticism of Two Texas Lawmakers
He adds, “I am beyond disappointed in Senator Nichols and Representative Bailes for apparently working to enrich specific developers at enormous expense to the rest of the public and reducing the quality of life for their own constituents.”
“It [Colony Ridge] is a sprawling, highly populated settlement that will soon outpace the population of many cities in Texas yet is ungoverned by any meaningful authority other than the developers whose primary interest is selling more property to new residents.”
Attacks Those Trying to Downplay Colony Ridge Problems
Paxton concludes by attacking journalists and politicians trying to downplay the problems caused by Colony Ridge. He says, “…the people of Texas … never assented to the creation of a sprawling unincorporated, ungoverned zone…”
Paxton does not mention this transaction specifically, but it falls under “enriching developers at the expense of the public.”
Note that the developer runs the MMD mentioned above. Also note how in these MMD board meeting minutes, the developer set the tax rate on his customers, gives his brother a $9.9 million paving contract and approves a reimbursement agreement for “the developer.”
The purpose of an MMD is to promote the public interest. But the developer is using his position as MMD president to defray his own costs. In a transaction that certainly raised my eyebrows, he and his board awarded a contract worth almost $10 million to Liberty Paving, a company controlled by his brother’s T-Rex Management Inc.
The developer has asserted that Colony Ridge is like any other community. All these photos below were taken on 10/6/2023, one day after the developer took several state legislators on a guided tour of the nicer areas in the development near the Grand Parkway – as the northern entrance flooded.
The neighborhood swimming pool.Note tarp for roof and trees growing in another pool.Colony Ridge residents often operate businesses from their homes.
Paxton’s letter points out that in 2019, “the developer insisted extra state funding was needed to accommodate the growth of residents because the area had so little commercial tax revenue.” No wonder those commercial taxes are down.
A backyard AC recycling business? A backyard car repair business?Used car lot in the front yard? Or car rental agency?A Google search says these containers can hold chemicals, food and water.I am not sure what these held but the volume certainly goes beyond the needs of one family. Perhaps someone is smuggling in fresh water.
Next up: Will the Texas legislature take any meaningful action in its special session? Come back soon as the Austin action unfolds.
Posted by Bob Rehak on 10/19/23
2242 Days since Hurricane Harvey
The thoughts expressed in this post represent opinions on matters of public concern and safety. They are protected by the First Amendment of the US Constitution and the Anti-SLAPP Statute of the Great State of Texas.
https://i0.wp.com/reduceflooding.com/wp-content/uploads/2023/10/20231006-RJR_2514.jpg?fit=1100%2C733&ssl=17331100adminadmin2023-10-19 16:49:122023-10-19 23:05:15Paxton Letter Kicks Colony Ridge Concerns Up a Notch or Ten
At Mayor Pro Tem Dave Martin’s final town hall meeting last night, he and Chief Recovery Officer Stephen Costello gave an update on the status of new, higher capacity floodgates for the Lake Houston Dam. Their talks also addressed dredging and sand traps.
City of Houston Chief Recovery Office Stephen Costello (l) and Mayor Pro Tem Dave Martin at Martin’s final town hall meeting on 10/17/2023. Term limits bar Martin from running again for Council, though he is running for City Controller.
According to the latest estimate, construction of the gates now looks like it could begin in mid-2026, barring unforeseen setbacks.
The City has scheduled more dredging for the San Jacinto West Fork south of where the mouth bar used to be. Also, Costello says the City has completed opening up ditches and tributaries north of the railroad bridge and is now starting on those south of it.
Finally, Costello revealed that Lake Houston has lost almost 20% of its capacity due to sedimentation. To receive future dredging grants, the City must take steps to reduce the rate of sediment inflow. Costello revealed plans for a pilot sand-trap project in a point bar outside the Hallett mine far upstream. He said that the mine had agreed to remove trapped sediment there for free. Otherwise, he did not explain why a possibly more effective location closer to the problem area was not chosen for the pilot project.
For more details on each, see below.
Gates Details/Timeline
The purpose of adding more floodgates to the Lake Houston Dam: to lower the lake faster in advance of a flood.
The City must now start to lower the lake so far in advance of a storm that storms can veer away before they arrive. This wastes water.
The existing gates have 1/15th of the release capacity of the gates on Lake Conroe. This makes a joint pre-release strategy virtually impossible in extreme storms.
After examining and discarding the notion of adding crest gates to the spillway portion of the dam, the City is now focusing on adding 11 tainter gates to the earthen portion of the dam (east of the existing gates).
Proposed location for 11 new tainter gates.
With Mayor Sylvester Turner’s help, the City secured enough funding for construction during the regular session of this year’s legislature.
Next steps include:
3/24 – New environmental and historic preservation assessments, Army Corps permitting
12/24 – Construction plans completed
1/25 – Bidding
6/25 – Award Contract
5/26 – Begin Construction
The success of this plan will require the election of a new Mayor and City Council Representative who are committed to the project. Early voting begins next week.
Dredging Volumes, Costs
Dredging at various locations around Lake Houston will likely be a continuous effort for years to come. Sedimentation has already reduced the capacity of Lake Houston an estimated 18%. The City estimates future yearly losses in the range of 360-460 acre feet per year.
Historic and projected capacity loss in Lake Houston due to sedimentation.
One acre roughly equals the size of a football field. So imagine 400 football fields covered with sludge a foot deep. Each year!
To keep this problem in check, the City is already looking at doing additional dredging on the East and West Forks. It and the Army Corps finished major projects in both areas less than four years ago.
East of Atascocita and south of the convergence of the East and West Forks, the City plans to spend another $34 million to remove almost 900,000 cubic yards of sediment.
To date, Costello estimates that dredging nearly 4 million cubic yards of material has cost $186 million.
Summary of dredging costs and volumes in Lake Houston since Harvey
The City hopes to recoup some of these costs by reselling sand that it recovers from “hilltops” in the lake. Costello showed the heat map below. Notice the heavy sediment concentrations in the lake’s headwaters. This is because sediment drops out of suspension where rivers slow down as they meet standing bodies of water.
In addition to reducing the volume of Lake Houston, the sediment also poses a flood threat. It reduces conveyance of the rivers and lake forcing water up and out. Sediment blockages, such as the mouth bar, can also form dams that back water up.
Costello also addressed the ongoing dredging of 17 canals around Lake Houston. He said the focus is now shifting to the southern part of the lake.
Sand Traps to Reduce Inflow
In addition to dredging sediment from the lake, Costello also emphasized the need to reduce sediment coming downstream via sand traps. This last effort may be a condition of future grants for dredging.
Costello described two pilot types of pilot projects that the City is working on with the SJRA and sand-mining industry. The first is “sand traps” dug in point bars outside sand mines. The second: in-channel traps.
The idea behind the traps: dig holes in the river or its sand bars where migrating sand can settle out of the flow before it reaches the lake.
The first project may be near the Hallett Mine on the West Fork. According to Costello, the mine has agreed to remove the sand for free, thus reducing long term maintenance costs.
During Q&A after Costello’s presentation, however, he admitted that the City has no plans to try to get sand mines to reduce illegal emissions. In one notable instance, the TCEQ documented 56 million gallons of sludge discharged into the West Fork by the LMI mine.
Controlling sediment is crucial in reducing flooding. Accumulated sediment reduces storage capacity and conveyance for stormwater. The smaller capacity means lakes and rivers will flood faster and higher.
For high res versions of all the slides shown in the Town Hall, see this PDF.
Posted by Bob Rehak on 10/17/23
2241 Days since Hurricane Harvey
https://i0.wp.com/reduceflooding.com/wp-content/uploads/2023/10/20230812-RJR_2234-copy.jpg?fit=1100%2C733&ssl=17331100adminadmin2023-10-18 06:47:582023-10-18 15:28:45Update on Floodgates, Dredging, Sand Traps from Martin, Costello
Below I’m reprinting verbatim a press release from FEMA dated 98/6/23. It’s about a new formula for disaster funding. And it creates “Disaster Resilience Zones” that will receive increased federal support. Caution: government euphemisms ahead, including:
“Underserved communities most at risk”
“Socioeconomic status”
“Social vulnerability”
“Social justice”
“Economic justice”
“Disadvantaged communities”
The press release does not mention “damage” or “threats to life” at all. See my editorial comment at the end of this post.
FEMA Press Release
WASHINGTON – Today, FEMA is announcing the initial designation of 483 census tracts that will be eligible for increased federal support to become more resilient to natural hazards and extreme weather worsened by the climate crisis. Congress directed FEMA to make these designations in the Community Disaster Resilience Zones Act of 2022 and implement this bipartisan legislation to help build resilience to natural hazards in communities most at-risk due to climate change.
Designated Disaster Resilience Zones in Houston Area
FEMA will use Community Disaster Resilience Zones designations to direct and manage financial and technical assistance for resilience projects. For example, for federal agencies, the legislation provides additional federal cost-share for projects in designated zones. The zone designations can also help the private sector, nonprofits, philanthropies, and other non-federal partners target investments in community resilience.
The act aims to increase resilience efforts and preventative measures designed to address underserved communities most at risk to natural hazards. Consistent with legislative direction, FEMA considered natural hazard risk from a national and state level while accounting for factors that reflect disaster impacts felt by coastal, inland, urban, suburban and rural communities. FEMA also ensured that each state has at least one Community Disaster Resilience Zone in these initial designations.
“These designations will help ensure that the most at-risk communities are able to build resilience against natural hazards and extreme weather events, which are becoming increasingly intense and frequent due to climate change,” said FEMA Administrator Deanne Criswell. “This aligns with Congress’ direction and other FEMA initiatives to get federal support and resources to the communities that need them most.”
This initial set of designations covers all 50 states and the District of Columbia. These designations can be explored on an interactive map on FEMA’s website. Additional information on the designation methodology and criteria is available. More Community Disaster Resilience Zone designations, including tribal lands and territories, are expected to be announced in the fall of 2023.
An additional designation of zones will occur in 12-18 months based on updates to the National Risk Index, lessons learned from these initial designations, and stakeholder input. Examples of planned updates to the National Risk Index include additional data on tsunami and riverine flood risk.
Designated zones will have prioritized access to federal funding for resilience and mitigation projects. For example, this fall, the National Oceanic and Atmospheric Administration (NOAA) will make awards for the Climate-Smart Communities Initiative program funded by the Inflation Reduction Act to accelerate the pace and reduce the cost of climate resilience-building for communities across the United States. NOAA will work with communities to co-develop equitable climate resilience plans that can be readied for funding and implementation. The priority is to assist communities that are at the highest risk to climate impacts and have the most need for assistance, such as the FEMA-identified Community Disaster Resilience Zones.
The vision for the Community Disaster Resilience Zone Act, passed with bipartisan support in December 2022, is to leverage collaboration and cross-sector coordination across all levels of government, philanthropic foundations, private non-profits, universities, the insurance industry and private businesses.
FEMA will continue to engage the public as it refines the natural hazard risk assessment methodology to designate the zones, consults with local jurisdictions and implements post-designation support from a range of public and private resources.
Editorial Comment
Notice that the press release doesn’t mention damage at all. This appears to be much like Harris County’s Equity Prioritization Framework. We saw last weekend how that distorted the distribution of flood-mitigation funds. Let’s hope that by creating “resilience zones,” we don’t also deprive other areas of the help they desperately need.
At US59, Harvey reached more than 20 feet above flood stage, the deepest in Harris County.Almost a quarter of all the flood fatalities in the county happened near here.
Posted by Bob Rehak on 10/17/23
2240 Days since Hurricane Harvey
https://i0.wp.com/reduceflooding.com/wp-content/uploads/2023/10/Screenshot-2023-10-17-at-10.15.55%E2%80%AFAM-e1697560136356.png?fit=1200%2C639&ssl=16391200adminadmin2023-10-17 12:30:382023-10-17 13:03:05FEMA Adopts New Formula for Disaster Funding
The National Weather Service (NWS) has launched a nationwide rollout of “experimental” flood forecasting maps. The maps show when, where and how much floodwaters will impact specific areas up to five days in advance.
NWS’s new experimental flood inundation maps help communicate the timing and magnitude of high water events by showing modeled inundated areas in blue overlay. Emergency managers may use these services to preposition resources, secure critical infrastructure and recommend evacuations and evacuation routes.
System Already Rolled Out to Houston Area
NWS has already rolled out the system for Houston and East Texas with other parts of the county to follow.
The new system should enable emergency managers to see how predicted rainfall could impact structures, communities and people.
Until now, the best NWS could do was issue a flood watch or warning for communities. But the new maps will show how far floodwaters could spread in a community. That will help people better prepare for floods and evacuate from them. For instance, it will reportedly show when roads will be cut off by rising waters.
However, the new maps can’t yet forecast urban flash flooding related to lack of storm sewer capacity.
Near Real-Time View for Emergency Managers
NWS announced the new experimental flood maps on September 26, 2023. “These new services complement and support the issuance of flood watches and warnings by providing near-real-time, high-resolution, street-level visualizations showing where, when, and how much flood waters are forecast.”
The descriptions conjure up images of floodplain maps. But they show expected flooding from approaching storms – not just the extent of flooding in a hypothetical 100-year event.
David Vallee, director, Service Innovation and Partnership Division, NOAA’s National Water Center said, “These services will dramatically improve our ability to provide impact-based decision support services to our partners so they can preposition people and resources ahead of flood events.”
Three New Tools
Three new near-real-time services will help improve flood impact information. They include:
Hourly Analysis will model flood inundation extent based on streamflow analysis.
Posted by Bob Rehak on 10/16/23 based on information from NWS
2239 Days since Hurricane Harvey
https://i0.wp.com/reduceflooding.com/wp-content/uploads/2023/10/Screenshot-2023-10-16-at-1.34.08%E2%80%AFPM-e1697481825151.png?fit=1100%2C614&ssl=16141100adminadmin2023-10-16 13:46:262023-10-16 17:26:46National Weather Service Rolling Out New Flood Warning Maps
10/15/23 – Third quarter flood-mitigation spending data is now available for Harris County Flood Control District and its partners. In some ways, the data shows a continuation of previous trends. But the data also contained some surprises. The major findings:
Spending continued to dip. Slower project delivery means inflation will claim an increasingly large percentage of taxpayer dollars and may force cancellation of some bond projects.
If the last quarter of this year is anything like the first three, we could see less than half the activity in 2023 than we saw in 2020.
The trend toward investing more heavily in minority areas continued and even accelerated. But there was one notable exception – Cypress Creek and its tributaries.
An unusual $9.7 million real-estate transaction for a stormwater detention basin near the Mercer Arboretum skewed the Cypress Creek total. That was 16.5% of all HCFCD spending for the quarter.
Without it, many of the numbers below would also have been skewed. For instance, total spending and average spending per watershed would vary dramatically.
The focus on so-called “equity” spending and the Cypress Creek watershed meant 15 watersheds saw less than a million dollars in activity during the quarter. And five of those received less than $100,000.
Let’s look at each and the implications. Everything below INCLUDES the unusual real estate transaction near Mercer. In several places, I note how things would have changed without Mercer.
Overall, Slowdown Magnifies Inflation Concerns
Overall, flood-mitigation spending dipped about 5% in the third quarter compared to the previous quarter. It declined by a little more than $3 million to $58.8 million. That may not sound like much, but it continues a 3-year downward trend and creates delays that expose residents to more flood risk.
As projects are delayed, their costs also escalate due to inflation, raising concerns about whether there will be enough money in the bond to finish all the projects promised to voters.
Spending this year will likely be a hundred million dollars less than the first full year of the 2018 flood bond – when projects were ramping up. See chart below.
Annualized estimate for 2023. 23Q4 data estimated based on average of first 3 quarters.Without Mercer, the 2023 estimate would be below $200 million.
Moreover, spending will be $200 million less than the peak year of 2020 – about half of what it was then.
Halfway through the 2018 10-year flood bond, HCFCD has spent only about a third of the funds approved by voters – $1.65 billion. However, if the present slowdown continues, this will be the third straight year of decline.
The slowdown in project delivery means inflation will increasingly raise costs and undermine the purchasing power of the dollars authorized by voters.
HCFCD acknowledges the serious impact of inflation in its latest bond update to Commissioners Court, and hopes toll-road money remaining in the Flood Resilience Trust will cover any shortfall.
Average Spending in LMI Areas Growing
Data also reveals that with one exception (Cypress Creek and its tributaries), the trend of preferentially allocating funds to Low-to-Moderate-Income (LMI) areas continued and even accelerated when measured by average spending per watershed.
On average during Q3, watersheds with a majority of LMI residents (hereinafter called “LMI watersheds”) received 2.5X more funding than more affluent watersheds – $3.1 million each vs. $1.2 million. That’s up from 1.7X over the longer period since Harvey. So, the gap is widening.
Without the Mercer real-estate transaction, the average for more affluent watersheds would have been cut in half to $600,000. That would have almost doubled the ratio. The recomputed average would created a 4.7X ratio between LMI and all other watersheds for the third quarter.
That trend will likely continue for some time as projects funded by HUD through the Texas General Land Office get approved and start construction. That pot of money will spread across the income spectrum, but projects in lower income areas will likely start first.
Cypress Creek Spending Explodes
In fifteen Harris County watersheds, more than 50% of residents make above the average income for the region.
As a group, those 15 received $18.6 million last quarter – $2 million more than the $16.6 million received by the eight LMI watersheds.
However, the first group is twice the size of the second. And looking deeper within the more affluent watersheds, we can see that Cypress Creek and its tributaries (Willow and Little Cypress) received 79% of that $18.6 million last quarter.
The three Cypress watersheds received almost 4X more funding than the 12 other watersheds in the more affluent category put together.
Cypress Creek and its tributaries consumed 79% of all HCFCD/Partner spending last quarter among watersheds without a majority of LMI residents.
Here’s how that same spending looks in a bar graph.
Only the first three watersheds on the left received more than a million dollars in Q3.The twelve on right received less than $1 millioneach.
The 12 other watersheds divvied up $3.8 million; they averaged just $348 thousand each.
FOIA request. Data supplied by HCFCD.
$348,000 is one ninth of the $3.1 million average for LMI watersheds. And we know that some of those, such as the San Jacinto, have huge, unmet needs.
Cypress Knocks Brays Out of First Place
Now, let’s look at ALL watersheds in both categories. When looking only at the third quarter, Cypress Creek surged into first place. It nudged out Greens, White Oak, Brays and Sims, all of which have LMI populations greater than 50%.
Includes all 23 watersheds during 23Q3.
HCFCD finished Project Brays 15 months ago, but still managed to spend $3.8 million there last quarter. That was almost 10X more than it spent during the third quarter in the San Jacinto watershed, the county’s largest, and where the flooding was deepest. HCFCD spent only $400 thousand in the entire San Jacinto watershed last quarter.
Comparison of 33 gages in Harris County during Harvey showed San Jacinto had worst flooding.
Brays Still Ranks #1 in Total Spending Since Harvey
Since Hurricane Harvey (not just last quarter), Brays still ranks #1. But Cypress now ranks second. If you added its Little Cypress and Willow Creek tributaries in the graph below to the Cypress Creek total, they would rank #1 by more than a $100 million.
Includes all 23 watersheds since Harvey
Brays even managed to increase in the last quarter by $1.5 million while the San Jacinto decreased by $55,000.
Granted, some watersheds have smaller needs than others, but the ratio between the highest and lowest spending exceeds 300X.
Impact of Equity Formula
The spending priorities shown in this post reflect the Equity formula adopted and periodically revised by Harris County Commissioners Court.
Ironically, the language approved by voters in the flood bond never mentions the word “equity.” Paragraph 14G does say that Commissioners Court shall provide for an “equitable expenditure of funds.”
The theory is that poor people are financially less able to fix their homes after a flood. I accept that.
But some commissioners are using that to push the idea of fixing 500-year flooding in poor neighborhoods before fixing 2-year flooding in more affluent communities.
Therefore, I ask:
At what point do we do we say enough money has gone into an LMI watershed and start spending elsewhere to reduce greater flood risk?
Why isn’t HCFCD publishing updated flood risk maps as it completes mitigation projects so we can make objective comparisons and see what our tax dollars bought?
Why does Harris County’s formula for allocating flood-mitigation funds NOT consider:
Flood damage to homes, businesses and retirement communities?
Damage to infrastructure, such as bridges, schools, hospitals, grocery stores, traffic arteries, water and sewage treatment plants, etc.?
Height of floodwaters, i.e., the severity of flooding?
Deaths caused by floods?
Is a poor person’s carpet worth more than a rich person’s life?
Will there be enough money in the flood bond and flood resilience trust to finish all projects in the bond given inflation?
Only 20% of Americans now say they trust government “just about always or most of the time.” That’s something to think about as we near the next election.
Posted by Bob Rehak on 10/15/23and updated 10/16/23 with additional info on Cypress Creek
2238 days since Hurricane Harvey
The thoughts expressed in this post represent opinions on matters of public concern and safety. They are protected by the First Amendment of the US Constitution and the Anti-SLAPP Statute of the Great State of Texas.
On Friday, 10/13/2023, Bayou Land Conservancy (BLC) staff and board members met with supporters and legislators for a ribbon-cutting ceremony at BLC’s new Arrowwood Preserve on Spring Creek in Tomball west of 249.
BLC’s Arrowwood Preserve is in the floodplain of Spring Creek just north of Lone Star College – Tomball.
Land Donated by Two Sand Miners in 2020
The occasion: dedication of a new outdoor classroom for environmental education. Years of work that began with the donation of 117 acres to the Bayou Land Conservancy in 2020 culminated yesterday. Two sand miners, Don Poarch and Joe Swinbank, owners of Sprint Sand & Clay, donated the ecologically diverse land across Spring Creek from Lone Star College-Tomball.
The preserve takes its name, Arrowwood, from a 6-8 foot shrub that’s a member of the Honeysuckle family. The preserve marks the western extent of the plant’s natural range.
Since acquisition of the land, BLC staff, volunteers and supporters have developed a management plan, blazed trails, erected boardwalks, and built the new outdoor classroom.
BLC developed the open-air classroom in partnership with William & Madeleine Welder Smith Foundation; The Ralph H. and Ruth J. McCullough Foundation; and Plains All-American Pipeline Company.
An Ecological Gem Now an Outdoor College
The photos below show some of the quiet, natural beauty of the Arrowwood Preserve.
Arrowwood is 117 acres of wetlands also populated by hardwoodsand some pines.
Spring Creek cuts through the Arrowwood Preserve.View looking south from above the new outdoor classroom.Looking East. The preserve extends to SH249, left to right in the middle. Jill Boullion, Executive Director of the BLC, cuts the ribbon to honor years of hard work by staff, board members and supporters.New outdoor classroom in background.After the ribbon cutting, attendees explored the beauty of wilderness in the city.
The land will connect to the Spring Creek Greenway which extends all the way southeast to US59.
Value of Nature in Flood Mitigation
It’s hard to put an exact dollar figure on the value of such a preserve. Traditional benefit/cost ratios used in flood-mitigation projects quantify the benefits of massive engineering/construction projects against the cost of avoided damages.
But this land is still natural. So damage to structures is not a consideration. The value of damages avoided would depend on how many people with bad judgement might choose to build on land that goes deep under water during frequent floods. At 249, Spring Creek floodwaters rose 11.4 feet above flood stage during Harvey. That equals 27.5 feet above the normal elevation!
Need for New Formula to Weigh Prevention Against Correction
But there’s another way to look at this: the value of prevention compared to the cost of correction. Our parents all taught us that an ounce of prevention is worth a pound of cure.
The current mapped floodplains around and in Arrowwood look like this.
From FEMA’s National Flood Hazard Layer Viewer.Striped area = floodway of Spring Creek. Aqua = 1% annual chance of flooding. Tan = .02% annual chance.
Keep in mind that the map above was drawn in 2014 – before Harvey. FEMA has not yet released new post-Harvey flood maps. The floodplains will reportedly expand by 50% to 100%.
So, protecting this land from development will save money several ways. It will eliminate or reduce the:
Injuries and lives lost.
Cost of flood repairs.
Disruption to people’s lives after a flood.
Wasted construction dollars in unsafe areas that could have built safe homes on higher ground.
Buyouts after repetitive flooding.
Loss of home values.
Lawsuits.
Urban decay.
Taxpayer subsidies for the National Flood Insurance Program.
Cost of engineering and environmental studies designed to determine how to fix the problems.
Construction costs to build flood-mitigation measures, such as stormwater detention basins and channel widening
The need for expensive bulkheads and dikes to control river migration.
Higher tax rates to pay for many of the costs above.
Then, balance all those uncertainties and negatives against the positives of preservation.
Forests also slow down floodwaters by creating friction. This reduces severity of damage and gives people downstream more time to evacuate if necessary.
Clearly, determining the value of preservation demands a different kind of formula that considers different costs and different benefits.
Perhaps the next generation of future homeowners and leaders from Lone Star College will learn such things at BLC’s new outdoor classroom on Spring Creek and change the world for the better. I hope so.
Support Bayou Land Conservancy
This is an area that should stay natural forever. And with the help of the Bayou Land Conservancy, it will. BLC is an organization making a huge difference in a quiet way. It deserves the support of each and every one of us.
Posted by Bob Rehak on 10/14/23
2237 Days since Hurricane Harvey
https://i0.wp.com/reduceflooding.com/wp-content/uploads/2023/10/20231013-RJR_2846.jpg?fit=1100%2C733&ssl=17331100adminadmin2023-10-14 04:56:122023-10-14 11:46:10Bayou Land Conservancy Ribbon Cutting on Spring Creek
City of Houston Mayor Pro Tem Dave Martin will hold a farewell town hall meeting for District E residents.
Date: Tuesday, October 17th, 2023
Time: 6:30 p.m.
At: Kingwood Community Center
Address: 4102 Rustic Woods Dr. Kingwood, TX 77345
The Houston Police Department (HPD) Kingwood Division will start the program with a brief demonstration of new virtual reality training software, purchased with District E Service Funds. The Police will also provide a brief summary of local crime statistics. Later, HPD Lake Patrol will provide safety tips for Lake Houston.
Other Speakers
Recovery Efforts
Stephen Costello, Chief Resiliency Officer for the City of Houston, will give a comprehensive overview of the recovery efforts undertaken after Hurricane Harvey. This will include updates on the Lake Houston Dam Spillway Improvement Project (floodgates), dredging operations, and the desilting of bridges.
Solid Waste/Recycling
Mark Wilfalk, Director of the Solid Waste Department, will address any concerns regarding trash and recycling collections.
Northpark Overpass Project
Jeff Nielsen, President of the Lake Houston Redevelopment Board/TIRZ 10 board, will share information on the Northpark Drive Overpass Project, and various TIRZ 10 projects.
Dave Martin on His Years of Service
Mayor Pro Tem Dave Martin will provide a wrap up of his years of service and commitment to the residents of District E.
Information Tables for Early Arrivals
There will also be information tables hosted by City of Houston Departments, available for those who arrive early, beginning at 5:30 p.m.
For More Information
For more information, please contact Mayor Pro Tem Martin’s office at (832) 393-3008 or via email at districte@houstontx.gov.
Posted by Bob Rehak on 10/13/23
2236 Days since Hurricane Harvey
https://i0.wp.com/reduceflooding.com/wp-content/uploads/2023/10/2023-TOWN-HALL-_7_.png?fit=1200%2C1200&ssl=112001200adminadmin2023-10-13 06:24:332023-10-13 06:27:21Save the Date: Dave Martin’s Farewell Town Hall Meeting Next Tuesday
October 12, 2023 – This morning, contractors transplanted the first tree in the Northpark Drive expansion project. The Lake Houston Redevelopment Authority has budgeted $700,000 for the transplantation project in response to public concerns about saving as many trees as possible.
Plan for Tree Transplantation
Trees from the Northpark entry areas at US59 will be transplanted to the perimeters to make room for stormwater retention basins totaling 22 acre feet. Additional trees in the way of utility work farther east on Northpark will also be transplanted to the entries.
Houston Mayor Pro Tem Dave Martin attended the press event this morning and emphasized that the transplantation effort was the fulfillment of a commitment made to the public. Here is a summary of the final transplantation plans.
Why Northpark Must Be Widened
The widening of Northpark, including a bridge over the UnionPacific Railroad tracks, will create an all-weather evacuation route for more than 70,000 people in case of a natural disaster, such as Hurricane Harvey. Engineers need the retention-basin capacity to control runoff from the additional lanes of traffic near the entry at US59.
The ponds will do double duty as decorative lakes that welcome residents and visitors in normal times. And the transplanted trees will form a ring of green behind the entry ponds.
How They Will Transplant Giant Trees Weighing Tons
It’s not everyday that you get to see such massive machinery at work. The tree moved this morning was estimated at 15-20 feet tall. With its root ball, the tree weighed thousands of pounds.
The truck used for moving the trees has massive blades that circle a tree and scoop it out of the ground. It then moves the tree and its intact root ball to a new location where a matching hole has been pre-scooped. The pictures below show the tree being lowered into the hole, and then the blades being lifted out and retracted.
Houston Mayor Pro Tem Dave Martin (left) supervises transplantation of first tree as it moves toward its new home.Truck moves into position near the pre-dug hole adjacent to Northpark Drive (upper left).Truck lowers stabilizing legs and begins to lower tree into hole.Almost there!Tree nestles into place. Driver begins to retract blades.Driver lifts blades and retracts them so they no longer encircle tree.Driver begins closing the blade assembly so he can move away and begin work on the next tree.Looking SW across Northpark. All of the trees you see in the old entry will be transplanted in a similar fashion.Looking NE toward utility work now under way along the north side of Northpark. Trees from both sides of road will eventually be moved to make way for upgraded utilities, a bridge, and improved drainage.
Your kids or grandkids may find this process fascinating. So please share this post with them.
Change is always difficult. But it’s important to remember that human lives will someday depend on this project and that efforts are being made to protect the lives of as many trees as possible.
For More Information
For previous posts about Northpark construction, see the following:
Also visit the Lake Houston Redevelopment Authority/TIRZ 10 Project pages at https://lakehoustonra.com.
Posted by Bob Rehak on 10/12/23
2235 Days since Hurricane Harvey
https://i0.wp.com/reduceflooding.com/wp-content/uploads/2023/10/20231012-DJI_0595.jpg?fit=1100%2C733&ssl=17331100adminadmin2023-10-12 11:17:472023-10-12 14:04:19First Tree Transplanted in Northpark Expansion Project
As the state legislature takes up what to do about Colony Ridge, Harris County Commissioner Tom Ramsey, PE, brought the issue up in the 10/10/23 session of Commissioners Court.
Screen capture of Ramsey starting discussion.
Ramsey Leads Off Discussion with Photos of Dramatic Erosion, Impacts
Costs of building a new purification plant to remove sediment and pollution from the water.
Ramsey also reminded everyone that Lake Houston supplies drinking water to roughly 2.2 million people, about half the population of Harris County.
Next, Ramsey introduced a motion to determine how much a study would cost to learn how Colony Ridge drainage has impacted Harris County. Ramsey, an engineer by trade, limited his remarks to drainage and infrastructure issues, even though the state legislature is examining a much broader range of issues.
Ramsey asked Harris County Flood Control District (HCFCD) to come back to the next Commissioners Court meeting with an outline and cost for a study that would determine the downstream impacts from Colony Ridge.
Dr. Tina Petersen, HCFCD executive director, said they hadn’t studied Colony Ridge but would do everything she could to come back to the next Commissioners Court meeting with a proposal for a study.
Then the scope of the task started expanding. Other commissioners, including Rodney Ellis, pointed out that Liberty County wasn’t the only upstream county impacting Harris County.
Commissioner Adrian Garcia asked whether Director Petersen could expand the scope to consider impacts from other counties. But Petersen said that would be impossible by the next meeting.
Because other upstream areas have similar issues, commissioners felt a regional approach might make more sense and funding might be available from the Texas Water Development Board to study the problem.
So, Commissioner Ellis suggested having Intergovernmental Affairs look into what other counties, including Liberty, are doing.
Judge Hidalgo called the other Colony Ridge issues being investigated by the legislature and Attorney General Ken Paxton “conspiracy theories.”
No Action Taken in Meeting, but Unanimous Agreement to Revisit Issue
In the end, the Commissioners voted to take “no action” on Ramsey’s motion in yesterday’s meeting. However, they also agreed to reconsider it at a future date when Commissioners have more information about the scope and costs of a study.
In the meantime, I’m not sure how much cooperation Harris County will get from upstream counties. In my opinion, other counties sometimes see lax enforcement of regulations as tools to attract development.
See the entire discussion. It lasted about 18.5 minutes from 5:04:25 to 5:23, and ended with unanimous agreement to revisit the issue at an unspecified future date.
If nothing else, this raises the profile of Colony Ridge issues in the state legislature. The bi-partisan nature of the meeting’s outcome and the focus on infrastructure issues may make Colony Ridge’s charges of racism much more difficult for the legislature to ignore.
Posted by Bob Rehak on 10/11/2023
2234 Days since Hurricane Harvey
The thoughts expressed in this post represent opinions on matters of public concern and safety. They are protected by the First Amendment of the US Constitution and the Anti-SLAPP Statute of the Great State of Texas.
https://i0.wp.com/reduceflooding.com/wp-content/uploads/2023/10/Screenshot-2023-10-11-at-6.17.27%E2%80%AFPM.png?fit=1556%2C856&ssl=18561556adminadmin2023-10-11 18:49:142023-10-11 19:02:18Commissioners Discuss Colony Ridge, But Take No Position Yet