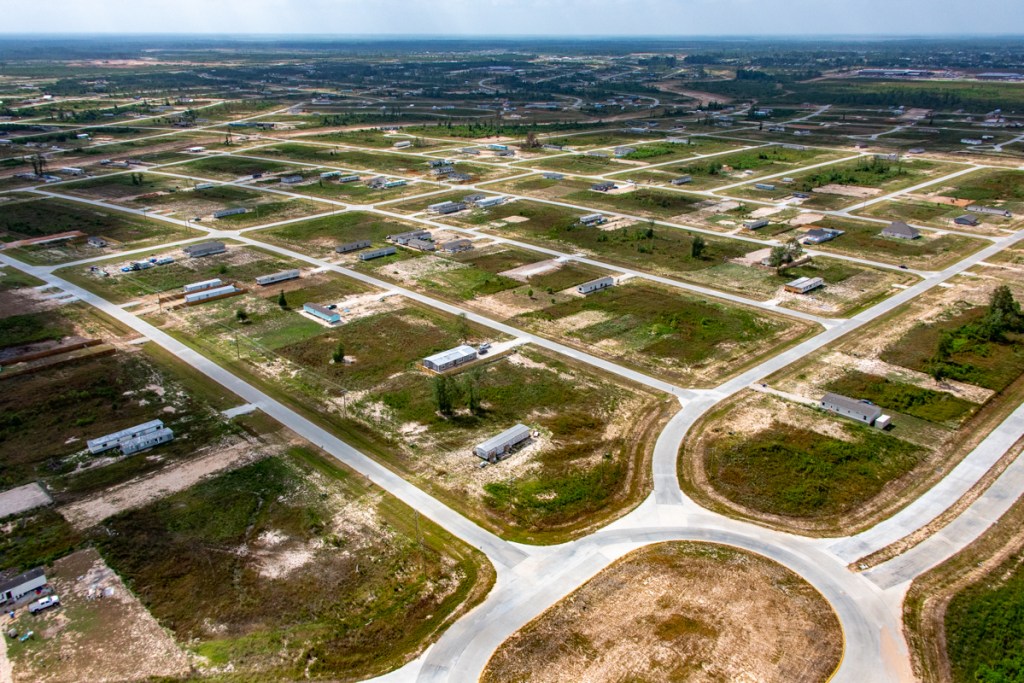
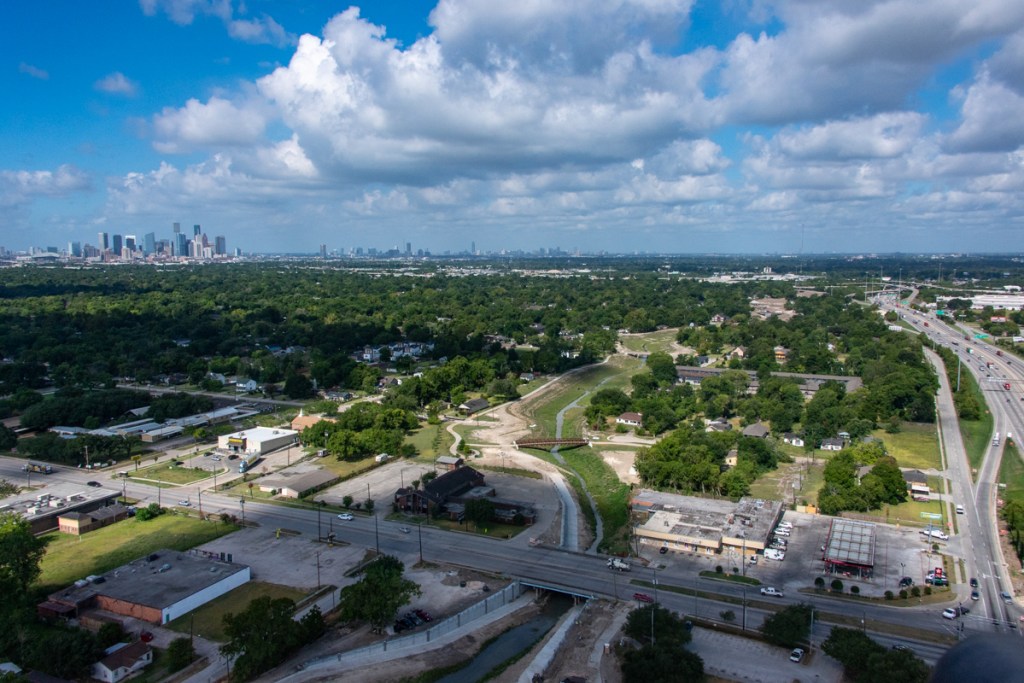
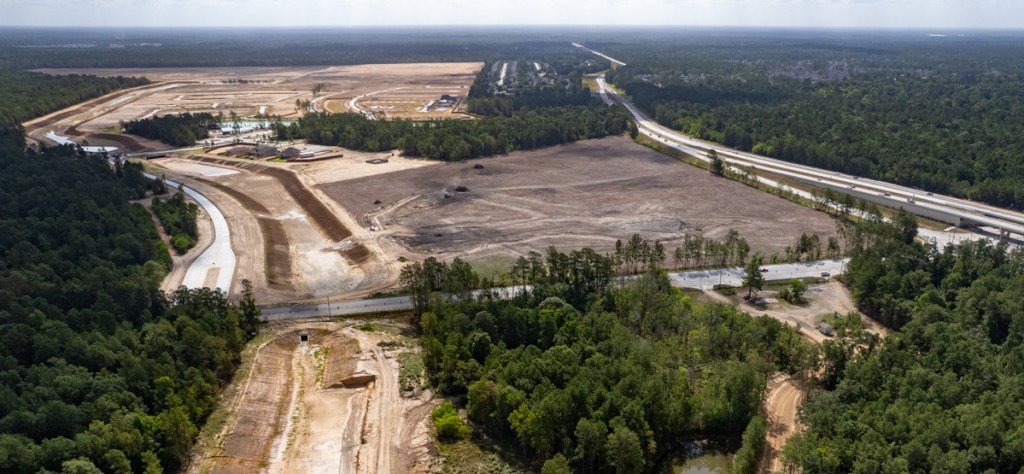
The Colony Ridge development in Liberty County, aka the world’s largest trailer park, has more than doubled in size in the last 3 years. Measurements in Google Earth show that Colony Ridge, which started clearing land in 2012, has expanded from approximately 8,000 acres in 2019 to almost 20,000 acres today. To put that in perspective, Kingwood comprises approximately 14,000 acres and took more than 40 years to build out.
Colony Ridge started developing on the left (west). It is expanding eastand north.
Growing Pains
But the rapid growth of Colony Ridge has not come without pain:
Rivers of mud continue to flow out of drainage ditches with big rains because the developer flaunted construction regulations for them.
Consequences of Poor Construction Practices
As a result of such drainage issues and exposed soils, more sediment flows downstream than otherwise would. This contributed to sediment buildups on the San Jacinto East Fork (see below). Those, in turn, reduce conveyance and contribute to downstream flooding – unless the public continues to spend millions on dredging.
East Fork Mouth Bar after Imelda but before recent dredging. Average river depth had been reduced to three feet.
Still Not Following Best Practices
Aerial photos taken on 7/22/2022 with Ken Williams and Bill Callegari, two fellow members of the Harris County Community Flood Resilience Task Force, show the current state of the development and construction practices in Colony Ridge. Sadly, not much has improved. For instance, the developer still piles dirt on the edge of ditches without protecting them with silt fences.
Note long drainage ditch cutting diagonally through middle of frame. Developer has piled dirt next to it (middle left of frame) without protecting ditch with silt fencing.Major ditch cutting through older section is sill not protected with back-slope interceptor swales or vegetation.Erosion is rampant.
Water shooting down the ditch above created a major headache during Harvey. See below.
FM 1010 Still Washed Out
Floodwater from the ditch washed out FM 1010. This major N/S thoroughfare still needs repair…five years later!
Break in FM 1010, aka Plum Grove Roadforces residents to detour for miles.
Photos Showing New Development
Area developed last year is starting to fill in with new trailer homes already.Note absence of fire hydrants…still.Looking east at area still under construction.Looking E from NE corner of development.Another area semi-cleared but still unpaved.
If there’s good news in these photos, it is that the developer appears to be leaving more natural ground cover in the newest areas. Still, without vegetation on the sides of ditches, without better construction practices, excess sediment could continue washing into the Lake Houston Area for years to come.
Downstream residents will continue to pay the price for egregious development practices upstream.
Someday, the people who buy these lots will also become flood victims of similar new developments even farther upstream.
Will we continue to repeat mistakes of the past in ever widening circles? Will we continue to sow the seeds of future flooding? Or will we wake up to the fact that we are all part of one giant community?
Posted by Bob Rehak on 7/23/2022
1792 Days since Hurricane Harvey
The thoughts expressed in this post represent opinions on matters of public concern and safety. They are protected by the First Amendment of the US Constitution and the Anti-SLAPP Statute of the Great State of Texas.
https://i0.wp.com/reduceflooding.com/wp-content/uploads/2022/07/20220726-Screen-Shot-2022-07-26-at-10.27.55-AM-2.jpg?fit=1200%2C854&ssl=18541200adminadmin2022-07-26 15:04:302022-08-29 15:09:39Controversial Colony Ridge Development Doubles in Size
Two new subdivisions are now routing their drainage through or toward San Jacinto West Fork sand mines.
The one already going through a mine is Artavia on the north/east side of the Westfork between FM 1314 and river.
The other is near Woodson’s Reserve on the south/west side of the river just inside the Grand Parkway (SH99). Their ditch currently stops just feet short of another sand mine.
Routing drainage through sand mines raises concerns about the potential for increasing sediment in the West Fork. Increased sediment can reduce conveyance and contribute to flooding.
Accident Waiting to Happen?
During a flyover of the West Fork on Friday 7/22/2022 with Ken Williams and Bill Callegari, two fellow members of the Harris County Community Resilience Flood Task Force, I photographed both drainage issues from the air. They gave me a queasy, “accident-waiting-to-happen” feeling.
So, I reached out to Texas A&M, the TCEQ, the Montgomery County Engineer’s office and two hydrologists to ask about about safety. I could not reach anyone at A&M, TCEQ, or the MoCo Engineer’s office. But this is vacation time.
However, the two hydrologists did express concerns. See them below the pictures.
Wide shot looking SW. Artavia Drainage Ditch heading toward LMI Moorehead mine. West Fork is at far edge of mine in trees.Water from ditch goes into one pond and makes a right turn into another, then……spills out into the West Fork via a pipe or overflow swale.West Fork in foreground runs toward the right and Humble/Kingwood Area.
Second Development’s Drainage
On the opposite side of the West Fork, upstream just south of the Grand Parkway, another new development is expanding near Woodson’s Reserve.
Red dot represents location of helicopter when taking the two shots immediately below.Part of expansionA small part of the clearing. Note drainage ditch on right (not fully completed).Close up of the far end of the shot above.Looking east. West Fork is in trees on far side of mine.
The developer could make the ditch go around the mine. But around would be an expensive proposition. Right now, the ditch ends a half mile from the river.
Going around would add another 2 miles. Plus, to reach the river, the ditch would have to make a sharp U-turn and cut across a series of properties owned by other entities. So, I’m fairly confident that’s NOT the plan.
Looking north across mine. Red X marks current end of ditch. West Fork is on right.
This mine stretches two miles north to south and a half mile east to west.
Concerns of Hydrologists
The two hydrologists who returned my calls both spoke on condition of anonymity. They expressed concerns about the potential for sedimentation and erosion created by routing subdivision drainage through sand mines.
The first acknowledged that the practice might have benefits during small rains. Sediment transported down ditches could get a chance to drop out of suspension before it reaches the river. And the ponds might provide some small floodwater retention benefit, too.
However, he also felt that in large floods the higher volume and speed of the water could churn up sediment in the pond and flush it downstream.
The second hydrologist worried about pressure on the mines’ dikes. He cited the potential for breaches and the risk of sediment escaping into the West Fork and onto neighboring properties.
He also worried about erosion of the loose, sandy soils. Already, he said, you can see significant erosion where they are trying to shore up roadways. He remembered the 56 million gallon spill from the LMI Moorehead mine that turned the West Fork white with sludge. He also remembered how LMI tried to blame it on Artavia at the time.
Confluence of Spring Creek and West Fork. TCEQ alleged that Liberty Mines discharged 56 million gallons of white waste water into the West Fork.Liberty blamed Artavia for flooding the mine. Photo taken 11/04/2019.
I couldn’t find any academic papers written about routing subdivision drainage through mines. Montgomery County may be breaking new ground, so to speak.
Posted by Bob Rehak on 7/25/22
1791 Days since Hurricane Harvey
The thoughts expressed in this post represent opinions on matters of public concern and safety. They are protected by the First Amendment of the US Constitution and the Anti-SLAPP Statute of the Great State of Texas.
https://i0.wp.com/reduceflooding.com/wp-content/uploads/2022/07/20220722-RJR_0283.jpg?fit=1200%2C800&ssl=18001200adminadmin2022-07-25 19:12:032022-07-26 07:25:30New Subdivisions Now Routing Drainage Through, Toward West Fork Sand Mines
A popular misperception says Halls Bayou has received no flood-mitigation funding. Yet it has received $175 million since 2000. $65 million of that happened since Harvey.
Channel widening, stormwater-detention basins and neighborhood drainage improvements have reduced flood risk somewhat, but several factors – including the need for more funding – make mitigation difficult. HCFCD has many projects still seeking federal assistance.
The Bond Program approved by voters in 2018 includes more than $110 million for the Halls Bayou watershed. That money could help attract another $236 million in federal matching grants for a total of $346 million. But many projects have yet to receive grants and start construction.
Halls cuts diagonally across the northern part of Harris County between Beltway 8 and Loop 610 North. It joins Greens Bayou before the Ship Channel.
From HCFCD.org on 7/24/2022.Halls, a tributary of Greens Bayou, is the darker shaded area.
Background: Halls Ahead
Halls received an extraordinary amount of damage during Tropical Storm Allison in 2001. Among all 23 Harris County watersheds, it ranked second only behind Greens Bayou during that storm. But Greens has four times the area and three times the population. (Greens had 15,590 damaged structures; Halls had 12,820.)
As a result, HCFCD launched many studies of Halls drainage after Allison. They culminated in the 2013 Halls Ahead Plan. But HCFCD lacked money to fully implement it and still does. All unfunded Halls Ahead projects carried forward into the 2018 Bond Program and many were able to start as you will see in the pictures below. Several have even finished. However…
A Phasing Study designated 58 flood risk reduction projects in 12 phases, with estimated costs between $100 million and $150 million per phase.
Flood Control executives recently traveled to Washington to plead for more help from the Army Corps of Engineers. The Corps now has a pilot program to help economically disadvantaged areas and Halls certainly qualifies. Halls has the highest percentage of vulnerable, Low-to-Moderate Income (LMI) residents of any watershed in Harris County (71%).
Complicating Factors
Blocked roadside ditches trap floodwater in neighborhoods. City of Houston and Harris County Precincts are responsible for roadside ditches, not HCFCD.
Halls is plagued by a combination of factors that make flood mitigation difficult:
Silted-in roadside ditches
Aging stormwater infrastructure
Developments built to older standards
Homes frequently built at street level
Dense population that leaves little room for mitigation projects
Structures built in floodplains that have to be bought out before many mitigation can begin (see below).
Flood History in Halls Watershed
Much of the Halls Bayou watershed developed during or after the 1950s. Take this area immediately east of what became I-45. It was farmland before then.
Google Earth image from 1953.Same area in 1978.Floodplains today. Cross hatched = Floodway. Aqua = 100-year floodplain. Brown = 500-year.Based on data developed after Allison. Floodplains will expand even farther after new updates.
Homes and businesses built in Halls Bayou floodplains created the flood risk. They also make widening channels or building detention basins difficult because of time-consuming, expensive buyouts.
Vital Stats
These statistics help put Halls Bayou flood problems in perspective. Here’s how Halls ranks among 23 Harris County watersheds on:
Watershed size – #16 (42.3 square miles)
Population – #10 (152,358 in 2020 census, down 5% from 2010)
Population density – #6 (3,602 people/square mile)
Dollars per capitain flood mitigation spending – #5 ($1151 per resident)
Dollars per square mile – #4 ($3.9 million dollars per square mile between 2000 and the end of last year).
Damaged structures – #4 (25,691 structures during five major storms since 2000 [Allison, Tax Day, Memorial Day, Harvey and Imelda])
Damage per square mile – #1 (607.4 structures/sq. mi.)
That last point makes recovery difficult for communities, especially less affluent ones. It may help explain the decrease in population.
Allison, Harvey Dramatize Need for Mitigation
HCFCD has documented flooding along Halls 14 times since 1989. But the two worst storms were Allison (2001) and Harvey (2017). Allison damaged 12,820 structures in the watershed. But Harvey damaged fewer – 11,831.
It’s fairly safe to say that without many mitigation improvements made prior to Harvey, Harvey damage would have been worse. However, rainfall distribution patterns make comparisons between the storms difficult.
The following table from HCFCD’s final Harvey report compares rainfall associated with severe, recent storms for various time periods. Tropical Storm Allison exceeds Harvey’s rainfall in the 6, 12 and 24-hr periods. But in the 2-day period, Harvey produced 6.0 inches more than Allison and 8.9 inches more over 4 days.
Photos of Stormwater Detention Projects from 7/19/22 Flyover
Last Tuesday, I flew most of the length of Halls Bayou with two fellow members of the Harris County Community Flood Resilience Task Force, Ken Williams and Bill Callegari. Let’s take a look at several Halls projects already completed or under construction – starting upstream and working east.
Helms Street Basins
East Helms runs between these two small basins just south of Aldine Mail Route Road. HCFCD completed these last year. They hold 119 acre-feet. That’s a little less than 3″ of stormwater falling over a square mile.
The basin will hold 180 acre-feet of stormwater. That’s about 3.5 inches of rain falling across a square mile. It will be a wet-bottom basin with a vegetated shelf.
Looking S at new detention basin. Between Halls Bayou at far end and Isom Street in foreground. Aldine Mail Route Road is under the camera position.
This basin is part of a larger mitigation project that will also extend and enlarge a channel north to the Western Homes subdivision along Aldine Mail Route Road.
Keith Weiss Park
One of the hidden gems of Houston is Keith Weiss Park east of Aldine-Westfield Road. The area is really a series of large connected detention basins disguised as a nature park with hike and bike trails, soccer fields, piers and boardwalks. City of Houston owns the park.
The Keith Weiss project removed 1,770,000 cubic yards of soil to create detention basins that hold approximately 963 acre feet of stormwater storage. That’s enough to hold a foot of stormwater falling across 1.5 square miles.
Google Earth shows that excavation started around 2006 and was substantially completed by 2010.
Wide shot looking east from over Aldine-Westfield Road. Halls Bayou flows away from camera.See close-ups of the three detention ponds below.Western-most basin. Halls Bayou in bottom center.Center pond. Still looking east toward US 59.Eastern-most pond.
Channel Improvements
HCFCD is making channel improvements along Halls in many locations. See project C-41. The area below lies between Keith Weiss Park and US59.
Looking SE along Halls toward US59. According to the HCFCD website, channel conveyance improvements and an additional detention basin are still in preliminary engineering.
Bretshire Stormwater Detention Basin
The Bretshire Stormwater Detention Basin on Halls Bayou added approximately 635 acre feet of additional stormwater storage upstream of Jensen Drive at US 59. It holds a foot of stormwater falling across one square mile.
Looking East across Bretshire Stormwater Detention Basin toward US59. The Fiesta store is by 59, left of center. Downtown is out of frame to the right.
HCFCD also had to buy out a large part of a subdivision to build the Hall Park basin on the opposite side of US 59. Flood Control substantially completed this project in 2018.
Looking NE across US 59 toward the Hall Park basin and Halls Bayou.
Hall Park holds 835 acre-feet. That’s enough to hold a foot of water falling across 1.3 square miles.
This project involved relocating a City of Houston sanitary sewer line and removing approximately 1.2 million cubic yards of soil.
This project required many buyouts that took almost a decade to complete.Roads shown inside the basin have been removed.
As part of its Bayou Greenways 2020 project, the nonprofit Houston Parks Board is designing and constructing the Halls Bayou Greenway – which includes a hike and bike trail, landscaping and neighborhood connections – along the southern edge of the stormwater detention basin. The full Halls Bayou Greenway will provide nine miles of publicly accessible open space from Brock Park to Keith Wiess Park.
In many cases, such stormwater detention basins are disguised as parks. So, many people don’t even recognize them as basins.
Hopper and Little York Basins
Slightly east of 59 at Hopper and Little York, HCFCD constructed two smaller basins in 2021 along a tributary of Halls. Together they hold approximately 200 acre feet. That’s about a foot of rain falling over a third of a square mile. Or four inches across a whole square mile.
Looking west toward 59 at Hopper Basin. Halls tributary cuts diagonally through pond in foreground.Looking S along the same tributary (in shade at left) at Little York basin. Little York runs along the bottom of the frame.
Such projects hold water back during storms until it can be slowly and safely released later when water in the bayou has receded.
Holding Back A Foot of Rain Falling Across Almost 5 Square Miles
Altogether, the detention basins in this post will hold almost a foot of stormwater falling across 5-square miles.
https://i0.wp.com/reduceflooding.com/wp-content/uploads/2022/07/20220719-RJR_9716.jpg?fit=1200%2C800&ssl=18001200adminadmin2022-07-24 08:23:182022-07-24 21:02:55Halls Bayou Has Come a Long Way, But Still Has Long Way to Go
Earlier this week, I photographed the collapse of one of the two last townhome complexes in Forest Cove on Marina Drive. Today, I flew over the demolition site and photographed contractors removing the last of the debris and cleaning up the site.
The images also show the extent of buyouts in the area as well as the last remaining townhome complex opposite the Forest Cove pool. One down. One to go!
Photos Taken on 7/22/22
Looking south toward San Jacinto West Fork. Site of recently demolished complex in foreground. Last complex at top of frame, left of pool.The demolition contractor has removed everything, including foundations and driveways – down to the dirt. This entire area was once filled with townhome complexes, owned or rented by people who loved the river lifestyle.Now only one remains. Harris County Flood Control has bought out the last owner and is doing final inspections before scheduling demolition sometime in August.From dust to dust. All that remains of this address is memories.The excavator is using an I-Beam to level the dirt.
Vast Improvement
Compare the image below with the one above.
After Harvey. Before demolition.This picture was taken in April, 2022.
Harvey was the final insult to these townhomes. These and neighboring properties became uninhabitable because of flooding. 240,000 cubic feet per second made them structurally unsound.
Since Harvey, all the derelict buildings drew drug dealers, graffiti artists and illegal dumpers. Now, the area will revert to nature and become, once again, a haven for eagles and other wildlife that still roam this area.
One down. One to go.
No More Insurable Structures
Many people have asked about the long range plans for this area. Harris County Flood Control now owns the property. It will never be developed. Under the terms of the FEMA grant used to finance the buyouts, “no insurable structures” can ever be placed on this land again. That severely limits possibilities.
So What Comes Next?
However, the land could still be used for parks and trails. Beth Walters, a spokesperson for HCFCD confirmed this afternoon that Harris County and the Houston Parks Board have been in talks about this property. However, she was not aware of any decisions that have been made at this point. Creating something beautiful on this property will likely take fund raising, long-term budgeting, and the cooperation of multiple entities.
The Value of Park Land
In my humble opinion, a long linear park stretching from here to US 59 might be the highest and best use for this land. It would turn a negative into a positive. If a deal can be worked out, it would help restore nearby property values in Forest Cove. These derelict townhomes certainly did not help them.
Many studies point to an increase in home values near parks. This one suggests an 8% to 20% bump. I hope the community can come together around the idea of turning this area into a park.
Meanwhile…a couple miles downstream, developers are busy building even more condos and apartments…even closer to the river. And they say that one of the hallmarks of human intelligence is that we can learn from each other’s mistakesI
Posted by Bob Rehak on 7/22/2022
1788 Days since Hurricane Harvey
https://i0.wp.com/reduceflooding.com/wp-content/uploads/2022/07/20220722-RJR_0462.jpg?fit=1200%2C800&ssl=18001200adminadmin2022-07-22 17:54:092022-07-22 21:59:32Forest Cove Townhomes: One More Gone, One to Go
When Harris County Flood Control District (HCFCD) and the Army Corps began Project Hunting (the Hunting Bayou Federal Flood Risk Management Project) in 2014, they estimated it would cost $100 million and take until late this year.
A flyover of the construction along Hunting Bayou looks like it is nearing completion…right on schedule. It will soon be done, except for the backslapping. Compare the shots below to those I took last year.
Hunting Bayou runs just inside North Loop 610 most of the way from US59 to Wayside. However, starting at Wayside, it dips outside the Loop, then goes back inside again, and finally outside a second time. Eventually, the Bayou works its way to the Houston Ship Channel near the City of Galena Park.
Scope of Project
Project elements include:
Excavating a stormwater detention basin on a 75-acre site near the northeast corner of Homestead Road and Loop 610
Widening and deepening about 4 miles of Hunting Bayou
9 bridge replacements / 8 modifications and channel conveyance improvements under bridges
Project Benefits
HCFCD says that most neighborhoods near the bayou will see water surface elevation reductions of 3-4 feet for the 1 percent annual chance (100-year) flooding event. The number of homes and businesses subject to the 1 percent (100-year) flooding event would drop from 5,100 to 650. And all homes and businesses will benefit from the reduced frequency and depth of flooding.
Need for Project
The Hunting Bayou watershed has Harris County’s second highest percentage of Low-to-Moderate Income (LMI) residents – 69%. That means more than two out of every three people earn less than the average income for the region.
Hunting is a small watershed. It comprises only 31 square miles. Its size ranks 19th out of 23 watersheds in the county.
Population grew only by 2,323 residents between 2010 and 2020. It went from 75,908 to 78,231. That now ranks it 14th in population among all watersheds, and 8th highest in people per square mile.
In five major storms between 2000 and today (Allison, Tax Day, Memorial Day, Harvey and Imelda), floods damaged 15,763 structures in the watershed. But virtually all of that damage came from Allison (8,270) and Harvey (7,419). The other three storms combined damaged only 74 structures, according to statistics compiled from HCFCD Federal Reports.
Thus, Hunting ranked 7th in total damage out of 23 watersheds, but because of its small size and high density, it had 508.5 structures per square mile damaged by floods since 2000. That means…
Hunting ranked #2 out of 23 watersheds in damage per square mile.
Data Obtained from HCFCD Via foia request
The watershed is highly urbanized with a mixture of residential, commercial and industrial developments. It’s home to one of the largest rail yards in the Houston area.
Union Pacific Englewood Yard in NE Houston along Liberty Road (right). HCFCD had to replace three railroad bridges over Hunting Bayou as part of the project.
Aerial Survey Shows Mitigation Construction Almost Complete
On Tuesday this week, I flew over Hunting Bayou with Ken Williams and Bill Callegari. Both are fellow members of the Harris County Community Flood Resilience Task Force. The pictures below show highlights of the construction.
Looking west at Hunting Bayou while hovering over US59 North. The widening of Hunting stretches downstream for about 4 miles to where Loop 610 North (on the left) turns right and heads south.Same area. Looking SW toward 59 and downtown. Notice the rip rap (irregular chunks of broken concrete or rock) below storm sewer outlets. It disperses the force of rushing water and slows it down to reduce erosion.Work continues around two neighborhood bridges at Falls St. and Leffingwell St.Likewise, widening continues at Hirsch Road.Looking back upstream at all three bridges, plus a pedestrian bridge over a small tributary in the distance.Wider shot, looking upstream over Wayne Street.Previously finished section around Wipprecht bridge.Note how bayou narrows under Lockwood Bridge due to commercial development on either side.Looking back upstream (west) from over Kelly St. at linear park that parallels another large detention basin.Note the new pedestrian bridges.They have been widened to accommodate the wider bayou.Rotating 180 degrees from shot above, we can see downstream to rest of park and where the Bayou threads its way under Loop 610N. Also note large detention basin in distance.Looking back SW from over Kelley Street. Note concrete lining that now protects narrow section under 610 bridge.Looking SW toward Homestead Road (with the bridge) across the new 75 acre stormwater detention basin.
The Curtis M. Graves Detention Basin shown above provides approximately 1,000 acre-feet of stormwater storage capacity. That’s almost 10 inches of rain falling over a square mile. Construction of the basin began in 2020.
Looking west along 610 N at the section of Hunting that briefly dips outside of the Loop.Looking NW. Note again the new concrete lining where the channel narrows to go under the Loop 610 N bridge. Water flows toward the camera.
Compare Bayou Downstream From Project
Where the bayou narrows to go under a bridge, the increased water pressure during a flood can cause a “jetting” phenomenon that rapidly erodes banks and undermines bridge supports. Hence, the need for concrete reinforcement.
Looking S along East Loop 610 beyond the eastern end of the project. The Bayou loops around storage tanks (lower right) and heads south toward Wallisville Road, before heading east again. This shows what the bayou looked like before widening.Compare width to previous shots.
The tank farm is the approximate eastern limit of Project Hunting.
Project History
This project began on December 16, 2014, long before Harris County’s Flood Bond in 2018. It was a key project of County Commissioner El Franco Lee (who lived in the area) and Congressman Gene Green. Despite a low benefit/cost ratio, they called in favors and got the project started.
The agreement between the Army Corps and HCFCD lets HCFCD qualify for reimbursement from the Federal government for work completed.
Between the channel widening and detention basin, HCFCD has removed almost a million cubic yards of soil to create more room for floodwaters. Width of the Bayou now varies from about 30 to more than 500 feet between the project limits.
According to data obtained via a FOIA Request, HCFCD and its partners spent $96 million on Hunting Bayou between 2000 and the end of last year. Some of that money has been spent on other projects. To see a complete list of HCFCD projects in Hunting Bayou, visit the District’s Hunting page.
Since 2000, Harris County Flood Control District (HCFCD) and its partners have spent more than a half billion dollars to reduce flooding in the White Oak Bayou watershed. And they aren’t done yet. Before the flood bond is complete, they will have spent at least $575 million to create detention basins, widen channels and make other improvements.
On 7/19/2022, I flew up White Oak Bayou in a helicopter with Bill Calligari and Ken Williams, two fellow members from the Harris County Community Flood Resilience Task Force. Our goal: to learn what the money bought.
This is the second of four posts. The first covered Greens Bayou. The next two will cover Hunting and Halls Bayous.
White Oak Bayou by the Numbers
White Oak Bayou is Harris County’s sixth largest watershed but its third most populous. 51% of its residents qualify as Low-to-Moderate Income (LMI). It’s our fourth most densely populated watershed (people/square mile). Not surprisingly it had the third most damage in 5 major storms since 2000 (Allison, Tax Day, Memorial Day, Harvey, Imelda). The storms damaged 25,739 structures. Look at some of the photos below of structures crowding the bayou and you will understand why.
White Oak Bayou from the Air
White Oak Bayou flows southeast from its headwaters northwest of FM 1960 to its confluence with Buffalo Bayou near downtown Houston. The watershed comprises 111 square miles, with 146 miles of open streams. They include:
White Oak Bayou
Little White Oak Bayou
Brickhouse Gully
Cole Creek
Vogel Creek
Our helicopter started the White Oak leg of our flight near the Heights north of downtown. From there, we flew upstream. This is what the Heights looks like from the air – a study in population density which correlates highly with flood damage.
White Oak drains most of the Heights. Note the density of development. In 2010, the watershed census was 433,250. But by 2020, it had increased to 464,933.
Looking south toward downtown from over Ella and TC Jester. Most of this segment of the bayou was finished years ago and requires only repairs now.Looking W, upstream from over West 34th and TC Jester.
HCFCD now maintains White Oak and has observed a number of locations where concrete is approaching the end of its useful life.
Looking upstream from over Garapan Street just north of Tidwell at bank and concrete repairs.(Arbor Oaks buyout area is in upper right. See end of post.)
Some projects are still being studied. Some are complete or nearly so. As of June 8, 2022, HCFCD was working out a contractor issue on the largest project, which will delay the originally scheduled completion this summer.
Federal Flood Damage Reduction Project
The largest project is the White Oak Bayou Federal Flood Damage Reduction Project. This $124 million project will substantially reduce flooding risks along White Oak Bayou. It started in 1998 in partnership with the U.S. Army Corps of Engineers, with the Flood Control District designated as the lead. The two segments of the project are fully funded to completion.
Upstream segment of Federal Project.
Limits of downstream segment of Federal Project
They include:
Construction of approximately 15.4 miles of channel conveyance improvements along the bayou from FM 1960 to Cole Creek near West Tidwell in the two segments above.
Excavation of six stormwater detention basins to hold almost one billion gallons of stormwater. That’s enough to hold a foot of rain falling across almost 5 square miles.
Construction of the Jersey Village Bypass Channel
Stretch of improvements upstream from Alabonson Road.
Upon completion, HCFCD estimates that most parts of the project area will see water surface elevation reductions of 0.1 to 1.8 feet for a 1 percent annual chance (100-year) flooding event.
HCFCD
Looking S.White Oak Bayou Detention Basin near West Little York and Hollister.Looking S toward White Oak Bayou near Fairbanks North Houston Rd. Basin completed in 2021A smaller detention basin opposite the one above skirts the south side of White Oak at Fairbanks North Houston (bottom right).Channel improvements and greenbelt trail still under construction.Looking west at White Oak where it crosses under Beltway 8. Note bridge improvements and vegetated detention ponds on left on both sides of bayou.
Many smaller detention ponds like those above now line both sides of the bayou and its tributaries from upstream to down.
Arbor Oaks Subdivision Buyout
Since 2003, HCFCD has bought out more than 200 homes in the Arbor Oaks subdivision. It is still buying more on either side of Vogel Creek to build a 431 acre-foot stormwater detention basin and restore the floodplain. That would hold a foot of rain falling over 2/3rds of a square mile.
Acquisition costs in such densely populated neighborhoods can easily exceed construction costs.
This part of the White Oak story dramatizes how costly, difficult and time-consuming it can be to buy out and mitigate areas built in floodplains.
Note the large areas with streets marked, but few or no homes on them. They were bought out and this area will become another large detention basin. Image courtesy of Apple Maps.
Here’s what part of it looks like from a few hundred feet up.
Lower part of Arbor Oaks area on bottom left.Bridge is on West Little York. Looking SE toward downtown.Looking SE at floodplain south of Little York near Arbor Oaks. Note aging concrete along White Oak Bayou on right.
And then there’s the North Canal near downtown. HCFCD and the City of Houston are working to finalize an interlocal agreement. Grant funding calls for completion of the first phase of the project by May 2023.
They all add up to more than a half billion dollars…and counting! Water needs somewhere to go during a storm. If we don’t leave a floodplain for floodwaters to safely expand, they will wind up in peoples’ living rooms.
Posted by Bob Rehak on 7/20/2022
1786 Days since Hurricane Harvey
https://i0.wp.com/reduceflooding.com/wp-content/uploads/2022/07/20220719-RJR_9908.jpg?fit=1200%2C800&ssl=18001200adminadmin2022-07-20 20:54:042022-08-29 14:45:27White Oak Bayou: What A Half Billion Dollars Looks Like
Harris County Flood Control District (HCFCD) and its partners continue to add detention basin capacity along Greens Bayou to reduce the risk of flooding. I flew in a helicopter today with fellow Harris County Community Flood Resilience Task Force members Ken Willians and Bill Calligari. We flew over Greens, Halls, Hunting, and White Oak Bayous. In this post, let’s focus on what we found in Greens.
From west to east, we flew over the Cutten Basin at 249 and Beltway 8, then followed the bayou over the Antoine, Kuykendahl, Glen Forest, Aldine-Westfield, and Lauder Basins. Some have recently completed construction. Others are still under construction. Here’s a rundown of everything between US249 and US59 along Greens.
Cutten Basin
Scheduled for completion later this year, the Cutten Basin covers approximately 250 acres. It includes five compartments, four south of Greens Bayou and one north. When complete, it will hold 850 acre feet of stormwater. That’s enough to hold a foot of rain falling across approximately 1.3 square miles. It will lower the water surface elevation along Greens by a third of a foot in a hundred-year flood.
Looking S toward Beltway 8. Greens Bayou flows from right to left through the center of the frame. Looking East. Greens cuts through the upper left portion of the frame. Beltway 8 cuts through the upper right.Looking West across Hollister which cuts through the middle of the frame.
Antoine Basin
HCFCD and the Army Corps started the $80 million Antoine Basin in 2015. The Army Corps designed and built it. Satellite photos in Google Earth first show it holding water in November 2020.
Looking east along Greens toward the Antoine Basin, top right.Looking SW. West Greens Road arcs through center of frame. Greens flows from upper right to lower left. Beltway 8 near top of frame.
The completed basin holds approximately 1,650 acre-feet, or 538 million gallons of stormwater. To put that in perspective, it holds a foot of rain falling over a 2.5 square mile area, or half a foot falling across 5 square miles!
Kuykendahl Basin
Kuykendahl Stormwater Detention Basin sits on a 288-acre property near Kuykendahl Road and Ella Boulevard along an unnamed tributary of Greens Bayou. In floods, it holds water back from entering the bayou and then releases it safely and slowly after the storm has passed.
Wide shot of Kuykendahl Basin looking westKuykendahl in foreground. Note how densely populated the area is with apartments.
Contractors removed 3.61 million cubic yards of soil from the site. It holds 2,325 acre-feet, or 757.6 million gallons of stormwater. That’s a foot of rain falling across 3.6 square miles, or half a foot falling across 7.2.
Following construction, contractors planted 22.19 acres of native tree and shrubs, and 12.79 acres of stormwater quality-treatment wetlands. They also created 14.04 acres of other wetlands to replace those impacted by construction.
Ceres Environmental Services Inc. constructed the Kuykendahl basin and another to the east (see Glen Forest below). Combined, they were the largest construction contract ever managed by HCFCD up to that time. The two basins reduced or removed flooding risks and damages from more than 1,100 structures along Greens Bayou. “Avoided damages” exceed $90 million in every flood. Far more than the cost of construction.
FEMA awarded $39.2 million to the Harris County Flood Control District, under the Hurricane Ike Hazard Mitigation Grant Program (HMGP) to construct the basins and HCFCD contributed matching funds.
Google Earth satellite photos indicate construction finished for both basins in 2020.
Glen Forest
Farther east along Greens, the Glen Forest Detention Basin extends from I-45 to Imperial Valley north of Greens Road.
Looking East across I-45 at Glen Forest Basin.Looking West at Glen Forest Basin on Greens Bayou between I-45 at top of frame and Imperial Valley Drive under camera position.
The Glen Forest Basin project removed approximately 2.15 million cubic yards of soil in three connected cells. The completed basin holds approximately 894 acre-feet. That’s 1.4 square miles one foot deep or 2.8 square miles a half foot deep.
Aldine Westfield Basins: Phases 1 and 2
Farther east along Greens Bayou, directly south of Houston’s Bush Intercontinental Airport, you will find two more new basins. HCFCD completed construction on the first in April 2021. The second (to the north) then began construction and has not yet finished.
Looking East from over Aldine Westfield Road in foreground at Phase One. Beltway 8 in upper right. Note Greens Bayou turning south under Beltway in upper right.Looking ENE. Phase 2 is still under construction on Aldine-Westfield Road immediately north of Phase 1 (lower right). Note airport tower on horizon.
The two basins when complete in 2024 will hold a foot of rain falling over more than 2 square miles (1260 acre feet). That concludes your helicopter flight down Greens Bayou for today.
Greens by the Numbers
Together, these basins should hold approximately a foot of rain falling over 12 square miles.
That’s not enough to prevent flooding in another Harvey. But it will certainly reduce flooding for thousands of people. HCFCD has not yet released updated flood-risk data for the mid- and upper reaches of Greens Bayou (shown above). More news on that when it becomes available.
According to data obtained from HCFCD via a FOIA Request, Flood Control and its partners have spent more than $435 million on flood mitigation in Greens Bayou between 1/1/2000 and the end of last year. That includes money spent on all phases of all projects shown above.
Only three other watersheds have received more funding since 2000: Brays, White Oak and Sims. But more on those later.
Greens was the second most heavily damaged watershed in five major storms (Allison, Tax Day, Memorial Day, Harvey, Imelda). Those storms damaged more than 29,000 Greens structures.
58% of the population of Greens has low-to-moderate income (LMI). That ranks 6th on the LMI scale of Harris County watersheds.
This morning at 10:34 AM, the last remains of another Forest Cove townhome complex toppled to the ground. The HCFCD demolition contractor nibbled away at it last week and earlier this morning. Eventually, all but a narrow strip of the last townhome in the complex had turned into a pile of rubble.
That strip started to lean. Then, suddenly, one more touch from the excavator, and the building collapsed on itself with a billowing cloud of dust and a thunderous boom. When the dust cleared, only one last complex remained standing.
As of Saturday, 7/16/22, one of the last three buildings was completely gone along with half of the second.Early Monday, 7/18/22, demolition of the remaining portion of the second building started again.As the excavator clawed away at the building, it started to lean.Periodically, the excavator would pile more rubble under itself so it could then reach higher. Note falling doors, walls and floors, frozen in space by the camera’s fast shutter speed.What took months to build came down in seconds.Note the severe bowing of the wallon the right.
Final Collapse Caught on Camera
At this point, I sensed the building would soon collapse. So, I switched from the drone to my Nikon which can shoot many more frames per second. And then it started…
With parts of the second and third floors removed, along with most of the truss structure in the attic, the remainder of the building started to collapse in on itself.A chimney came tumbling forward.The final collapse took less than 10 seconds. Three minutes later, the dust had cleared.
Next Steps
Contractors will extract any recyclable waste from the rubble. Then, they will crush what remains so that it takes less space in a landfill. Finally, they will remove the concrete from the foundation and likely recycle that, too.
Eventually, this area will return to nature. However, what form that takes has not yet been determined. Typically, HCFCD partners with other organizations such as the Houston Parks Board to create and maintain improvements such as trails, parks or recreational space. In fact, the Houston Parks Board West Fork Trail currently ends behind the rubble in the photo above. The Parks Board plans to extend it to Edgewater Park at US59, so hikers and bikers can connect from the Kingwood Trail System to the Spring Creek Greenway.
Demo Date for Last Building
After this morning, only one Forest Cove townhome complex remains standing. That’s at 1020 Marina Drive near the community swimming pool. According to Amy Stone, a Flood Control District spokesperson, HCFCD will demolish that building starting August 1, 2022. More news to follow.
Posted by Bob Rehak on 7/18/2022
1784 Days since Hurricane Harvey
https://i0.wp.com/reduceflooding.com/wp-content/uploads/2022/07/20220718-DJI_0249.jpg?fit=1200%2C799&ssl=17991200adminadmin2022-07-18 13:22:152022-07-18 14:54:27Caught on Camera: Moment Forest Cove Townhome Toppled
7/17/22 – The San Jacinto River Authority (SJRA) has completed its initial sand trap study, in partnership with Harris County Flood Control, and reviewed public comments. According to Matt Barrett PE, SJRA’s Manager of Water Resources and Flood Management, the SJRA is working toward a pilot study. But a successful pilot will require several things including funding partners and consultation with regulatory agencies, such as TCEQ and Texas Parks and Wildlife.
The goal of the project: intercept and remove sediment migrating downstream to reduce buildups elsewhere.
West Fork mouth bar after Harvey and before dredging. A small area at the far right had been building up before Harvey. The rest appeared when Harvey’s floodwater’s receded.
The proposed pilot sand trap could not possibly remove enough sand by itself to prevent the build up of another giant sand bar like the one above. However, a network of such traps might help.
Consultation with Regulatory Agencies
In Texas, among other things, TCEQ regulates floodplains, sand mining, and water quality. Texas Parks and Wildlife regulates rivers between the vegetation on each bank.
Possible location of trap for pilot study outside Hallett Mine on West Fork. Trap would consist of a trench through the middle of the point bar in the foreground.
But a trench at this location might run afoul of new TCEQ BMPs for sand mining that specify 100-foot buffer zones adjacent to perennial streams greater than 20-feet wide.
Schematic diagram of proposed trap at location above from initial conceptual design study finished before TCEQ adopted new BMPs.
Finding Funding Partners
SJRA must also find funding partners as it does not have a revenue source to pay for a pilot study and full construction costs of sand traps. In that regard, Barrett mentioned Harris County Flood Control and City of Houston as potential partners.
Barrett is also exploring partnerships with APOs (Aggregate Production Operations, aka sand mines). Sand mines can help defray expenses by removing sand from the traps as it accumulates. Of course, their desire to do that will depend on the location of the traps. They would prefer something close to their mines to minimize transportation costs and logistics while maximizing salability of the sand.
Hungry-Water Concern
Barrett also mentioned the need for the preliminary engineering design to avoid a “hungry water” effect which might increase erosion downstream. Hungry water results when streams have more power to transport sediment than they have available sediment. As a result, it erodes stream beds and banks to compensate.
Would Program be Extendable if Successful?
In a wide-ranging 45-minute discussion with Barrett, I raised several other potential issues. They included:
Location of the test near APOs, far upstream from the heavily damaged areas near Lake Houston where sand accumulates. There are no active sand mines between Humble and Kingwood – and few on other tributaries.
No sediment gages upstream and downstream from the test site. Not having a way to demonstrate success could limit future expansion of the program.
Potential partners that could remove sand from traps NOT located near APOs. You need a way to get sand out of a trap after it fills up. If the City of Houston or HCFCD established an ongoing maintenance dredging program, that could solve this issue.
How long an APO will remain committed to a location near a trap. After going to the expense of building a trap, SJRA would want to make sure the APO didn’t move operations to another location in a year or two. For example, some sand miners have talked about moving to the East Fork to take advantage of expected growth associated with the new Grand Parkway extension.
The SJRA must work through such issues to protect the public’s investment in the program. It has many moving parts. And the interests of all partners must align before moving forward.
Outline of Next Steps
So the next steps are:
Find partners with money whose interests align.
Obtain commitments from them.
Consult with regulatory agencies to avoid potential conflicts.
Lock down a location near an APO.
Begin preliminary engineering.
Ensure the pilot study (based on proximity to APOs) can extend to other areas (Rehak concern)
Find a way to measure success to help extend the pilot program if successful
In business, there’s an old maxim: “That which can be measured will be repeated.” Doing a pilot study that can’t be measured or replicated elsewhere helps no one.
The Army Corps has also published extensive research about the effectiveness of different sand-trap designs. Search for “Army Corps sand trap studies.” I originally became interested in the concept when I read a Corps study about a test of different trap geometries in the Mississippi River. There are many alternatives including some that could be located where water slows down at the entrance to Lake Houston (where the Harvey mouth bar appeared in 2017). Such a location would have the advantage of intercepting sediment from all upstream sources, not just the West Fork...if all the tumblers aligned.
Posted by Bob Rehak on 7/17/22
1783 Days since Hurricane Harvey
https://i0.wp.com/reduceflooding.com/wp-content/uploads/2022/03/Screen-Shot-2022-03-27-at-6.28.40-PM.png?fit=1920%2C1206&ssl=112061920adminadmin2022-07-17 16:31:402026-08-05 16:49:36SJRA’s Next Steps After Public Comments on Sand Trap Study
Mavera, a 1700-acre new development in southern Montgomery County at FM1314 and US242 has finished clearing a large section of land northwest of the intersection and started pouring concrete. Signs welcome visitors to model homes. The area, once laced with wetlands now has a massive linear detention pond and uses FM1314 for outflow control.
Looking east just north of US242 on right from over FM1314. Note wet areas in foreground. They correspond to wetlands in map below.Large green area immediately east of 1314 (diagonal) and north of US242 (bottom) correspond to wet areas in photo above. From US Fish and Wildlife Service National Wetlands Inventory Map
Areas west of FM1314 to Crystal Creek are also being cleared, but their current state of development is not quite as advanced.
Likewise, an area east of FM1314 has expanded north, almost to Gulf Coast Road. Neither is its drainage fully developed.
Looking NE at current limit of development. Gulf Coast Road runs diagonally from left to right just beyond tree line.
Long, Linear Detention
The development relies on a wide linear detention basin – more than a mile long! And that’s only the part east of FM1314!
Looking east toward upstream end of detention basin.
Two smaller basins also exist. One is currently by a small park and recreation center.
Looking WSW.Note small retention pond and rec center in upper right.
In the photo above, also note the small swales that outline lots. Will some drainage go overland? Or is underground drainage just not connected to the detention basin yet?
Same spot. Lower elevation. Looking west from eastern portion of Mavera. I’m not seeing any drainpipes from storm sewers entering pond yet.Note three new model homes near center of frame.
The development seems to have undergone a series of name changes. The land was originally known as the Denbury Tract. Later, construction plans and a drainage analysis refer to it as Madera. But now, the builders are marketing it as Mavera.
Screen capture of cover sheet from drainage planshowing first two names of development.
The drainage plans for Mavera (aka Madera/Denbury tract) rely on a hydrologic timing assessment (see last line in screen capture above).
The drainage analysis claims the development will have no downstream impact, but engineers didn’t study those areas. Nor did they study how new development upstream may have already shifted the peak of a flood.
Impact on FM1314?
Long linear detention schemes typically accelerate the flow of water. This one will rely on one culvert under FM1314 to hold back more than a mile of water collected from hundreds of acres. That will put a lot of pressure on FM1314 in a heavy storm.
Looking NW over FM1314. East is to the right. Water will flow west toward Crystal Creek out of frame to the left.
The roadway will act as a dam to detain water collected from almost all of the area shown in the photo below.
Looking east. Virtually all of the cleared area will drain through one culvert under FM1314. FM1314 runs left to right through the bottom of the frame. US242 is on right. Notice how channel is being widened, making culvert off-center. Did someone initially miscalculate or did plans change?
FEMA mapped most of this area in a ten-year flood zone. For the sake of potential home buyers, let’s also hope the engineers got the drainage calculations right.
The thoughts expressed in this post represent opinions on matters of public concern and safety. They are protected by the First Amendment of the US Constitution and the Anti-SLAPP Statute of the Great State of Texas.
https://i0.wp.com/reduceflooding.com/wp-content/uploads/2022/07/20220716-DJI_0152.jpg?fit=1200%2C799&ssl=17991200adminadmin2022-07-16 15:56:422025-08-19 22:11:03Mavera Wetlands Bite the Dust