Two on the east side of FM2100 have come a long way since I first photographed them seven months ago. Last July, I flew over Los Piños and Saint Tropez. At the time, Los Piños was paving streets. Saint Tropez had just broken ground and started clearing.
On 3/5/23, I flew over both again and drove through Los Piños.
Saint Tropez is in upper portion of map at FM2100 and Meyer Road. Los Piños is south of Saint Tropez.
Los Piños now has a welcome center open that trumpets “owner financing.” And Saint Tropez looks to be in the final stages of clearing and grading. Let’s look at some “then-and-now” photos for both areas.
Los Piños
July 2022
Los Piños Phase I in July 2022
March 2023
Los Piños Phase I looking west, March 5, 2023Los Piños Phase I looking east, March 5, 2023
The 130-acre Los Piños Phase I tract represents only 0.34% of the larger LH Ranch Tract from which it is carved.
Saint Tropez
Looking SW
Megatel, the developer had just broken ground the month before I first flew over St. Tropez in July 2022.
Saint Tropez in July 2022. Looking SW from NE corner.
Here’s how the property looks today from the same angle.
Saint Tropez looking SW from NE corner, March 5, 2023
Looking SE from Over FM2100
Saint Tropez in July 2022, looking SE from NW cornerSame angle seven months later. Saint Tropez in March 2023.
From FM2100 to the far end of the development is about a mile. The owner, Megatel plans to build a 1,000-acre, 4500-home community around a giant manmade lagoon with white sand beaches, a water park with surf simulator, and an entertainment district.
The press release announcing the groundbreaking last year in June stated that Megatel anticipated completion of Phase I sometime in the first quarter of 2023. They have a long way to go in the next three weeks! Rising interest rates and the recession in the housing market may have slowed plans down.
Los Piños Drainage Plans Claim No Adverse Impact
Both developments naturally drain southeast toward tributaries of Luce Bayou. You can see a channel leading toward them in the photo below. But at this writing, I only have drainage plans for Los Piños.
Looking SE from Saint Tropez in foreground toward Los Piños (upper right) and Key Gully/Luce Bayou out of sight in background. Drainage channels from Saint Tropez (upper left) and Los Piños (foreground) come together and veer right toward Key Gully and then Luce Bayou.
Preston Hydrologic developed the drainage plans for Los Piños and claimed the side slopes of the channels would be grass-lined to reduce/prevent erosion.
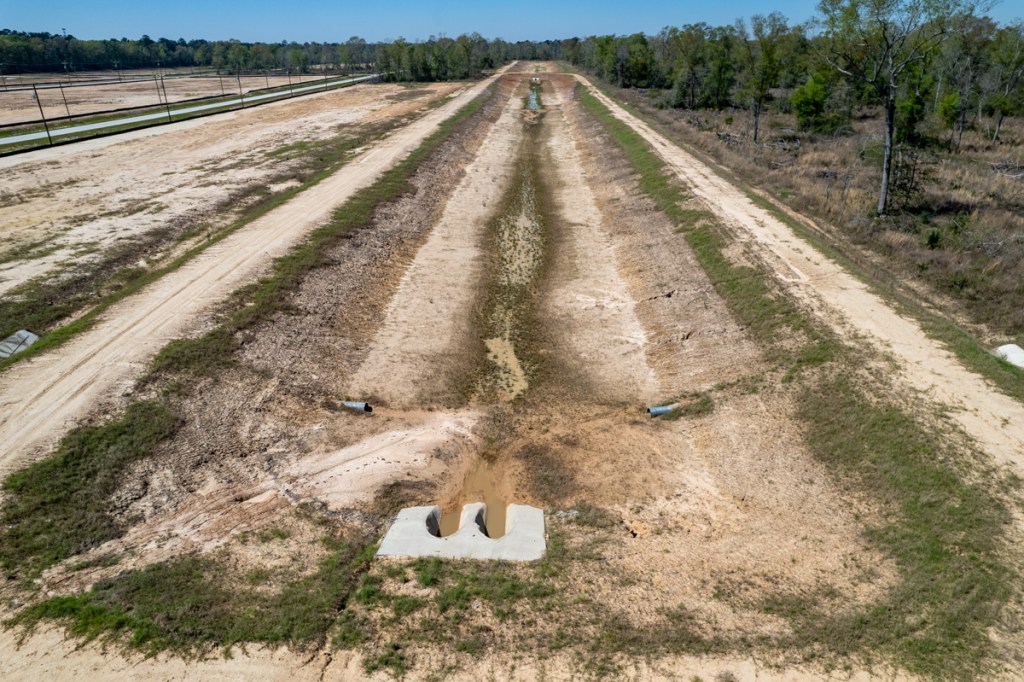
The developer may have to replant grass to reduce erosion. Los Piñosphoto taken 3/5/2023.
While the upper portions of channel banks have some grass, it appears that grass on the lower portions has washed away. Significant erosion is visible on channel banks and culverts between these linear stormwater detention basins are filling with silt.
For the complete Los Piños drainage analysis, click here. The engineering company claims it has 25% more stormwater-detention-basin capacity than necessary. That should actually reduce flood risk downstream, assuming the plans are accurate. Preston claims Los Piños will have no adverse impact.
Wetlands are interlaced throughout this area. And wetlands mitigation will be part of the plans for developments on both sides of FM2100, according to the Army Corps.
Posted by Bob Rehak on 3/5/2023
2014 Days since Hurricane Harvey
The thoughts expressed in this post represent opinions on matters of public concern and safety. They are protected by the First Amendment of the US Constitution and the Anti-SLAPP Statute of the Great State of Texas.
https://i0.wp.com/reduceflooding.com/wp-content/uploads/2023/03/20230305-DJI_0268.jpg?fit=1200%2C799&ssl=17991200adminadmin2023-03-05 19:18:422024-02-04 12:09:32Los Piños Now Selling Lots in Huffman; Saint Tropez Still Clearing, Grading
The U.S. Environmental Protection Agency (EPA) offers an informative brochure titled Stormwater to Trees. It discusses how to engineer urban forests for stormwater management.
The brochure primarily targets engineers, planners, developers, architects, arborists and public officials. However, residents concerned about the loss of trees to new development may find it a useful tool to begin discussions with all of the above.
The 34-page brochure is about using trees to augment existing stormwater management systems and improve water quality while beautifying cities. It contains four major sections, briefly summarized below.
Section One: Urban Stormwater Runoff
By design and function, urban areas are covered with impervious surfaces such as roofs, streets, sidewalks, and parking lots. Rain falling on impervious surfaces cannot infiltrate the ground. Instead, it creates runoff: a problem for everyone. The runoff collects pollutants on its way to storm sewers that discharge into ditches, streams, bayous, lakes and bays.
This is how “non-point source pollution” starts. It can contaminate water supplies and affect the health of plants, fish, animals, and people. Excess runoff can also erode and damage property.
Section Two: The Role of Trees in Stormwater Management
In cities, trees can play an important role in stormwater management by reducing the amount of runoff that enters storm sewers. Trees act as mini-reservoirs that reduce and control runoff by:
Transpiration: Drawing water in through their roots and gently releasing it back into the atmosphere in the form of water vapor.
Interception: Leaves absorb rainfall, reducing the amount that hits the ground, and delaying/reducing peak flows.
Reduced Erosion: Tree canopies diminish the volume and velocity of rainfall, lessening its erosive force.
Increased Infiltration: Roots increase both the rate and absolute level of stormwater infiltration.
Phytoremediation: Trees can take up trace amounts of harmful chemicals and transform them into less harmful substances.
Increased soil volume and vegetation, including trees, maximizes potential for absorption, bioremediation and phytoremediation, according to EPA.Illustration from Stormwater to Trees.
Trees have proven value in reducing runoff and mitigating the costs of stormwater management, but their innate ability to absorb and divert rainfall has been underutilized, according to the EPA.
Therefore a major focus of this section is how to design sites for successful planting. It offers strategies for dealing with impervious surfaces and compacted soils that can stunt tree growth and shorten trees’ lifespans. For instance, pavements can be supported by pillars, piles, and structural cells, allowing for large volumes of uncompacted soil below ground.
Section Three: Stormwater Management Systems with Trees
The next section goes into more detail on each of those strategies. It discusses pros and cons of each and design considerations in various locations and applications. It also provides illustrations that help the reader quickly grasp the concepts.
This is the meat of the brochure. There’s too much in this section to summarize, but you can quickly scan it.
Major subsections include: suspended pavement and structural cells; structural soil; stormwater tree pits; permeable pavements; forested bioswales; and green streets.
Section Four; Case Studies
The final section of Stormwater to Trees contains illustrated case studies from cities across the country. Several describe 10% reductions in peak flows, a percentage consistent with academic studies elsewhere.
While that may not sound huge, it’s important if stormwater is lapping at your doorstep during heavy rains. It’s also important to remember that stormwater management is just one of the many benefits of trees. They also help clean the air, reduce energy needs, raise property values, and mitigate urban heat-island effects.
Newly elected State Representative Charles Cunningham has introduced a bill aimed at restoring sand mines to productive use after operators cease production. Cunningham filed HB1093 in December and it was referred to the House Natural Resources Committee on 3/2/2023.
Aimed at Protecting Water Supply for 2 Million People
HB1093 amends Section 28A of the Texas Water Code. It applies to aggregate production operations (APOs) located within 1500 feet of the San Jacinto. It deals with the reclamation of such mines and ensure water-quality in the river(s) around them.
The goal is to reduce adverse water-quality impacts to the San Jacinto and Lake Houston which supply drinking water to more than 2 million people. Additional benefits will accrue to recreation, wildlife, and environmental safety.
Requirements in Bill
Before abandonment, the bill requires APOs to file a reclamation plan signed by a licensed engineer. Such a plan would typically include measures such as revegetation, erosion control, grading, soil stabilization, and backfilling. The plans must also address:
Removal of materials used in production, waste, structures, roads, equipment and railroads.
Slope stability for the walls of remaining detention ponds
Closure of waste disposal areas
Costs for all of the above
Financial assurance (such as a performance bond, typical in the construction industry) designed to enable cleanup without cost to taxpayers if the operator walks away from the site or declares bankruptcy.
While we need sand to make concrete, we need clean water even more.
Why We Need This Bill
Think these issues aren’t real? They’re all around us. See the pictures below taken recently.
Dredge at abandoned mine on North Houston Avenue in Humble.More abandoned equipment at same mine.Another abandoned sand mine in Humble. No grading of slopes or vegetation that retards erosion. Note commercial structures threatened by collapsing walls of pit.Abandoned mine on East Fork in Liberty Countyshould have had soil stabilized with vegetation.Another shot from same mine. Old structures, materials not removed.And another. There are no fences to keep children from playing on this abandoned dredge.At the same mine on May 3, 2021. Note two breaches in dikes sweeping sand down the East Fork.Excavator in abandoned mine on West Fork.Collapsing dike of West Fork mine.Abandoned mine (foreground) next to recreational facility on opposite side of West Forkat I-45.
Part of Sedimentation Problem
Lake Houston has lost 20,000 acre feet due to sedimentation and continues to lose on average 380 acre feet annually.
In the 1980s, only one or two small mines existed on the San Jacinto West Fork. Today, sand mines occupy more than 20 square miles in a 20 mile reach of the river between I-69 and I-45. And many empty their pits into the river.
An active mine empties one of its pits into the abandoned mine in the foreground which drains straight into the West Fork.
The montage below shows the effect of such issues on water quality where Spring and Cypress Creeks join the West Fork. The angles vary. But in each shot, the dirtier water comes from the West Fork. This is typical and easily visible on most days.
Water coming from area with mines typically appears siltier.
Cost of Dredging
To maintain the capacity of Lake Houston and the conveyance of its tributaries, the City of Houston and Army Corps have dredged almost continuously since Harvey. To date, they have removed almost 4 million cubic yards of sediment at a cost of $226 million.
From presentation by Stephen Costello, City of Houston Chief Recovery Officer.
https://i0.wp.com/reduceflooding.com/wp-content/uploads/2022/01/20210817-DJI_0349.jpg?fit=1200%2C799&ssl=17991200adminadmin2023-03-03 19:17:032023-03-07 11:24:33Cunningham Sponsors Bill to Ensure Restoration of Abandoned Sand Mines
Part One began by talking about how, after every major natural disaster, FEMA sends in building-code experts to examine how structures performed and make recommendations for code changes to reduce future damage. It’s part of a process of continuous improvement that could/should make us all safer.
Part One ended with one of the most poignant stories I have ever heard. After a Cat 4 Hurricane struck Florida last year, a FEMA team was driving down a street littered with the debris of gutted homes and shattered lives. Mountains of waterlogged drywall, carpeting, furniture and cherished possessions lined both sides of the street waiting to be hauled away…just as it did in Houston after Harvey and Imelda.
Kingwood debris pile after Imelda.
But when the FEMA team got to the end of the street, they saw something that stunned them – a pristine home with nothing out front. It was actually the home on the street closest to the ocean. As they paused to marvel at the miracle, the homeowner drove up. They asked him the logical question, “Did you build above code requirements?”
“Not really,” said the homeowner. “I just built to what the code required.”
He went on to elaborate how the building inspector was a real stickler. “I thought he just had it in for me because I was a hippie. I really hated the guy.”
“What do you think of him now?” asked the FEMA employees. The homeowner extended his arms and made a bowing motion as if to praise and thank the man who had been such a thorn in his side.
Billions Saved
FEMA estimates that adoption of hazard-resistant building codes saved $32 billion during the last 20 years and could save another $132 billion by 2040. Not to mention saving a lot of heartbreak and misery.
So why are people so resistant to adopting higher building codes?
Resistance on Many Levels
Part Two of the presentation examined sources of resistance to adopting higher building codes. They used Louisiana’s attempt to increase freeboard factors as an example of the the types of resistance FEMA frequently encounters from various groups.
In engineering, freeboard is is the distance codes require you to build above the current estimated 100-year flood level.
The greater the freeboard, the safer you are.
But still, people found reasons not to increase the freeboard. The second presenter examined seven sources of resistance:
Perceived conflict between statewide minimum codes and local governments that may wish to adopt higher standards.
Uncertainty about where freeboard regulations had and hadn’t been adopted already.
Debate about whether the state or local authorities should establish standards.
Questions about why FEMA isn’t making the regulations at a national level.
Perceived lack of discounts in Risk Rating 2.0 national flood insurance premiums for structures elevated to meet higher freeboard requirements.
Concern about whether fill to elevate homes would make flooding worse.
Confusion over how building code officials and floodplain managers can collaborate.
All are valid concerns. But all can be overcome. Pretty easily, it turns out.
Answers readily exist for each of these issues. For example, with #6 (probably the most valid concern), communities have adopted standards to limit fill in areas where floodwater storage is a major concern.
For the other answers, see the entire presentation. The point I really want to make is about the pushback against proven practices that save lives and property.
Why Resist Changes that Avert Human Suffering?
As I watched the presentation, the image floating through my head was of the NTSB investigating a plane crash that killed hundreds of people. Imagine if the investigation found a defective engine part caused the catastrophe. Do you think manufacturers would resist upgrading the part?
It’s unthinkable. Who would board such an airplane? What aircraft manufacturer would even lobby against the change? The negative publicity would put them out of business.
But homebuilding and the development business are different. The industry has a million players, not a handful. A few bad actors can escape notice because:
The codes are so complex that few understand them.
Lobbyists frame discussion as “acceptable risk” vs. “unacceptable costs.”
Responsibility is shared among government regulators at many levels, their political masters, and private industry.
This creates an atmosphere of plausible deniability when disaster strikes. “We were just following regulations.” (Yeah, but who lobbied against them?)
Building Codes Like Seat Belts
Some readers may remember the battles to pass and enforce seat belt laws. Even though the federal government required manufacturers to install seat belts in all new cars starting in 1968, only 14% of Americans regularly used them at first. Adoption of state laws mandating usage was spotty. And when a Michigan state rep introduced a bill in the early 1980s that levied a fine for not buckling up, he received hate mail comparing him to Hitler. American’s love their freedom so much, they can even react negatively to efforts to protect them.
Only six municipalities in all counties shown here have adopted up-to-date building codes.
So when the next disaster strikes, let the finger pointing begin.
No wait! Let’s just get a bailout from FEMA!
Posted by Bob Rehak on 3/1/2023
2010 Days since Hurricane Harvey
The thoughts expressed in this post represent opinions on matters of public concern and safety. They are protected by the First Amendment of the US Constitution and the Anti-SLAPP Statute of the Great State of Texas.
https://i0.wp.com/reduceflooding.com/wp-content/uploads/2023/03/20230301-Screenshot-2023-03-01-at-10.33.27-AM.jpg?fit=1200%2C746&ssl=17461200adminadmin2023-03-01 11:01:492023-03-02 16:57:55Building-Code Pushback that Makes Disasters Worse
The Lake Houston Gates Project is moving closer to reality with breakthroughs on the benefit/cost ratio, funding and endorsements.
City of Houston Mayor Pro Tem Dave Martin and Chief Recovery Officer Stephen Costello provided updates on 2/27/23 at City Hall on the Lake Houston Gates Project. The wide-ranging, hour-long discussion covered several related topics. They included:
A critical path for construction
Dredging of the lake
Funding for gates and dredging
Several related engineering studies
A favorable ruling from FEMA on the Benefit-Cost Ratio
An endorsement to the area’s legislators by the Greater Houston Partnership.
Need For Gates
For those new to the area, the City of Houston has been pushing to add gates to the Lake Houston Dam ever since Harvey in 2017. Upstream, Lake Conroe’s gates can release 150,000 cubic feet per second (CFS). But Lake Houston’s can only release 10,000 CFS.
The disparity in discharge capacity complicates joint-reservoir-management and pre-release strategies designed to avoid flooding by reducing the water level in Lake Houston.
Lake Houston releases cannot keep up with Lake Conroe’s. And pre-releasing water from Lake Houston takes so long that storms can veer away during the lowering process, often resulting in wasted water. That’s an important consideration for a water-supply lake.
According to Martin and Costello, the gate project will:
• Serve as the first phase of a long-term effort to extend the life of the Dam • Enable the rapid lowering of lake levels in advance of a flood • Eliminate the need for a seasonal lowering of both Lake Houston and Lake Conroe • Provide potential water-rights savings • Protect an estimated 5,000 residential properties in the surrounding area • Yield an estimated half billion dollars in economic benefits during the life of the project
However, the City discarded that idea as “too risky” after further study. The engineering company cautioned the City that it would have a difficult time finding contractors willing to risk modifying a 70-year old concrete dam. The potential liability was just too great. So the City then revisited adding various numbers of tainter gates to the eastern, earthen portion of the dam.
Because tainter gates exceeded FEMA’s funding, the City had initially focused on crest gates. But after investigating the safety issues, the City decided to seek more funding for tainter gates instead.
Recommended location for new tainter gates is next to old ones, not farther east as I conjectured earlier.
The picture below is slightly wider and shows more of how both halves of the dam come together.
If funding comes through, new gates would go in the upper right along the earthen portion of the dam, next to the old gates.
Funding Needs
FEMA initially set aside $50 million for the gates. Plus Harris County committed $20 million in the 2018 Flood Bond to attract FEMA’s match. But the latest construction estimates show eleven tainter gates could cost between $200 and $250 million.
After engineering and environmental studies, only $68.3 million in funding remains. That includes an earmark secured by Congressman Dan Crenshaw. So the City is seeking another $150 million from the State of Texas. Martin and Costello have made weekly trips to Austin so far during this session to line up support from legislators, committee chairs, and the Texas Division of Emergency Management.
Social Benefits Improve Benefit/Cost Ratio
All this is suddenly possible because of a favorable ruling from FEMA on the benefit-cost ratio (BCR).
For years, Houston had struggled to get the BCR for the gate project above 1.0 (the point at which benefits exceed costs). Usually, FEMA strictly interprets benefits as “avoided damages to structures.”
But Houston Mayor Sylvester Turner and Costello met with FEMA to argue that the problem was much bigger than damaged structures.
As a result, FEMA allowed the City to add the value of “social benefits” to the BCR. Social benefits can include such things as avoiding lost wages when businesses are destroyed; transportation disruptions that reduce the region’s productivity; reducing negative impacts on student achievement when schools are disrupted; and more.
The social-benefit ruling covers a number of City projects, not just the gates. It should also benefit other areas, especially rural ones.
Said Costello, “The minute the social benefits came in, everything was great.” Instead of struggling to reach 1.0, the City is now far above it.
Greater Houston Partnership Endorsement
With that out of the way, the Greater Houston Partnership wrote a powerful letter to state legislators seeking their support for the gate project. See below.
The Partnership includes business leaders from 900 member companies in the 12-county Houston Region.
Dredging Update
While pressing ahead with the gates project, the City is also working on a long-term dredging plan for the lake and working with the SJRA on sedimentation and sand-trap pilot projects.
The lake has already lost more than 20,000 acre feet of capacity due to sedimentation. That worsens flooding. While the Federal Government supports efforts to improve Lake Houston now, the chances of getting more money in the future will be reduced – unless we can show that we’re at least keeping pace with annual sediment deposits.
Since Harvey, FEMA, the Army Corps, TWDB, and City of Houston have removed almost 4 million cubic yards of material from the lake at a cost of $226 million.
We have to prevent more sediment from coming downstream or dredge it after it gets here.
Stephen Costello, City of Houston Chief Recovery Officer
The City is currently lobbying for another $50 million for maintenance dredging to add to the money secured in the last legislative session by now-retired State Representative Dan Huberty. New Representative Charles Cunningham will reportedly now carry that banner forward along with State Senator Brandon Creighton.
Legislative News to Follow
March 10th is the last day to file bills in the Texas Legislature this year. Please visit the legislation page on ReduceFlooding.com for updates once bills are filed and start moving forward in Austin.
Thanks to all of our elected and appointed representatives who have pushed so hard on so many fronts for the last 2008 days to tie all the pieces of this complicated flood-mitigation puzzle together.
Posted by Bob Rehak on 2/27/2023
2008 Days since Hurricane Harvey
https://i0.wp.com/reduceflooding.com/wp-content/uploads/2023/02/20230227-Screenshot-2023-02-27-at-9.28.29-PM.jpg?fit=1200%2C679&ssl=16791200adminadmin2023-02-27 21:45:512023-02-28 11:45:24Lake Houston Gates Project Moves Closer to Reality
The controversial new Royal Pines subdivision that flooded a neighbor four times in two months has finally built a stormwater detention basin.
The good news: The basin should capture water flowing from one direction toward the neighbor.
The bad news: The height of the berm around the pond could back up water from the opposite direction onto the neighbor’s property. The concentrated flow could also erode the earth over a natural gas pipeline.
Drainage Now Concentrated Over Pipeline
The pipeline is buried only 36″ deep along the silt fence in the photo below. So any floodwater coming from the west (right) will now be concentrated directly over the pipeline.
Water used to converge from both east and west toward a natural depression in the middle of the new development. But contractors changed the natural grade, confusing the situation.
Looking south from over White Oak Creek toward the new 6.3-acre detention pond in the NW corner of Royal Pines. Water drains toward camera.
The drainage impact analysis for Royal Pines below shows that 11.6 acres outlined in purple (labeled as OFF1, for offsite area #1) drains through the larger 49.5 acre area that contains detention Pond 1 shown in the upper left. The plans show a channel running about a quarter of the way down the left border where the silt fence now is, then mysteriously stopping.
When I first saw the plans, I assumed the water in that channel would empty into the pond. But no inlets are installed at that location. At least not yet even though others are installed elsewhere.) See below and above.
Looking west toward neighborhood that flooded from development. No inletscome from that direction.
Instead, water coming from the west will meet a wall approximately 8 feet high.
The wall of the detention pond. This area used to slope down toward the trees in the background.Now you can barely see them.
The berm forms a dam against any water coming from the west (behind the camera position). That includes floodwaters from White Oak Creek.
So where will the stormwater go? Instead of spreading out, it will be squeezed between the berm and homeowners. That has the potential to cause more flooding.
The analysis claims the development will have no adverse impact either up- or downstream. However, during a five-year rain in January, the level of White Oak Creek came up much higher than a five-year flood.
What’s on the ground counts for more than what’s on paper.
Another Danger Lurks 36″ Down
But there’s potentially an even bigger danger. A natural gas pipeline is buried next to that silt fence that borders homes along the western edge of the detention pond. Erosion from all that concentrated water rushing over the pipeline could expose it, just as it exposed another pipeline 1.5 miles away.
The man behind the mine, Prabhakar Guniganti, also owns or owned Royal Pines. His name shows up on the general plan, although the Montgomery County tax rolls show a company called TC LB Royal Pines LP now owns the property. It’s not clear if there’s a connection between Guniganti and the Royal Pines Limited Partnership.
Guniganti has a history of corporate shell games. After the Attorney General sued him, ownership of his mine changed hands so many times that the AG had to add five shell companies to the lawsuit. The AG also added Guniganti as an individual and as a director of the companies/partnerships to the lawsuit. Because of all the delays, the case still has not gone to trial.
This does not inspire confidence. Especially among homeowners who may be flooded, but don’t have the State’s deep pockets.
When I and homeowners talked to Montgomery County Engineering last week, the developer did not yet have a construction permit for the pond. The county said only that if any changes become necessary, they will be at the developer’s expense.
Just a reminder. Section 11.086 of the Texas Water Code states, “No person may divert … the natural flow of surface waters in this state, or permit a diversion to continue, in a manner that damages the property of another…”
Posted by Bob Rehak on 2/25/2023
2006 Days since Hurricane Harvey
The thoughts expressed in this post represent opinions on matters of public concern and safety. They are protected by the First Amendment of the US Constitution and the Anti-SLAPP Statute of the Great State of Texas.
Harris County’s best hope to fully fund the 2018 Flood Bond just vanished into a political black hole. Watching the video of Commissioners Court on Tuesday made one dizzy. My head was spinning so quickly with all of the contradictions, that it reminded me of a Chucky horror movie.
Almost 2 Years After Leaving the Starting Gate…
After almost 2 years, the County’s Community Services Department (CSD) still has not even started working on a process that would define where $750 million in Hurricane Harvey Flood Mitigation money would go.
But its new director, Thao Costis, did recommend taking 58% of the money away from Harris County Flood Control District. County Judge Lina Hidalgo, Precinct One Commissioner Rodney Ellis, Precinct Two Commissioner Adrian Garcia, and Precinct 4 Commissioner Lesley Briones all voted FOR CSD’s vague proposal that gave $326.5 million to “Harris County” and almost $100 million to “planning and administration” with no further definition.
Ramsey Reminds Court of Purpose of HUD Money
Precinct 3 Commissioner Tom Ramsey PE reminded his fellow Court members that the U.S. Department of Housing and Urban Development’s (HUD) grant was originally intended to fill a funding gap in the flood bond.
For those who may not remember, roughly a third of the $2.5 billion 2018 flood bond was designed to attract matching funds from state and federal entities such as HUD. Harris County Flood Control District hoped to double taxpayers’ money that way. The bond actually had projects in it totaling roughly $5 billion.
At the time, HCFCD saw HUD dollars as the best way to support the hard-hit Halls Bayou watershed where 71% of the residents have low-to-moderate incomes (LMI).
Not Even Enough Left for HCFCD to Complete Halls Projects
But the money remaining with HCFCD after commissioners voted to divert more than half of the $750 million won’t even be enough to complete Halls projects.
The Flood Bond included Halls projects estimated at almost $383 million. Halls has already received projects worth $48 million, leaving a $335 million need. But giving only $326.5 million to HCFCD would leave Halls more than $8 million short.
That would leave no money for flood control projects in other watersheds. They would vanish into a political black hole.
The good people of Halls Bayou have had their projects lined up for years. Yet at 6:28:40 into the meeting video, Director Costis admits, “Our focus is to get projects lined up.”
For Halls Bayou residents who follow Commissioners Court, the video of Tuesday’s meeting will have their heads spinning faster than Chucky’s.
Commissioners Ellis and Garcia have complained bitterly about projects in LMI neighborhoods having to wait for federal funding that might never arrive. Then they voted to take $425 million away from HCFCD when it did.
Partnership Funding Merry-Go-Round
Commissioner Garcia, who couldn’t wait on partnership funding to get started on projects, demanded a partnership policy. Ditto for Commissioner Ellis.
But Ellis didn’t want to back away from the county’s “equity principles, because some cities might not have a match.” This could further reduce funding.
At 6:34:20, Ellis, who often brags about transparency, introduced a motion to prioritize projects using unspecified criteria before CSD comes back to Commissioners Court on March 3 with final recommendations.
Admission of Funding Gap
Then Ellis complained, “Even with this money, we don’t have enough money to do everything in the 2018 Flood Bond.” Where’s the other $425 million going, Mr. Ellis, that you’re diverting from HCFCD? Into that political black hole?
More Delays Could Jeopardize Funding
At 6:41, Dr. Tina Petersen, Executive Director of HCFCD, complains, “We’ll need to get an extension.” That’s something the Texas General Land Office (GLO), which manages HUD grants in Texas, has feared. The GLO worries that additional delays could cause HUD to take its money back. Harris County has been dragging this process out for almost two years.
Garcia again asks, “Is a partnership process in place?” (6:41)
Costis admits, “No. We’re starting that process now.”
Hidalgo abruptly cuts off the embarrassing discussion, takes a vote, and moves on to the next agenda item at 6:43:48.
Saying One Thing, Doing Another
Actions speak louder than words, especially in politics. It’s one thing to say flood mitigation is a top priority and that you want to help the county’s less fortunate first. But the figures below clearly show that…
…Ellis, Garcia and Hidalgo help our least fortunate residents the least.
To get a clear picture of political priorities, let’s visualize flood-mitigation spending as a percentage of the total value of projects in the flood bond for each watershed. This shows important differences in the progress toward completion of promised projects. See the table and map below.
In case you’re unfamiliar with the location of these watersheds, see below.
Greens has received 74.9% of its funding and Brays 79.4% of its. But both have lower LMI percentages than Halls, Hunting, Sims and Vince.
For instance, Sims has the third highest percentage of LMI residents in the county (65%), but has only received 4.4% of its anticipated funding.
Eight watersheds in Harris County have majority-LMI populations. But the LMI percentages have little to do with the percentage of money actually spent out of their anticipated budgets.
Contrary to promises, some of the least affluent watersheds are being prioritized last.
Brays and Greens have received more funding to date than the other six LMI-majority watersheds put together.
This is, in large part, because Commissioners Ellis and Garcia have constantly tweaked their equity-allocation formula to ensure money goes where they want it to go.
High Price of Turnover
The Houston-Galveston Area Council (H-GAC) learned of its $488 million allocation from the GLO the same day in May 2021 that Harris County learned of its $750 million. But H-GAC developed its distribution plan and received final approval from the GLO by September of 2022. And H-GAC had to coordinate more than 100 entities!
This comparison shows the high price of turnover in the executive ranks. Costis is the sixth executive director at CSD under Hidalgo. Ms. Costis previously ran a charity for homeless people. While admirable, that’s no qualification for managing hundreds of millions of dollars. And certain commissioners have not helped the process by making it more complicated than it already is with constantly changing demands.
If Harris County wants this money, it needs to hire leaders with business acumen, wall them off from political interference, and prohibit political patronage hires. Now that would really make people’s heads spin! It would also eliminate a political/financial black hole.
Posted by Bob Rehak on February 23, 2023
2004 Days since Hurricane Harvey
The thoughts expressed in this post represent opinions on matters of public concern and safety. They are protected by the First Amendment of the US Constitution and the Anti-SLAPP Statute of the Great State of Texas.
https://i0.wp.com/reduceflooding.com/wp-content/uploads/2023/02/Waterrshed-Spend-2022-copy.png?fit=1200%2C927&ssl=19271200adminadmin2023-02-23 21:44:492023-02-25 16:32:07Best Hope to Fully Fund Flood-Bond Projects Just Vanished into a Political Black Hole
Tuesday 2/21/23 at 5 P.M. will be your last chance to comment on Harris County’s proposed distribution of $750 million in HUD Flood-Mitigation funds.
Harris County Community Services Department (CSD) will request Commissioners Court approval of its plan for allocating $750 million in HUD Harvey mitigation funds Tuesday. (See item 489 on the Agenda.) The Texas General Land Office (GLO) has conditionally approved the preliminary plan and sent it back to Harris County for public comment.
However, the plan still consists only of a high-level outline. The county wants to split the money between itself and Harris County Flood Control District (HCFCD) after allocating 13% for planning and administration.
CSD doesn’t intend to say exactly what areas will get how much for which projects until AFTER public comments.
Basically, CSD wants your comments on a high-level outline for dividing up the money. Below is what they recommend.
Less than half will go to HCFCD. AFTER approval tomorrow, the County will develop a list of projects for submission to the GLO. See last line in slide below.
CSD’s video discusses the criteria the county intends to use when developing a project list.
Input obtained prior to developing list.
It appears that Harris County wants all of the money to benefit low-to-moderate income, socially vulnerable neighborhoods…the same neighborhoods that have gotten the lion’s share of funding to date.
Sound familiar? Even though 50% of the $750 million can go to higher income areas, up to 100% could go to low-to-moderate income areas. And it looks like the county wants to go in that direction. Again.
Public Comments Close at 5 P.M. Tuesday
The only way to get your fair share is if enough members of the public demand a more even split. We don’t have enough money to finish the flood bond without spending all of the $750 million on flood mitigation. But CSD’s plan would give less than half to HCFCD.
We need the entire $750 million to fully fund the 2018 flood bond. Given the prevailing politics in Harris County these days, if any projects get cancelled for lack of funding, they will likely be those in middle- to higher-income neighborhoods.
Get Your Promised Share of the 2018 Flood Bond
So please protest any diversion of these funds away from flood mitigation.
By law, CSD must forward all comments received by Tuesday at 5 P.M. to the GLO and HUD for review.
So hurry. Email your comments NOW. It will only take five minutes.
Below is a sample letter with key points to make. Feel free to cut-and-paste or adapt.
Sample Letter
To whom it may concern:
I strongly protest the outline that Harris County Community Services presented to the GLO for the distribution of $750 million in HUD CDBG-MIT Harvey flood-mitigation funds.
Since adoption of Harris County’s Equity Prioritization Framework, the County has been funneling 2018 Flood Bond money and other local funds to projects in high LMI and SVI areas.
Now, however, without all of the $750 million going to flood mitigation, there likely won’t be enough money to finish all of the defined flood-bond projects that voters approved by 88% in 2018.
Therefore, I suggest:
The entire $750 million should go to Harris County Flood Control District to complete unfunded flood-mitigation projects in the bond.
Earmark half that money for projects in watersheds with more affluent residents (less than 50% LMI) who have been largely ignored until now.
Prioritize projects by:
The number of damaged structures during Harvey
Depth of flooding during Harvey
Remaining, unmitigated flood risk
Ability to reduce threats to infrastructure, such as bridges, schools, hospitals, and sewage treatment plants.
Lack of previous flood-mitigation investment in watershed
The County, GLO and HUD need to be fair to all people of Harris County as HUD’s rules allow. Half of the flood-mitigation funding in Harris County since 2000 has gone to just four watersheds (Brays, Greens, White Oak, and Sims). Other areas have needs, too.
CSD should present a detailed plan and stick to it. Vague generalities invite suspicion and undermine trust in government.
Ensure transparency. Harris County CSD has a poor record of transparency and website updates. Create a dashboard that publicly displays:
Encumbrances
Spending to date on every project
Who gets how much money, when, for what
Each project’s progress
Monthly updates
The MOD should include guarantees that the county will meet performance deadlines. Because of the 20 months already squandered since the County became aware of the $750 million, I question the county’s ability to spend the money by HUD’s deadline.
Thank you for considering these thoughts.
Don’t forget to add your contact information so Community Services can tell the General Land Office and HUD where the comment came from.
More Information
The GLO has emphasized the need for Harris County to act quickly. Flood Control has projects already defined that need money. HUD will take the money back if local authorities can’t spend the money within deadlines. So hurry. These projects take a long time. HCFCD has already defined projects in the flood bond. We can’t afford the time to start from scratch to figure out the distribution of $750 million in HUD Flood-Mitigation funds.
For more supporting information, including charts and graphs that you can use to create a custom letter, click here.
Posted by Bob Rehak on 2/20/23
2001 Days since Hurricane Harvey
The thoughts expressed in this post represent opinions on matters of public concern and safety. They are protected by the First Amendment of the US Constitution and the Anti-SLAPP Statute of the Great State of Texas.
https://i0.wp.com/reduceflooding.com/wp-content/uploads/2023/02/Screenshot-2023-02-20-at-3.14.11-PM.png?fit=1440%2C924&ssl=19241440adminadmin2023-02-20 18:21:292023-02-22 05:34:37Last Chance to Comment on Distribution of $750 Million in HUD Flood-Mitigation Funds
A Harris County Flood Control District (HCFCD) year-end spending report shows a continuing bond slowdown. The most recent spending update to Commissioners Court reflects all activity through the end of 2022.
The big news to report is that there’s not much news to report.
The December update showed that the San Jacinto Watershed received only $76.6 thousand during the month, ranking it 15th among all Harris County watersheds. HCFCD has only spent 2.5% of all bond money spent to date in the entire county.
A separate Biannual Update shows that the paltry progress is NOT the result of available funds. The San Jacinto has about $167 million in committed funding, but has received less than $30 million from the bond so far.
But before we dig deeper into the San Jacinto, let’s look at the continuing bond slowdown in HarrisCounty as a whole.
Has spent a total of $1.177 billion to date, up from $1.150 billion at the end of November, a $27 million increase.
Bought out 27 homes countywide.
Secured another $30 million in funding ($1.734 billion up from $1.704).
Saw no change budgeted active capital construction projects ($0.00, likely a reporting mistake).
Saw no change in budgeted active maintenance projects ($0.00, likely another reporting mistake).
Awarded just one construction project worth $7 million.
Saw its schedule performance index dip below 1.0 for 11 months in a row. (1.0 means on-schedule).
Completed another 0.3% of the bond, bringing the percent completed up to 24.1% with 43.3% of the time elapsed.
Still has NO active construction projects in the lone Republican-led precinct. All 18 are split among three precincts with Democratic commissioners.
Reporting Mistakes
Regarding those goose eggs under “active projects,” it appears that someone just picked up the active projects pages from November and changed the dates to December. However, the HCFCD website does show figures updated through January 2, 2023. Using those as the most current figures instead would mean:
The total budgeted for active maintenance projects FELL from $50.6 million to $37.2 million, a decrease of $13.4 million.
Likewise, the total budgeted for active capital improvement construction projects FELL from $239.8 million to $223.5 million, a decrease of $16.3 million.
I’m not sure which is worse. Zeros, decreases, or errors?
Continuing, Prolonged Slowdown
Another major concern is the continuing lag in the Schedule Performance Index (SPI). This is a measure of on-schedule performance. Temporary decreases can often happen between projects. However, HCFCD has fallen behind schedule and stayed behind for 11 months in a row. The last time it reported an SPI of 1.0 was in January of 2022.
At the current rate of spending, it will take HCFCD more than 20 years to finish the bond.
Slow performance means we all live with flood risk longer than necessary and pay higher flood-insurance premiums than necessary.
For all of last year, HCFCD averaged between $20 and $23 million per month in spending.
Compiled from HCFCD monthly updates.
Under previous leadership, HCFCD averaged $35 million per month and the rate was climbing, not falling.
Spending By Watershed During December
The table below shows spending in all 23 Harris County watersheds plus countywide spending for the month of December 2022 (in the “Difference” column). HCFCD reported a decrease in Countywide spending with no explanation. The District also shows NO spending at all in three watersheds.
Compiled from HCFCD Bond Updates from November and December of 2022.
The San Jacinto Watershed is the county’s largest. Floods have damaged more structures in the San Jacinto than in all but seven other watersheds. The damage total includes five major storms since 2000 – Allison, Tax Day, Memorial Day, Harvey, Imelda.
Yet the San Jacinto has received only 2.5% of total flood-bond spending through 2022, ranking it #15 on that scale.
To date the San Jacinto has received only 13% of the $223,256,195 allocated to it in the bond. Compare that to 79% for the Brays Watershed and 75% for the Greens.
Commissioners Court Agenda Also Shows Slowdown
HCFCD has only 11 items on the Commissioners Court agenda for Tuesday, February 21. Contrast that with engineering which has 108.
And few of HCFCD’s requests involved new flood-mitigation work.
Four items transitioned projects to HCFCD’s maintenance program.
Four items involved contract changes.
One involved a permit for a MUD doing environmental enhancement work.
One would let Pasadena build recreational facilities on HCFCD property.
One would reimburse Union Pacific for a preliminary engineering study that UP was doing to relieve repetitive flooding along Halls Bayou adjacent to its railroad tracks.
Bi-Annual Bond Update
For additional information on the progress of the bond, see this Bi-Annual Update issued by HCFCD in January. It contains dozens of spending breakdowns. Especially interesting are the funding-gap calculations on page 11. See table below.
Note that the table above shows different “actual spending to date” figures than the monthly updates farther above.
Regardless, these figures show that lack of funding is NOT responsible for the slow progress in the San Jacinto Watershed. The San Jacinto has $167 million dollars in committed funding. We’re just not spending the money.
The thoughts expressed in this post represent opinions on matters of public concern and safety. They are protected by the First Amendment of the US Constitution and the Anti-SLAPP Statute of the Great State of Texas.
https://i0.wp.com/reduceflooding.com/wp-content/uploads/2023/02/SpendingByWS-thru-22.12.31.png?fit=1114%2C1146&ssl=111461114adminadmin2023-02-19 22:18:222023-02-22 05:33:11HCFCD Updates Show Continuing Bond Slowdown
The intended audience is for state and local officials. But don’t let that scare you. This brochure can also help home- and business owners think about their options, the pros/cons of each, their relative costs, and suitability for a particular location.
The first part of the 198-page document deals with how to use something called FEMA’s National Tool. It collects information from a variety of different sources. Planners use the data to create a “scorecard” that helps rank the alternatives.
Flood-Mitigation Alternatives Discussed
The major types of alternatives discussed in the brochure include:
Drainage Improvements
Barriers
Wet Floodproofing
Dry Floodproofing
Elevation
Relocation
Acquisition (Buyouts)
Helpful Screening Questions
Chapter 3 contains a variety of screening questions designed to help determine the “fit” of each option for a particular location. For instance, to name a few, “What is the…”
Structure type
Condition of the structure
Foundation type
Number of stories
Building footprint
Example of Material in Typical Chapter
The meat of the discussion starts after that. The document contains a chapter on each of the seven major options and sub-options within them.
At a minimum, these chapters explain how flood professionals are trained to evaluate options and make recommendations in your situation.
While FEMA’s text is aimed at professionals, it’s well written, clear, and easy to understand. I won’t elaborate on each chapter, but will give you an example – Chapter 5: Barriers.
Levees and walls, two of many barriers against flooding discussed in Chapter 5.
Other sub-options include berms and temporary barriers (inflatable, floatable, and water filled).
Advantages:
They keep floodwaters out of the house and prevent flood damage
They require no significant changes to structures.
Disadvantages:
Barriers may not bring a substantially damaged structure into compliance with local floodplain management ordinances
Cost may be prohibitive
Large area needed for construction
Need for maintenance
Can affect local drainage, making flooding worse for others.
Whether they’re suitable in your situation will depend on:
The depth of flooding
Height of the barrier needed
Local building codes
Type of foundation (i.e., these don’t work well with basements)
Soil conditions (load-bearing capacity and permeability)
Duration of floods
Costs
Requirements for human intervention
Annual maintenance
Access to structure during normal times
Escape from structure if barrier is overtopped during an extreme event
Interior drainage (what happens if water starts filling in behind the barrier)
The brochure contains lucid and thought provoking discussions on each of these issues. If you start exploring such barriers, this brochure will help you plan discussions with contractors.
Highly Recommended
And so it goes for each of the other major types of mitigation found in other chapters. This is a valuable resource for anyone considering a major investment. It won’t help you make a final decision. But it will help you make a more intelligent decision.
So if you’re trying to find the best option to mitigate floodprone structures, click here.
Posted by Bob Rehak on 2/18/2023
1999 Days since Hurricane Harvey
https://i0.wp.com/reduceflooding.com/wp-content/uploads/2023/02/Screenshot-2023-02-18-at-12.34.27-PM.png?fit=1148%2C560&ssl=15601148adminadmin2023-02-18 14:04:202023-02-18 14:22:06How to Find the Best Option to Mitigate Floodprone Structures