It won’t be long now before we start seeing moving trucks at the Preserve at Woodridge. The new high-density, low-grass, pet-friendly, community of 131 free-standing rental homes has reached a milestone. The entire development is framed out. See the pictures below.
Photos Taken on January 29, 2023
Looking SE toward Kingwood Park High School from over St. Martha Catholic Church parking lot.Last homes under construction on the SW corner of the new subdivision.Looking toward the west from over the detention pond gives you a feeling for how close together these homes are.65% impervious cover according to the RG Miller plans.The pearlescent, allegedly “grass lined” stormwater detention basin seems to still leak silty stormwater into this tributary of Ben’s Branch.
Who is the Market For These Homes?
It will be interesting to see what types of tenants this subdivision attracts. The website shows a picture of young adults by a pool. These homes might represent a step up from apartments for some of them.
But none of the website’s pictures feature empty-nesters who might be looking to downsize. The long walks between cars and front doors could make it difficult to get all those groceries into the kitchen.
And the small amount of parking could deter families with more than one car.
Glad it’s not my money at risk. But maybe they’ve identified a new market niche.
The biggest complaints I hear are that these homes don’t fit the character of the surrounding community. People worry about negative impacts on their property values.
I have also heard firefighters express safety concerns about the proximity of the homes.
Regardless of how you feel, it’s too late to do anything about these now.
History of Project
To see the progression of this project, see the following posts:
The thoughts expressed in this post represent opinions on matters of public concern and safety. They are protected by the First Amendment of the US Constitution and the Anti-SLAPP Statute of the Great State of Texas.
https://i0.wp.com/reduceflooding.com/wp-content/uploads/2023/02/20230129-DJI_0830.jpg?fit=1200%2C799&ssl=17991200adminadmin2023-02-03 17:07:162023-02-03 17:14:01Preserve At Woodridge All Framed Out
Correction: Since publishing this, Precinct 3 Commissioner Tom Ramsey contacted me to say that the discrepancy is not as bad as this article makes it look. He believes the percentages described below will be applied in a different order resulting in different outcomes. However, he could not provide final totals, saying that the SVI percentages were still being examined.Finally, he emphasized that the money Precinct 3 does get will be put to good use.He also emphasized the need to incorporate miles of roadway in each precinct into the allocation formula. Commissioner Garcia has not responded to my invitation to supply his point of view.
Original Article as First Published
To sell the controversial $1.1 Billion Road and Parks bond in 2022, Democrats on Harris County Commissioners Court passed a resolution promising voters that each precinct would get at least $220 million. The $220 million minimum was promoted to voters on the web, in the press, at community meetings, and in handouts and flyers county-wide for three months prior to the November election. For example…
Dems adopted an allocation plan that gives Republican-led Precinct 3 only $173 million – almost $50 million less than the promised $220 million.
Commissioner Adrian Garcia introduced his complicated allocation scheme in a five-part motion. He never did reveal the totals although he did admit that not every precinct received the minimum. Because he bases his scheme on the CDC’s social vulnerability index, not miles of roads that need to be maintained, Precinct 3 will get less money in total and less than one-fifth the dollars per “lane mile” compared to Garcia’s Precinct 2.
Who Gets How Much
Garcia never revealed totals for each precinct. To learn who gets how much, you have to calculate the totals yourself using a vague procedure Garcia verbally outlined during commissioners court on 1/31/23. It’s a confusing, multi-part formula that requires calculating percentages of percentages of percentages of figures found in different documents. Only after adding totals from three different subcategories does the ugly truth became apparent.
Harris County Engineering gets 10% or $110 million.
Each precinct then gets a flat baseline amount equal to 63.64% of the remainder.
Each precinct also gets an amount that varies based on the number of “socially vulnerable” residents from the remaining 26.36%.
SVI percentages vary widely. And they radically skew the final totals. Here’s how the math works out.
Precinct
Baseline Amt.
SVI %
Total Each Precinct
P1
$157,509,000
$117,446,067
$274,955,067
P2
$157,509,000
$147,186,806
$304,695,806
P3
$157,509,000
$15,645,510
$173,154,510
P4
$157,509,000
$79,690,617
$237,199,617
Calculations based on Garcia’s description of formula in meeting and the SVI numbers he supplied
The final totals could vary slightly if you applied the percentages in a different order. But any way you cut it, P3 still gets far less that the minimum guarantee and $50 – $100 million less than Democratic precincts..
This PDF explains what the 10% for Engineering covers and lists SVI populations in each precinct. SVI stands for the CDC’s Social Vulnerability Index. However, Garcia does not list a source or date for the SVI numbers, so we have to take his word for their accuracy.
Now, remember, this is primarily a road bond. So, let’s also look at how this allocation translates into dollars per lane mile.
Precinct
Lane Miles
Allocation
$/Mile
P1
2100
$274,955,067
$130,931
P2
2230
$304,695,806
$136,634
P3
6750
$173,154,510
$25,652
P4
3120
$237,199,617
$76,025
Lane miles supplied by Harris County Precinct 3 staff
Precinct 3 has 2-3X the lane miles compared to other precincts. Yet it gets the smallest allocation. Compared to Garcia’s Precinct 2…
Precinct 3 gets less than one-fifth the dollars per lane mile. This is no accident.
During the hotly contested redistricting process in 2021, Democrats gave Ramsey the lion’s share of unincorporated Harris County to maintain. Now, the final shoe drops. They denied him the ability to maintain those roads.
What Do YOU Call It?
Is this a political vendetta? Voter fraud? Financial fraud? Theft of services? A bald-faced lie? Business as usual in Harris County Commissioners Court? Or all of the above? You could build a case for “all of the above.” In my opinion:
If this were the prospectus for a new stock offering, the Securities and Exchange Commission would likely launch an investigation.
If it were an advertisement, the Federal Trade Commission could level hefty “bait-and-switch” fines.
If you told someone you were going to provide $50 million worth of services and then didn’t, but still took their money, the Texas Attorney General could build a felony case for theft of services.
Right now, the New York attorney general is suing a former U.S. President for making misleading financial statements.
No Transparency
Before the vote on the bond in November, Garcia could have offered up his allocation formula. But he didn’t do that.
And before the vote on the allocation formula Tuesday, Garcia could have easily said, “Here’s what each Precinct will get.” But he didn’t do that either. As with the Flood Bond and the Equity Prioritization Framework, this is another example of changing the deal after voters vote.
That’s why, in my opinion, this is deliberate concealment with intent to defraud taxpayers.
Garcia replied, “No.”Then, instead of explaining, he obfuscates. He quickly launches into a description of how the formula incorporates socially vulnerable populations. Garcia never does say what the totals are.
Ellis responds, “I’m fine with that.” And Hidalgo never circles back to ask what Garcia meant by “No.”
Despite Precinct 3 Commissioner Ramsey’s reservations and his plea for more time to study the impact of the proposal, the Dems approved Garcia’s allocation formula on the spot. This was carefully rehearsed.
Garcia also revealed other screening criteria for project consideration. Just in case you thought a project benefitting you might squeak through, the eligibility criteria involve factors such as:
Encouraged by a 4:1 majority on commissioners court, Democrats have become brazen. Tuesday’s revelation concerning the 2022 bond was one of many.
Commissioners still didn’t take any action on the $750 million in HUD funds that have been sitting on the table for a year and nine months.
That $750 million – with the flood resilience trust – could pay for every unfunded project in the 2018 flood bond. But instead of asking why Community Services has not prepared a detailed plan that HUD could approve, Commissioners allocated $64 million from local Toll Road funds to keep flood projects moving in Democratic precincts.
I suspect Dems want to cancel Flood-Bond projects in Precinct 3 and then blame the cancellations on a Republican-led GLO, which administers HUD funds in Texas.
That could push independents toward the blue column…at least those not paying close attention.
Lingering Concerns
The concerns outlined above are serious. But those aren’t the only concerns. Readers have written asking:
1) Will there be transparency for this bond like we had for the flood bond? Or will this turn into another give away to campaign donors?
2) How were the SVI numbers calculated? Are they available for review? How can we trust those numbers?
3) What other large public agency divides infrastructure money by SVI? Prove that it is a “best practice” and not a way to game the system to get more money in Precinct 2.
4) This is clearly political punishment for Precinct 3 that puts Republican lives at risk. Is this the example that Harris County “leadership” wants to set for future generations?
Garcia addressed none of those issues. Only one thing is clear. Last Tuesday was a tipping point in the history of Harris County.
If Commissioner Garcia wishes to write a rebuttal, I will post it.
Posted by Bob Rehak on 2/2/2023
1983 Days since Hurricane Harvey
The thoughts expressed in this post represent opinions on matters of public concern and safety. They are protected by the First Amendment of the US Constitution and the Anti-SLAPP Statute of the Great State of Texas.
https://i0.wp.com/reduceflooding.com/wp-content/uploads/2023/02/Flier.jpg?fit=1511%2C544&ssl=15441511adminadmin2023-02-02 11:42:582024-09-18 07:15:14Dems Shortchange Precinct 3 by Almost $50 Million in 2022 Bond Allocation
As of January 30, 2023, Sprint Sand and Clay had excavated 80,360 Cubic Yards of dirt from a sixth Woodridge Village stormwater detention basin under an Excavation and Removal Contract with Harris County Flood Control District. Even though the new basin is not yet complete, it is already the second largest on the site.
Sprint’s $1,000 contract gives it the right to excavate up to 500,000 cubic yards and sell the dirt at market rates to make its money back. The purpose: to get a head start on construction of another basin that could eventually double Woodridge Village stormwater detention capacity so that it will exceed Atlas-14 requirements and create a safety margin to accommodate future development.
Reason for Project
Perry Homes sold the failed development to Harris County Flood Control District in 2021 after it contributed to the flooding of hundreds of homes in Elm Grove and North Kingwood Forest twice in 2019.
Excavation began in early 2022. By the end of that year, Sprint had removed 73,745 cubic yards of soil. January’s total means Sprint is about one-sixth of the way toward its goal.
The basin already holds a considerable amount of runoff as the pictures below show. The pictures were taken on 1/24/23 after a five-year rain (3.6 inches in two hours). That’s about half the volume that fell on May 7, 2019 when Woodridge Village first flooded Elm Grove and North Kingwood Forest. But at that time, only the long narrow detention basin on the lower right had been completed.
Looking NE across the main part of Woodridge.Basin in foreground is the one under construction. Reverse angle, looking SWtoward Woodland Hills Drive and Kingwood Park High School.
New Excavation Already Second Largest on Site
80,360 cubic yards equals 49.8 acre feet. Woodridge Village’s five original basins had the following capacity:
N1 = 13.2 acre feet
N2 = 154.7 acre feet
N3 = 42 acre feet
S1 = 18.6 acre feet
S2 = 42.5 acre feet
That means the new basin already ranks as the second largest on the Woodridge Village site.
Only N2 has more capacity at the present.But eventually, the new basin could double its size.All basins will eventually converge into the basin in left foreground above. From there, water exits into Taylor Gully.Despite the 5-year rain that fell only hours before these photos, Taylor Gully never came close to overflowing on January 24th because of the controlled release rate.
More capacity will mean the site can safely handle much larger rainfalls.
Current detention pond capacity equals 271 acre feet. When complete, the new basin will add 309 acre feet, more than doubling the site’s stormwater detention capacity.
Next up: final design of the improvements before construction can begin.
Posted by Bob Rehak on 1/31/23
1981 Days since Hurricane Harvey and 1230 since TS Imelda
The thoughts expressed in this post represent opinions on matters of public concern and safety. They are protected by the First Amendment of the US Constitution and the Anti-SLAPP Statute of the Great State of Texas.
https://i0.wp.com/reduceflooding.com/wp-content/uploads/2023/01/20230124-DJI_0770.jpg?fit=1200%2C799&ssl=17991200adminadmin2023-01-31 12:48:072023-01-31 12:56:39New Woodridge Village Detention Basin Already 2nd Largest
Surprisingly heavy rains in the last week of January 2023 have led to floodwater rising on area streams. As of 1:38 PM on Monday 1/30/23, the National Weather Service predicted minor flooding throughout much of the northern part of the Houston region, including:
East Fork San Jacinto near New Caney affecting Montgomery, Liberty and Harris Counties.
Peach Creek at Splendora affecting Montgomery and Harris Counties.
West Fork San Jacinto near Humble affecting Montgomery and Harris Counties.
Cypress Creek at Katy-Hockley Road affecting Waller and Harris Counties.
Menard Creek near Rye affecting Hardin, Polk and Liberty Counties.
One on Top of Another
Jeff Lindner, Harris County Meteorologist, said, “While response on area watersheds in the northern portions of Harris County may seem significant for the amount of rain Sunday, when you combine rainfall from Tuesday and Sunday, totals of 8-11 inches are found over this area. The rainfall combined with saturated soils explain the significant rises on area streams.”
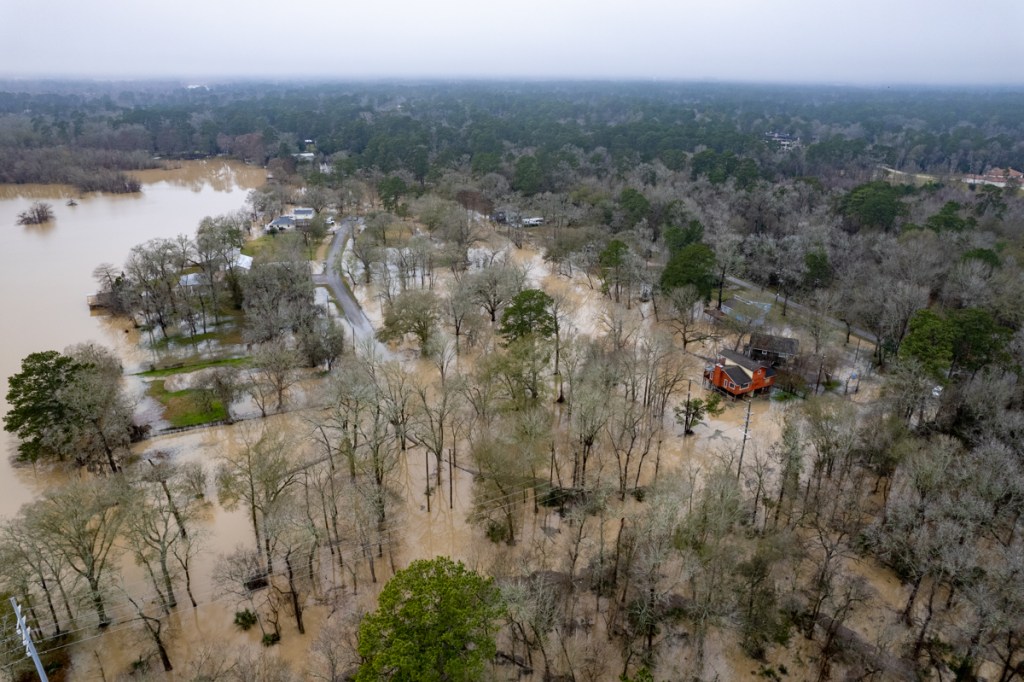
Here’s what all that rain looked like on the ground in the Humble/Kingwood Area last night and this morning.
Parked in wrong place. West Hamblen Road near West Fork.Townsen Landing development in Humble near Target in upper left.Saratoga Homes plans to build 357 singl- family homes here.Single- and multi-family residential, some of which will be dedicated to seniors on Townsen Blvd. West in Humble.US59 South at West Fork. Underpass closed due to high water.Looking N toward Lakeside Court and Treasure Lane between West Fork (left) and 59 (right). Confluence of Spring Creek and West Fork just west of US59. Note distinctly different color of water coming from the West Fork (right) where we have 20 square miles of sand mines between 59 and 45.Forest Cove Drive just north of West ForkLake Point Drive in North ShoreContractors are expanding the permanent detention basin at the new Kingwood Middle School.
It looks like we’re beginning to see the outlines of a football field and running track at KMS. That’s the one bright spot in all of these bleak shots. And to think, a few months ago, we were worried about drought.
“Plays Well With Others”
Remember that box on kindergarten report cards – “Plays Well with Others”? These last few photos dramatize the need for developers and their contractors to play by the rules. Most do. But some don’t. These last few shots show how to make a bad situation worse.
New Royal Pines development draining into storm sewer. Note water pouring over storm fence and directly into drain without filtration. A big no no. Violates stormwater regulations and could plug up storm sewers eventually.NW corner of Royal Pines floods neighbor in upper right.They installed silt fence last week. But unchecked runoff pushed it over the fence. See photo below.
Contractors sloped the land toward a neighbor’s property and have yet to build detention ponds. They have flooded the neighbor four times now in two months and have not done anything to correct the problem…at least nothing that has worked.
Same area but about several hours earlier. Weight of water pushed over silt fence.Eastern portion of Royal Pines doesn’t even have silt fence between it and White Oak Creek.Another part of Royal Pines eastern perimeter. More erosion heading toward White Oak Creek and the East Fork.Preserve at Woodridge Detention basin is supposed to be grass lined, but instead is pouring silt into a tributary of Bens Branch which HCFCD just cleaned out.
Ain’t Over Yet
January, February and March are normally our three driest months. But not this year. It looks like we will get 2-3X the normal monthly total.
National Weather Service Climate Data for Houston
Ten to 11 inches in 7 days qualifies as a five-year rainfall by Atlas-14 standards.
NOAA Precipitation frequency estimates
And more rain is on the way. NWS predicts heavy rain arriving from the north on Wednesday. They also warn of flash flooding.
If you have pictures of flooding that you would like to share, please use the Submissions Page of this website. Make sure to include the time, date, and location of the photo and how you would like the credit line to read.
Posted by Bob Rehak on 1/30/2023
1980 Days since Hurricane Harvey
https://i0.wp.com/reduceflooding.com/wp-content/uploads/2023/01/20230130-DJI_0930.jpg?fit=1200%2C799&ssl=17991200adminadmin2023-01-30 18:25:362023-02-02 17:52:12Floodwater Rising and More Rain On the Way
Recent heavy rains and high-density upstream development on Ben’s Branch in Montgomery County have increasingly placed pressure on the aging Ben’s Branch Bridge over Tree Lane. The bridge is immediately adjacent to Bear Branch Elementary School in Kingwood and its 638 students.
5-Year Rain Leaves Bridge Worse Than Before Repairs
I took the photo below on 1/24/23 when Kingwood experienced a five year rain according to the gage at US59.
Photo taken on 1/24/2023 after 3.6 inches of rain in 2 hours.
I went back today to see what it looked like after the water went down.
After another 1.5 inch rain on 1/29/23.Note how the concrete fragment is pinching off street drainage for Bear Branch Village.
The issue, in my opinion, has to do with more and more water jetting through the narrow opening of the bridge. The turbulence has undermined concrete armoring on the banks that protects bridge supports. It has also carved out a huge area in the stream just south of the bridge.
Photo taken on Tuesday 1/24/23as jetting erodes area south of bridge.
The detention pond above on Ben’s Branch had its outlet wall blown out during Harvey 5.5 years ago and has not been fixed since.
An aging bridge. More water coming downstream. Insufficient mitigation. Eroding banks. 638 children. A perfect storm, so to speak. Let’s hope the City can expedite the repairs.
You encourage what you tolerate.
It’s time for people to speak up.
Posted by Bob Rehak on 1/29/23
1979 Days since Hurricane Harvey
The thoughts expressed in this post represent opinions on matters of public concern and safety. They are protected by the First Amendment of the US Constitution and the Anti-SLAPP Statute of the Great State of Texas.
https://i0.wp.com/reduceflooding.com/wp-content/uploads/2023/01/20230129-RJR_1136.jpg?fit=1200%2C800&ssl=18001200adminadmin2023-01-29 19:48:162023-01-29 19:52:54Tree Lane Bridge over Ben’s Branch Damaged…Again
Harris County Community Services Department (CSD) has finally shared a high-level summary of how it would spend $750 million in Hurricane Harvey Flood Mitigation Funds from the U.S. Department of Housing and Urban Development (HUD). The plan, called a Method of Delivery (MOD), was submitted to the Texas General Land Office (GLO) in December for preliminary approval, but returned to the county in January for tweaks to make it HUD-compliant.
CSD’s presentation is informational; the Department is not yet seeking approval from Commissioner’s Court. But this will be the public’s first peak at CSD’s direction.
While the presentation predictably emphasizes support for low-to-moderate income and socially vulnerable groups, it also contains some surprises. For instance, it mentions supporting activist groups, but fails to mention protecting bridges, hospitals and schools.
Damage to I-69 bridge disrupted areas to the north for 11 months after Harvey.Harvey flooded 6 of 9 buildings at Lone Star College/Kingwood. Repairs cost $60 million and disrupted classes for more than a year.
Long-Awaited
George P. Bush, former GLO Commissioner, requested a $750 million allocation for Harris County from HUD in May of 2021. HUD formally approved that amount in March of 2022. But Harris County Commissioner’s Court didn’t approve the grant agreement until August 31, 2022. And CSD didn’t submit its plan to the GLO for review until late December 2022.
The CSD plan reflects both HUD’s mission and the requirements spelled out in the State’s Action Plan. However, the GLO required CSD to make some tweaks to the initial plan to make it HUD compliant. During the tweaking process, Commissioners replaced CSD Director Dr. Adrienne Holloway with a new Interim Director, Thao Costis, the department’s SIXTH leader under County Judge Lina Hidalgo in four years. Costis previously led a non-profit group in Houston that provided services to homeless people.
“These funds intend to mitigate and build resiliency against flood risks in the region.”
Harris County Community Services Department
The Department claims it conducted ample data analysis and public input on the MOD. It says constituents lobbied for prioritizing “(1) low- and moderate-income population, (2) social vulnerability, (3) total population, and (4) National Flood Insurance Program repetitive loss properties.”
However, the presentation does not specify whether:
Repetitive losses will be weighed against previous mitigation investments. Will an area that once had high repetitive losses, but which already received hundreds of millions of mitigation dollars, still be prioritized over other areas that have received no flood-mitigation money?
Severity of flooding will be considered. Will one inch of flooding in a low-income home count for more than ten feet of flooding in a middle-income home?
Threats to infrastructure will be addressed. For instance, the loss of interstate highway bridges, hospitals and schools.
There’s no measure of “current risk,” nothing that addresses “threats to life,” and nothing that balances impacts to the community vs. impacts to individuals…at least in the summary that CSD is now sharing.
Plagued by “Vague”
CSD claims it prioritizes flood control and drainage improvements, natural or green infrastructure, water and sewer facilities, provision of generators, buyouts, and planning activities. I say “claims” because CSD did not provide a list of projects with the presentation. Nor did it provide a matrix for scoring projects.
The CSD presentation also referenced 2018-Flood-Bond Projects. But it’s not clear at this time if a potential project list goes beyond Hazard-Mitigation-Action-Plan Projects and Flood-Bond Projects … or even if there is a list. Nor does the presentation hint at which Haz Mit and Bond Projects would be included.
Finally, the summary makes no mention of any effort to ensure transparency and accountability. The public deserves to know where its money goes!
CSD says it would administer the $750 million grant and work with Harris County Flood Control District to “reduce flood risk and increase resiliency to future natural disasters for Harris County’s nearly 5 million residents.”
But we still don’t know who will get how much for what. Nor do we know what the expected benefits will be.
Partnerships
Though only Harris County and the Flood Control District are eligible to receive HUD’s $750 million, CSD states it will partner with other entities, including cities, within Harris County, that have “shovel-ready” flood mitigation projects. “Additionally, Harris County could sign [emphasis added] a Memorandum of Understanding with the Flood Control District to increase the amount of funding devoted to the 2018 Flood Control Bond,” says CSD. In other words, the County might send some of its share to HCFCD. But there’s no guarantee.
The CSD presentation shows that Harris County Flood Control will get only $326.25 million from the $750 million. The rest will go to Harris County. Out of the other $423.75 million, the county plans to spend $97.5 million on administration and planning. That would leave both Flood Control and Harris County with $326.25 million for actual mitigation work.
Word on the street in the engineering community is that the Harris County Engineer’s Office will handle the County’s portion of the money. Adrian Garcia appointees lead the Engineering Department and that would help Garcia influence where the money goes.
Inconsistencies, Typos Raise Questions
CSD’s presentation boils over with contradictions and typos that don’t speak well for “attention to detail” in a grant where $750 million is at stake. For instance, the plan says:
Projects will help the county’s entire population, but it prioritizes projects in low- and moderate-income, socially vulnerable areas.
CSD needs a 3-year extension … for shovel-ready projects.
The County will partner with other entities within Harris County, but cities and towns get $0.
I can’t wait to hear the explanations…especially how the money will help neighborhoods outside the Beltway given inside-the-Beltway priorities.
Nor can I wait to hear whether the cities in Harris County rebel against a plan that seemingly guarantees them nothing.
The presentation literally underscores CSD’s priorities:
“Once the MOD is approved by GLO, Harris County MOD entities reserve the right to partner with local governmental entities and special districts in the county to perform eligible projects, including but not limited to cities and Flood Control District. Harris County may also partner with local non-profit agency [sic] regarding public service activities that support mitigation and resiliency, particularly in areas were [sic] drainage or other mitigation activities are affecting low-to-moderate income households [sic] stability.”
Yikes! Three typos in one sentence!
Next Steps
This presentation only informs Commissioner’s Court and the Public about the grant’s status. CSD will not ask for approval of any projects on Tuesday. That will come later. The next steps include:
Public comments
Determining how to partner with other entities (Still, after almost 2 years)
Preparation of final MOD that incorporates public comments and responses
Approval of final MOD by County Commissioners (2/21/23)
GLO review and approval (March/April)
After GLO approval:
“Call for information of projects” (whatever that is)
Submit project packets to Commissioners Court
Submit project packets to GLO
Start projects (Fall 2023) six years after Hurricane Harvey!
Commissioner’s Court begins at 10AM on Tuesday. If you wish to make a public comment, here’s how to sign up to speak.
Posted by Bob Rehak on 1/28/2023
1978 Days since Hurricane Harvey
The thoughts expressed in this post represent opinions on matters of public concern and safety. They are protected by the First Amendment of the US Constitution and the Anti-SLAPP Statute of the Great State of Texas.
https://i0.wp.com/reduceflooding.com/wp-content/uploads/2018/08/Flooded-Sign.jpg?fit=936%2C590&ssl=1590936adminadmin2023-01-28 20:07:262023-02-20 12:41:00County Outlines Plan for $750 Million in Flood-Mitigation Funds
According to Harris County Flood Control District’s (HCFCD) latest flood-bond update, 19 of 19 active capital improvement construction projects are now in Democratic precincts (1, 2 and 4). None is in the County’s lone Republican-led Precinct 3, the county’s largest.
Moreover, the update also shows that the San Jacinto watershed now has NO active maintenance OR construction projects.
Latest Update Restates Numbers for 12 Months Ending 11/22
Every month, Harris County Flood Control District issues an update on 2018 Flood-Bond projects. The updates typically cover:
Newsworthy items from the previous month
Performance metrics
A master schedule of all projects
Funding and spending to date by watershed
Active Maintenance Projects
Active Construction Projects.
This month, the update also includes restated figures for 2022 reports. The last page corrects several figures in previous monthly reports. Some of the reports contained incorrect figures related to confusing labels.
The corrected figures show that from December 2021 through November 2022 (the last month covered in this report), HCFCD:
Awarded 7 constructsruction contracts valued at a total of $60 million.
Awarded 91 other agreements for things, such as engineering studies and design, valued at a total of $140 million
Spent a total of $1.151 billion on all bond projects since 2018. That includes:
$602 million of bond funds
$392 million in grants
$157 million of other local funds
Completed 24.1% of the bond projects in 44% of the time allotted.
Gives itself a schedule performance index of .95
Completed 913 buyouts for $174 million total (Average = $190,000 each)
No Active Construction Projects Shown in P3
Under Active Capital Improvement Construction Projects, HCFCD shows none (zero, nada, zilch, bupkis, diddly-squat, zip, i.e., nothing at all) in Precinct 3, the county’s largest precinct and one of the most heavily flood damaged.
Note absence of active construction projects in Precinct 3 (pink), the county’s largest. All active construction projects are now in the three Democratic precincts.
However, elsewhere on the Commissioner’s Court agenda for Tuesday, Rodney Ellis is asking for $2.66 million for hike-and-bike trails around Willow Water Hole on South Post Oak in his Precinct 2. See Item 303. Precinct 2 Commissioner Ellis is reportedly an avid bicyclist. He lives near there.
No Active Construction OR Maintenance Projects in San Jacinto Watershed
Also, the update shows NO active construction or maintenance projects anywhere in the San Jacinto Watershed, the county’s largest and one of the most heavily flood damaged.
Updated Spending Totals by Watershed
Here are the latest spending totals by watershed per the update.
Spending by watershed through November 22
In tabular format, they stack up like this:
Totals by watershed from inception of bond through end of November, 2022.
Posted by Bob Rehak on 1/27/23 based on the November 2022 HCFCD Bond Update
1978 Days since Hurricane Harvey
https://i0.wp.com/reduceflooding.com/wp-content/uploads/2023/01/Screenshot-2023-01-27-at-8.48.56-PM.png?fit=1910%2C1240&ssl=112401910adminadmin2023-01-27 21:34:392023-01-28 18:00:15All Active HCFCD Construction Projects Now in Democratic Precincts
The dangers of street flooding can be costly. We’ve all read about people who drown while driving through flooded underpasses. But other dangers exist, too. Costly ones.
On Tuesday 1/24/23, the Lake Houston Area received a 5-year rain. Streets flooded throughout the area because storm sewers are generally designed to carry 1- to 2-year rains.
So, water backed up into streets. When cars and trucks tried to plow through the ponding water, they set up waves that slapped against people’s homes. This video dramatically shows what those waves can do.
And when the ponding water rises over the level of your tailpipe, it will choke your engine and stall your car. It can also flood the interior and ruin your electronics.
It’s impossible to tell the depth of water accurately in these situations.
Progressive Insurance lists common problems with flood-damaged cars. Flooded vehicles can easily turn into total losses. “Flooded cars are often declared a total loss because repairing water damage is complicated and costly,” they say. “A total loss means the insurance company has determined that the damage cannot be repaired safely, or the cost to repair the vehicle is more than the value of the car.”
So, your best bet is to stay home and watch Wheel-of-Fortune reruns until the water recedes.
The roads cleared about an hour after the homeowner took these photos. The dangers of street flooding disappeared down the storm drains.
Diagnosing Street Flooding Problems
If your street flooded and the streets around you didn’t, you may want to call authorities and have them see if your storm sewers are blocked.
You might also be interested in seeing if the storm drain inlets are located at the lowest points on your block. Here’s how to check the elevations.
Finally, examine the storm drain inlets and make sure you have sufficient drainage. There are many different sizes and types.
Posted by Bob Rehak on 1/26/23
1976 Days after Hurricane Harvey
https://i0.wp.com/reduceflooding.com/wp-content/uploads/2023/01/20230126-Screenshot-2023-01-26-at-7.39.55-AM.jpg?fit=1200%2C614&ssl=16141200adminadmin2023-01-26 08:29:522023-01-27 12:26:43Dangers of Street Flooding
Between 1:00 and 3:00 PM on 1/24/23, approximately 3.6 inches of rain fell over Royal Pines in southeast Montgomery County. According to Atlas-14 rainfall tables, that qualifies as a 5-year rainfall event. But floodwaters from White Oak creek approached the edge of the 100-year floodplain. And missing silt fences let sediment escape into the wetlands that border the property.
5-Year Rain
A friend who lives a mile from Royal Pines recorded about 4″ on his rain gage for the full day. A check of nearby rain gages on the Harris County Flood Warning System, showed that the official gage at FM1485 and the San Jacinto East Fork recorded approximately 3.6 inches between 1 and 3 PM today.
Harris County Flood Warning System hyetograph shows approximately 3.6 inches fell in two hours on 1/24/23.
Cross-referencing that rate with NOAA’s Atlas-14 rainfall probability estimates for this area, we can see that 3.6 inches in 2 hours equals a 5-year rain.
NOAA Atlas 14 rainfall probabilities for Lake Houston Area.
100-Year Flood Line
Now let’s look at how close that 5-year rain came to the 100-year flood line. In the construction diagram below, the developer shows the edge of the 100-year flood plain. It’s the dotted line between Zone AE and Zone X. I’ve circled the relevant portion in red.
If you were to project that line toward the lower right, it would roughly parallel the heavy black line that forms the eastern boundary of Country Colony, which you can see in the middle right of the photo below.
Floodwaters from Creek Overflow Royal Pines
The water comes almost to the edge of the floodplain shown in the construction diagram above.
Looking SE across Royal Pines. County Colony in upper right.
That big area filled with water, is a part of White Oak Creek cutting across Royal Pines. Think it’s just standing water? Think again.
The closer shot below shows water streaming through the soon-to-be subdivision and filling the Country Colony drainage ditch to overflowing.
Notice the water streaming through the cleared area and carrying away sediment downstream.
Notice also how the floodwaters approach what appears to be some sort of water treatment facility in the upper right.
These shots also document the absence of silt fence on the eastern side of Royal Pines.
All that silt will migrate down White Oak Creek and Caney Creek into the East Fork San Jacinto which the City of Houston just dredged at great public expense. The public also must foot the bill for increased water-purification costs.
More Missing Silt Fence in NW Corner of Royal Pines
The SE corner of Royal Pines wasn’t the only part of the development missing silt fence. The developer removed it from the NW corner – where a neighbor has now flooded three times in two months.
Looking N toward White Oak Creek. Contractors removed the silt fence last week. Rain then swept sediment into the woods.
Those woods contain sensitive wetlands.
Notice how water coming from the north (left) is clear. But water coming from Royal Pines (right) is filled with sediment.The muck filled the wetlands for more than a mile downstream.
How Can a 5-Year Rain Reach Almost as Far as a 100-Year Floodplain?
We need an answer to that question before this development starts pouring concrete. There are several possible explanations.
Clearcutting accelerated runoff.
Bulldozers compacted soil, limiting the rate of infiltration.
The developer hasn’t built any stormwater-detention-basin capacity to offset the increased runoff.
Planners used old (lower) Montgomery County rainfall data to determine the extent of the floodplain in their plats and plans.
Engineers didn’t count on the cumulative impact of insufficiently mitigated upstream development, some of which used beat-the-peak, hydrologic-timing surveys to avoid building detention basins.
More rain fell upstream than at the gage shown above.
Some or all of the above.
I took these photos within an hour of the end of the rain. So there wasn’t much time for water to work its way downstream very far.
Two floodplain experts I consulted pointed to the cumulative impact of upstream development as a possible culprit. Engineers are likely working with flood data acquired in the 1980s before Montgomery County became one of the fastest growing counties in the region. The data is simply too complex to adjust after each new development. So, it never gets revised and errors compound over time.
I’m sure the Montgomery County Engineers Office and TCEQ will want to get to the bottom of this before the developer starts building homes. If homebuyers flood on rains that are far less than 100-year rains, tremendous liabilities could result.
If Royal Pines or Montgomery County would like to rebut the issues I’ve raised, I will be happy to publish their point of view. The public deserves to know what’s going on.
Posted by Bob Rehak on 1/25/23
1975 Days since Hurricane Harvey
The thoughts expressed in this post represent opinions on matters of public concern and safety. They are protected by the First Amendment of the US Constitution and the Anti-SLAPP Statute of the Great State of Texas.
https://i0.wp.com/reduceflooding.com/wp-content/uploads/2023/01/20230124-DJI_0738.jpg?fit=1200%2C799&ssl=17991200adminadmin2023-01-25 11:21:142023-01-25 15:48:255-Year Rain Brings White Oak Creek Close to 100-Year Mark in Royal Pines
The National Weather Service and Harris County warn of a severe weather threat for Tuesday.
Harris County Meteorologist Jeff Lindner warns that severe thunderstorms, some of which could turn into tornados are likely with heavy rainfall, and gusty winds across SE Texas Tuesday.
The National Weather Service Storm Prediction Center also warns of the potential for supercell development and hail.
Up to 3 inches of rain are likely with isolated higher amounts (up to 6″ according to Lindner) where thunderstorm training exists.
Rainfall for Tuesday from the NWS Weather Prediction Center.Posted at 2:38PM Central Time, Monday 1/23/23.Hail probabilities for Tuesday range from 5-15% across region.
Overview
A deepening upper level trough over the SW US will move eastward and into SW/W TX tonight/Tuesday and then exit the state early Wednesday morning to the east. This system will bring dynamic weather to much of Texas starting late Monday tonight.
The dry air now over SE TX will undergo significant changes in the next 24 hours. A low level jet will quickly transport extreme moisture northward from the SW/W Gulf of Mexico. Moisture levels in the atmosphere will quintuple overnight, driven by the 50-60 mph winds just above the surface. NWS indicates strong winds are the primary threat.
A wind advisory will likely be required for much of the area with isolated to scattered power outages possible.
Jeff Lindner, Harris County Meteorologist
Lift should rapidly increase Tuesday morning with scattered to numerous showers and thunderstorms developing from SW to NE across the region.
Look for scattered showers to begin developing around sunrise, then increase in coverage through the day. The highest potential for thunderstorms in the Houston metro area should be mid-afternoon. But they should move out of the state by early evening.
Heavy Rainfall Expected
Models hint at some sort of low-level convergence boundary becoming established along the US 59 corridor around mid-morning Tuesday. That should trigger heavy rainfall well ahead of the approaching front and boost rainfall in the Fort Bend, Harris, and Liberty County areas. Lindner worries that this could lead to a period of training storms and quick rainfall accumulations.
He predicts widespread rainfall of 1-3 inches with isolated totals of 4-6 inches possible.
Street flooding will be a concern in areas that catch heavier rainfall. Hourly rates may approach 1-3 inches.
Given the time of year, wet grounds, and dead vegetation from recent freezes, maximum run-off is likely. Lindner expects rises on area streams, but also says that the current forecasted rainfall amounts should not lead to creek, bayou, or river flooding.
Severe
The National Weather Service Storm Prediction Center suggests that an impressive 80-100kt mid-level jet carving across SE TX Tuesday afternoon could bring enough instability south of I-10 for severe thunderstorms to develop. SPC has upgraded the risk in that area into a (2 out of 5) slight risk.
Wind gusts of 60-70mph will be possible. Near the coast, a tornado or two will be possible. The highest threat of severe weather is currently offshore, but the severe threat could be upgraded south of I-10.
Winds
Starting late tonight, the strong low level jet overhead will bring sustained winds of 25-35mph and gusts of 40-45mph at the surface much of Tuesday. Gusts may be higher near the coast and inland bays. A wind advisory will likely be required for much of the area and these winds may down trees and tree limbs, result in isolated to scattered power outages, and move unsecured outdoor objects.
Marine
Dangerous marine conditions will quickly develop late tonight into Tuesday as southerly winds rapidly increase into the 35-45kt range for all waters.
A gale watch is in effect for all waters and will be upgraded to a warning this afternoon. Seas will quickly build 6-8 ft in bays and 10-12ft offshore on Tuesday.
The strong winds may result in elevated tides in the northern portion of Galveston Bay Tuesday along with wave run-up on the Gulf facing beaches.
The line of strong to severe thunderstorms arriving Tuesday afternoon/evening will bring W/NW winds at 30-40 kts. Wind gusts of 50-55kts will be possible. Small craft should be in port by this evening and remain in port until winds and seas subside on Wednesday.
One Year Anniversary of Kingwood Tornado
Although January tornados are rare, we should not forget what happened last January when several twisters slashed through Kingwood downing trees and power lines. Exercise caution.
Posted by Bob Rehak on 1/23/2023 at 2PM based on information from the NWS and Jeff Lindner
1973 Days since Hurricane Harvey
https://i0.wp.com/reduceflooding.com/wp-content/uploads/2023/01/d12_fill.gif?fit=800%2C561&ssl=1561800adminadmin2023-01-23 15:08:342023-01-23 15:27:21Severe Weather Threat Tuesday with High Winds, Rain Up to 3″ and Possible Tornados