San Jacinto Regional Flood Planning Group Submits Final Recommendations

The San Jacinto Regional Flood Planning Group (SJRFPG) submitted its final recommendations to the Texas Water Development Board on January 10. The 316-page report includes recommendations on floodplain management evaluation, strategies and projects; the plan’s impacts; administration, regulatory and legislative recommendations; and financing.

I discussed the floodplain projects and impacts when I reviewed the draft plan in August of 2022. Not much as changed with the projects and impacts except for some minor details.

Now, with the state legislature in session, I would like to review the administrative, regulatory and legislative final recommendations in Chapter 8.

Legislative Recommendations

The SJRPG made four legislative recommendations to facilitate floodplain management plus flood mitigation planning and implementation.

Provide recurring biennial appropriations to the Flood Infrastructure Fund (FIF):

In 2019, the legislature appropriated money to establish the FIF. However, it did not appropriate additional funds in 2021. We need more money to fully implement the plans in the coming years.

Provide state incentives to establish dedicated drainage funding:

State law provides municipalities with the authority to establish local drainage utilities. Those that don’t use that authority generally rely on federal partners to fund floodplain management and regulatory programs. Or else they use some combination of general tax revenues and municipal bonds. The state should incentivize local communities to fund drainage projects rather than rely solely on federal funding.

Provide counties with legislative authority to establish drainage utilities/fees:

Municipalities have that power. But the unincorporated areas of counties do not. Give counties a reliable source of revenue to implement, maintain and repair drainage projects. Let them establish drainage utilities and drainage fees in unincorporated areas.

Update the state building code on a regular basis:

Texas is missing out on a billion dollars in FEMA’s Building Resilient Infrastructure and Communities (BRIC) Grants because of antiquated building costs. To take advantage of those grants, we need to update building codes. Adopt recent versions of the International Building Code (IBC) and the International Residential Code (IRC) at a minimum. Also we should adopt updated codes regularly in future legislative sessions.

Regulatory and Administrative Recommendations

The plan also made the following recommendations for regulatory and administrative changes.

Upgrade TxDOT design criteria:

Require all new and reconstructed state roadways to be elevated at or above the Atlas-14 1.0% annual chance flood level. Use the 0.2% level if Atlas 14 has not yet been adopted. TxDOT should also consider future conditions, such as urbanization and climate variability, in its roadway design criteria. TxDOT does not in all cases design roadways consistent with minimum NFIP requirements. TxDOT should strive to meet NFIP standards, especially for critical infrastructure such as evacuation and emergency routes.

Recommend Minimum Statewide Building Elevation Standards:

Recommend statewide minimum finished floor elevations at (or waterproofed to) the FEMA effective 2% annual chance flood except in areas designated as coastal flood zones. Use the 1.0% annual chance flood elevation where Atlas 14 has been adopted. Incentivize higher building standards. Recent historic floods and NOAA’s updated Atlas-14 rainfall probabilities reveal how much base flood elevations (BFE) can change over time. Jurisdictions that have required a freeboard over the current BFE have mitigated the risk of these increasing BFEs.

Clarify the process and cost to turn Base Level Engineering (BLE) data into Flood Insurance Rate Map (FIRM) panels:

BLE efficiently models and maps flood hazard data at community, county, watershed, and/or state levels. Currently, the state and FEMA are heavily investing in BLE. Clearly communicate to local jurisdictions how to implement this data in regulations and flood insurance rate maps. The steps remain unclear to many local jurisdictions.

Establish and fund a levee safety program similar to the TCEQ dam-safety program:

The TCEQ has a program to inspect dams that fall under its jurisdiction. Levees, on the other hand, are not subject to a similar safety program despite posing similar risks during flooding events.

Promote flood awareness, education, safety and outreach:

Partner with the Texas Floodplain Managers Association (TFMA) to promote public flood awareness, education, and safety in communities. Also, partner with Texas Association of Counties to do the same for Floodplain Administrators lacking technical flooding background (e.g., some County Judges). A well-informed public can make better informed personal choices regarding issues that involve flood risk and also will be more likely to support public policies and mitigation measures to reduce that risk.

Support ongoing education/training for floodplain management:

Provide no- or low-cost online resources including training modules, webinars, and print. Target training for non-technical Floodplain Administrators (e.g., County Judges who may serve as Floodplain Administrators but not have the necessary technical background). This would help to make effective floodplain management more prevalent across the state, especially in smaller counties.

Develop state incentives to participate in the National Flood Insurance Program (NFIP) and Community Rating System (CRS) program:

NFIP works with communities to adopt and enforce floodplain management regulations that help mitigate flooding. CRS encourages practices that exceed minimum requirements of the NFIP. Both programs are essential to achieving State Flood-Plan goals.  Implement State-led incentives to encourage communities to participate.

Develop a public database that tracks flood fatalities:

Fatalities have occurred during extreme flood events throughout the state’s history. A statewide database and tracking system with appropriate privacy restrictions could aid in future project planning and regulatory decision making. It could also help with future education efforts regarding actions that frequently lead to fatalities. An example is the importance of not attempting to drive through flood waters. 

Help smaller jurisdictions prepare grant and loan applications or make the process easier:

Provide training for Councils of Governments (COGs) to assist with the funding process. Developing applications for project funding can be difficult, especially for smaller jurisdictions with limited experience and access to funding to obtain expert assistance. Simplifying applications and making funding available specifically for application development would serve to make the process more accessible across the state and help close knowledge gaps.

Develop interactive models that use Base Level Engineering (BLE) data: 

Provide them to Regional Flood Planning Groups and their technical consulting teams. Standardize future conditions and land use data. The State’s and FEMA’s BLE data should be available in most parts of the state.

Allow partnerships to provide regional flood-mitigation solutions:

Flood risk does not recognize jurisdictional boundaries, yet many flood-mitigation programs prevent multiple jurisdictions from working together if they want to remain eligible state funding. Flood-mitigation studies and solutions require inter-jurisdictional collaboration. Update policies to encourage and permit it.

Next Step on Final Recommendations

These final recommendations sound like good ideas to me. Please communicate your feelings to your state senator and representative.

I have summarized the final recommendations above. To see their exact text, review chapter 8. Or see the entire report to put them all in context.

Posted by Bob Rehak on 1/22/2023

1972 Days After Hurricane Harvey

Downstream Addicks Barker Case Moves Another Step Closer to Trial

On January 10, 2023, McGehee ☆ Chang, Landgraf, Feiler responded to the government’s most recent motion in the Addicks Barker Downstream “Takings” Case on behalf of the plaintiffs. Their response included a counter-motion against the government. Here is a copy of their motion. Each side will have a chance to file one more round of written arguments before trial.

Background: Government Denies Claims

To recap, in November 2022, the government again moved for a summary judgment in the case. The government contended that the Addicks and Barker dams:

  • Historically prevented far more damage ($16.5 billion through 2016) than the release of water during Harvey caused
  • Reduced plaintiff’s level of flooding by up to 7-8 feet
  • Did not “cause” – in a legal sense – the plaintiffs’ flooding

Further, the government contended that plaintiffs’ claims are based on a single, extraordinary, catastrophic event and any action undertaken by the Corps during the event does not constitute a “taking” under the Fifth Amendment.

The government compared peak flows at several points along Buffalo Bayou during Harvey and contended that the plaintiffs properties would have flooded regardless of the release. It claims that the releases constituted less than 10% of total flow. The government also claimed that had it never built the dams, downstream flooding would have been far worse.

Plaintiffs Allege They Were Not Informed of Risk

The plaintiff’s response (which included 3800+ pages of arguments, depositions and appendices) focuses on how the government modified the dams and its procedures over time.

It adjusted discharge rates to maintain a “non-damaging channel capacity over time.” The rates went from the original design concept of 15,700 cubic feet per second down to about 2,000 cubic feet per second in a series of incremental steps over decades. The changes were designed to accommodate residential construction along Buffalo Bayou.

The plaintiffs allege that the Corps publicly reassured property owners that it would not open the dams to a point where it would cause downstream flooding. Plaintiffs further allege that over the years, people grew to rely on these assurances and none of the test properties experienced any flooding.

Nor did any of them know that the Government might deliberately release water from the Reservoirs in sufficient quantities to flood their properties.

One commercial property reported just a few inches of flooding prior to the releases, escalating to six feet afterward. Plaintiffs argue that they would have suffered no or substantially less flooding if the government had not released water, a decision motivated in part to protect upstream properties.

Crux of Plaintiff’s Arguments

Plaintiffs claim the government:

  • Repeatedly promised downstream property owners that it would keep the floodgates closed
  • Could have kept the floodgates closed; the Reservoirs were never in danger of failing
  • Elected to open the floodgates even though it did not have to do so to avoid any imminent failure
  • Knew that opening the floodgates would flood the downstream property owners
  • Cannot meet the high bar required to assert releases were necessary.
  • Could have bought-out the properties it flooded but chose not to because of the expense.

Plaintiffs conclude by saying that:

  • The Government’s summary judgment motion should be denied
  • The Court should enter a partial summary judgment for the Plaintiffs on the liability and causation elements of their claims
  • All other issues, including damages, should be set for a prompt trial.

To review all the appendices submitted by plaintiffs, click here. Size caution: 330 megabytes.

A Shakespearean Tragedy

Although it might be buried somewhere in thousands of pages of filings, neither side in this case appears to directly address which properties would have flooded regardless of the release and which flooded because of the release.

The government seems to contend it is responsible for none of the flooding because it was unavoidable. And the plaintiffs contend the government is responsible for all of it.

This is like watching a Shakespearean tragedy unfold. Not even at issue here are the policies that allowed lucrative development in dangerous places, the lack of risk disclosure, and the erosion of safety margins.

Next up: The government can reply to plaintiff’s motion by February 9, 2023. Plaintiffs will then have a chance to reply to the reply by March 11. Then both sides will gear up for a hearing before the Judge. 

Posted by Bob Rehak on 1/19/2023

1969 Days since Hurricane Harvey

The thoughts expressed in this post represent opinions on matters of public concern and safety. They are protected by the First Amendment of the US Constitution and the Anti-SLAPP Statute of the Great State of Texas.

How Intense Was That Storm? And Why Does It Matter?

The sky darkens. Thunder grows louder. Suddenly, the rain comes down so hard you can barely see. Soon, water starts coming over the curb toward your house. Your weather radio crackles with warnings. And when it’s over, the stormwater has stopped just feet from your door. Close call! But then you wonder. How intense was that storm? And does it really matter?

The answers affect disaster planning, flood insurance, mitigation, and more.

Consider the intensity question first.

How Intense Was That Storm?

Was it a 1-, 2-, 5-, 10-, 25-, 50- or 100-year storm?

Determining the intensity requires more than just reading your rain gage. That’s because intensity depends on volume within a certain time period. Five inches of rain in an hour should concern you far more than in a day.

Start by going to the Harris County Flood Warning System. It shows all official gages in the region. Hover over any one. A box with a hyperlink will pop up. For this example, let’s assume you live near the East Fork San Jacinto and FM1485.

Hovering over the gage by New Caney pulled up box with the blue link.

Click on the More Information link. It will lead you to a search screen that lets you specify date(s). You can also specify time ranges from one hour to one year.

In this case, I selected 2 days and adjusted the date until I captured all the significant rainfall.

By experimenting with different time ranges, you can narrow down the start and stop times. This is crucial, because intensity depends on both quantity and duration.

At our sample gage, I learned that rainfall from Tropical Storm Imelda in 2019 happened over a two-day time period.

Now, look up the total (28.68 inches) in the Atlas-14 table below. This table shows the rainfall precipitation frequency estimates for the Lake Houston Area.

atlas 14 rainfall probabilities
If you live somewhere else, download your table from the National Weather Service here.

So, how intense was that storm? The total rain for two days – 28.68 inches – qualifies Imelda as a 500-year storm at that gage. Look down to the 2-Day line and then across to the 500-year column.

If you captured more or less rain in your rain gage at home, use that total instead. At least now you know that you’re working with a 2-day event. (Note: some rain fell outside this range, but not much.)

Check other Gages to See Geographic Rainfall Distribution

While you’re exploring the Flood Warning System, check several different gages, especially those upstream. Rainfall can vary considerably within short distances.

For instance, during Imelda, a gage at the West Fork and SH242 showed only 13 inches of rain during an identical period – less than half the rain just a few miles west. That ranks as a 25-year storm, not a 500!

When people say that “We got X number of 500-year storms in Y years,” it’s important to remember that the 500-year designation applies only to a particular gage, not an entire region.

Do 500-Year Storms Mean 500-Year Floods?

Also remember this. As the example above shows, having a 500-year storm somewhere near you does not automatically mean you will experience a 500-year flood. It depends on where the rain falls in your watershed. If it falls upstream, it could result in a 500-year flood. But if it falls downstream, it will not.

During Imelda, the gage(s) at:

  • Greens Bayou and US59 got 15 inches – between a 25- and 50-year rain.
  • Spring Creek and I-45 got 8 inches – a 5-year rain.
  • Cypress Creek and US290 got 2.52 inches, not even a 1-year rain.
  • Lake Creek at Dobbin got 1.52 inches.
  • Lake Conroe at 1375 got .84 inches.

Use the drop-down list of gages to explore rainfall rates elsewhere.

A few miles in each case separated Armageddon from something far more manageable.

What Can You Do with This Information?

This exercise can help protect you in several ways. For instance:

  • If you didn’t flood during Imelda and you heard it was a 500-year rain, you might assume you didn’t need flood insurance. That could be a financially devastating miscalculation.
  • If you get little rain upstream and still flood, you should investigate why.
  • If you flood frequently on small rains, you need to investigate the causes and mitigation. Engage with HCFCD, your county engineer or floodplain manager. Perhaps the floodplain has been altered by upstream development. Perhaps the stream near you has become clogged. Perhaps you need to elevate your home or seek a buyout.

The more you know, the safer you’ll be.

Posted by Bob Rehak on 1/18/23

1968 Days since Hurricane Harvey

The thoughts expressed in this post represent opinions on matters of public concern and safety. They are protected by the First Amendment of the US Constitution and the Anti-SLAPP Statute of the Great State of Texas.

Green Roofs Help Reduce Runoff and Energy Use

One third of Harris County is now impervious cover. According to the Harris County Infrastructure Resilience Team, green roofs are one of several tools that can help mitigate flooding by converting impervious cover back into green space.

Also known as ‘vegetated roofs’ or ‘living roofs,’ they can reduce runoff by soaking up part of the rainfall during a storm and holding it back.

Part of 19,200 square foot green roof installed on EPA headquarters in Denver

Green roofs consist of a waterproofing membrane, growing medium (soil) and vegetation (plants) overlying a traditional roof.

Well-designed, engineered and maintained green roofs provide multiple environmental, social, economic, and aesthetic benefits. They help:

Can Reduce Runoff by up to 65%

The U.S. General Services Administration (GSA) manages more than 2 million square feet of green roofs. Some date back to the 1930s. So, they have extensive experience. 

GSA points out that “Most urban and suburban areas contain large amounts of paved or constructed surfaces which prevent stormwater from being absorbed into the ground. The resulting excess runoff damages water quality by sweeping pollutants into water bodies. Green roofs can reduce the flow of stormwater from a roof by up to 65% and delay the flow rate by up to three hours.

Extensive green roofs intercept and retain the first 1⁄2 to 3⁄4 inch of rainfall, preventing it from ever becoming runoff.

Green roofs mimic natural hydrological processes as part of a watershed management approach to drainage. They are just one of many tools to reduce impervious cover.

Cost/Benefit Analysis Shows Payback

Cost/benefit analysis shows that green roofs can provide payback in 6.2 years. Their longevity has the greatest effect on savings.

They last twice as long as conventional roofs.

U.s. General services administration

Of course, they cost more to install and maintain. But GSA says that the other benefits they provide (stormwater and energy reduction) more than compensate for the premium owners pay.

The City of Houston provides tax abatements and discounts for green stormwater infrastructure, such as green roofs, in recognition of the stormwater management benefits. Such savings can also provide significant value for owners. 

But any cost/benefit analysis for owners/investors depends on many factors, such as the square footage and height of buildings. Energy and stormwater management benefits increase with size of a roof. Energy savings primarily benefit the higher floors in a multi-story building, i.e., those closest to the roof.

GSA notes that any increased market value of buildings with green roofs was not included in its cost/benefit analysis. GSA believes that if it were, it would show even greater benefit.

Benefits to Owners AND Community

Regardless, even though they provide a positive payback to owners, benefits to the community have the greatest positive impact.  They provide net present value savings of almost $38 per square foot of roof, according to the GSA.

Green roofs are being increasingly used in urban areas where space constraints limit the use of other stormwater management practices. Such roofs can protect the roofing materials below by shielding harmful UV rays and protecting them from adverse weather events.

Importance of Drainage Paths, Right Plants

It is important that green roofs have a suitable drainage path for excess water that is not absorbed during larger storms. All green roofs should be designed to move excess water away from the building. This water can then be directed to rain gardens or cisterns.

In Texas, such roofs require special plant selection that can hold up to the region’s extremes in heat and humidity.

Not for Everyone

However, green roofs won’t work for everyone. The increased weight requires additional structural support. And the slope must be gentle. They’re primarily for flat or slightly sloping roofs. All those factors make retrofitting them to pre-existing buildings difficult. Generally, engineers must plan for them before construction of a building.

Posted by Bob Rehak on 1/14/23, first in a series on green infrastructure

1964 Days since Hurricane Harvey

Royal Pines Floods Neighbor on Less Than 1″ of Rain … AGAIN

On October 28, Royal Pines flooded a neighbor on less than an inch of rain. Two months later, on December 29th, the same thing happened again. The video below provided by the homeowner shows the volume of water funneled across her property by the developer.

Video from NW corner of Royal Pines

This video and the previous one from October demonstrate the dangers of clearcutting and redirecting drainage without first constructing sufficient stormwater detention capacity.

Altering Landscape Accelerates Runoff Toward Homeowner

The homeowner who shot the video lives adjacent to the left border in the photo below. Royal Pines has apparently sloped its property toward that corner where contractors will eventually build a stormwater detention basin.

Looking N across Royal Pines. This and other photos below taken on 1/3/23.

Land now slopes toward where video was filmed at left corner. But that area used to slope in the opposite direction. See details below from the USGS NATIONAL MAP and the developer’s plans.

Green arrow on left shows location of homeowner’s property. Red X within V-shaped contour shows exact location of low point (graph on right) before clearing and grading the land.

There used to be an 8-foot drop east of the homeowner’s property. But now, instead of water flowing directly north to White Oak Creek, it flows northwest.

The general plan for Royal Pines (below) shows the same V-shape in the proposed detention basin (upper left). The line represents the edge of the floodplain and confirms that the developer A) knew about the slope and B) changed it.

Royal Pines
Royal Pines General Plan.

Silt Fence, Trench Ineffective Against That Much Water

The video above and the photos below show that silt fence makes a terrible dam against even small rains funneling toward a point from such a large area.

Exercise in futility. A series of silt fences have done little to catch and slow the water...or the silt. Note erosion deposited in woods.
Looking south. The developer apparently tried to divert runoff racing toward the homeowner with a trench. But erosion from the barren land rapidly filled it in.
Runoff also collects at the entrance to Royal Pines. Looking ENE from the entrance at the northern end of West Lake Houston Parkway.

Unfortunately, the developer plans to build homes there, not another detention basin.

0.88 Inches of Rain Fell in Two Hours

The graph below from the Harris County Flood Warning System shows that .88 inches of rain fell in the two afternoon hours before the homeowner shot the video.

Homeowner shot video after first two bars on left.

The table below shows that that much rain in two hours constitutes less than a 1-year rainfall event.

atlas 14 rainfall probabilities
Atlas 14 rainfall probabilities for this area.

That’s consistent with actual observed events and climate records. According to the National Weather Service, on average, we can expect rainfalls greater than 1 inch 14 times per year in Houston. That’s about once per month.

Woodridge Village Revisited

The Montgomery County Engineer’s Office has reportedly asked the developer’s engineering company to revise its plans. The homeowner says that according to the engineer’s office, not even a 6-7 foot tall berm around that portion of the property would be enough to stop all the water flowing in that direction.

So, what lessons can we learn from this example? As with Woodridge Village, don’t clear and grade this much land before constructing detention basins!

The first sentence of Section 11.086 of the Texas Water Code states that “No person may divert … the natural flow of surface waters in the state, or permit a diversion … to continue, in a manner that damages the property of another…”

Posted by Bob Rehak on 1/13/2023

1963 Days since Hurricane Harvey

The thoughts expressed in this post represent opinions on matters of public concern and safety. They are protected by the First Amendment of the US Constitution and the Anti-SLAPP Statute of the Great State of Texas.

FEMA Simplifying Procedures for Small Public Assistance Grants

On January 9, 2023, FEMA released a Simplified Procedures policy for Public Assistance grants to speed up recovery for applicants. Small projects are now defined as those up to $1 million.

The new policy should reduce administrative burdens and enable communities to recover more quickly after presidentially declared events by streamlining documentation requirements.

FEMA will accept estimates with summary information and the applicant’s certifications for damage and work, instead of requiring applicants to provide full or detailed documentation. 

FEMA Press Release

FEMA conducted a review in 2020. It showed that if a $1 million threshold were applied, 94 percent of projects would be considered small and help put additional recovery dollars in the hands of applicants faster and accelerate closure of projects.

FEMA intends to continue adjusting the threshold annually to reflect changes in the Consumer Price Index. It also intends to review the base threshold every three years.

The new policy is not directly aimed at individuals, but at state and local governments and certain types of private nonprofit organizations. Public Assistance grants cover such things as:

  • Disaster-related debris removal
  • Emergency protective measures
  • Repairs to damaged or destroyed infrastructure (i.e., roads).
FM 1010
FM1010 Washout during Harvey at Rocky Branch in Plum Grove near the East Fork. Still not repaired after 5.5 years.

Depending on repair cost and other factors, the road washout above is an example of the type of project that might benefit from the new policy. However, it’s not clear whether the simplified procedures apply retroactively to damage from past disasters or only future disasters. More details will follow.

How Public Assistance Usually Works

In general, applicants submit Requests for Public Assistance (RPAs) within 30 days of the disaster declaration. They must demonstrate that:

  • Damage is in a designated area
  • Applicant has legal responsibility to perform the work
  • Cost is reasonable.

Once FEMA and the state review and approve the government agencies’ or nonprofits’ RPAs, applicants work with their FEMA representative to develop a damage inventory. 

FEMA obligates funds to the state once a project meets Stafford Act eligibility requirements. The state is the official recipient of FEMA federal assistance. The state is then responsible for disbursing the money to applicants. 

FEMA will hold a series of webinars in coming weeks to explain more about the simplified policy. Additional details are not yet available.

Getting aid to people faster after a disaster is necessary. This is a very complex subject. I wish all forms of disaster relief, including hazard mitigation, could be simplified. We’re still waiting on the Harris County, the GLO and HUD to agree on a plan for spending $750 million in mitigation funds related to Hurricane Harvey – 5.5 years after the event!

Posted by Bob Rehak on 1/12/23 based on a FEMA Press Release

1962 Days after Hurricane Harvey

Commissioners Approve New Formula for Scoring Future Flood Projects

Harris County Commissioners Court approved a motion on 1/10/23 that will change the formula for scoring future flood projects. It gives two thirds of a potential project’s score to population density, building density and social vulnerability, but only 20% to flood risk and nothing to actual flood damage.

Stacking the Deck

The new formula could be used both to compare and eliminate projects. With only 20% of a project’s score determined by flood risk, fixing minor flooding inside the Beltway could soon take precedence over fixing severe flooding outside the Beltway. The formula provides only the illusion of transparency and fails to ensure fairness.

worst first
Chart showing feet above flood stage of 33 gages on misc. bayous in Harris County during Harvey.

During Hurricane Harvey, the highest flooding in the County occurred outside the Beltway along the San Jacinto River, Spring Creek and Cypress Creek.

Evacuation Route during Harvey
North Shore evacuation route during Harvey. Photo by Jim Balcom.

Regardless, despite being the largest watershed in the county and one of the most heavily damaged, few flood-mitigation dollars have come to the San Jacinto Watershed.

Since Harvey, 4.6 more flood-mitigation dollars have gone to the Brays watershed than the county’s largest, the San Jacinto.

Brays is the county’s most populous watershed. It’s also where Commissioner Ellis lives. Could that have anything to do with the factors and weights in the new formula for scoring future flood projects? They include:

  • 45% Project Efficiency
    • 15% Resident Benefits 
    • 30% Structure Benefits 
  • 20% Existing Conditions 
  • 20% Social Vulnerability Index 
  • 5% Long Term Maintenance Costs 
  • 5% Minimizes Environmental Impacts 
  • 5% Potential for Multiple Benefits 

This new formula omits consideration of damage, risk reduction and partnership funding. Partnership funding has provided approximately one third of all Flood Control District funding since 2000. The new formula gives the most weight to building and population density incorporated in the Project Efficiency formula (project cost divided by # residents and structures benefitted). This 15-page PDF explains how projects are scored within each category above.

Other Problems with Formula

The formula for scoring future flood projects, proposed by Precinct 1 Commissioner Rodney Ellis has many other problems. It also:

  1. Does not differentiate between types of structures while giving them almost a third of the weight. Thus, a mobile home counts for as much as a hospital or college. 
  2. Gives no weight to protecting critical infrastructure such as bridges, hospitals, grocery stores, wastewater treatment plants, etc. 
  3. Omits actual damage from consideration, which “ground-truths” risk assumptions (see Existing Conditions, Page 6).
  4. Eliminates consideration of partnership funds, which have provided almost one third of HCFCD funding since 2000
  5. Gives 20% weight to social vulnerability, but ignores the severity of flooding. Thus a low-income home with one inch of flooding counts as much as an entire condo complex swept away by 22-foot deep floodwaters. 
  6. Makes awards more subjective because HCFCD has no way of estimating how many people live in apartment buildings or homes. HCFCD can count buildings in satellite photos, but the number of residents benefitted will always be a guess. Census tracts do not follow floodplain boundaries. 
  7. Undermines efforts to prevent flooding, as opposed to correcting it after people are damaged. Prevention, such as HCFCD’s Frontier Program, is always more cost effective in the long run. 
  8. Places 45% of the weight on cost data that has not yet been determined when deciding whether to explore projects further.

Ellis’ proposal passed 3-1 yesterday. Commissioners Rodney Ellis, Adrian Garcia, and Lesley Briones voted for it. Commissioner Tom Ramsey voted against. County Judge Lina Hidalgo was absent. Commissioner Ellis ran the meeting.

To see the discussion on Ellis’ proposal, click on “Departments 2 of 2” in the meeting video and scroll forward to 3:03:53. The discussion lasts 16 minutes. Below is a summary of key points and their time codes.

Summary of Debate with Video Timecodes

Ellis positions his proposal as a “transparency measure.” 3:04:10

Dr. Tina Petersen, head of the Flood Control District describes it as a “clear, consistent and equitable basis” for comparing projects that the flood control district is undertaking. 3:04:53

Precinct 3 Commissioner Tom Ramsey says “criteria and frameworks are not necessarily a bad thing,” but then expresses a list of concerns about the proposal, none of which are addressed later in discussion. 3:06:19

Petersen responds that it’s “not perfect.” She says, “there’s no reason we can’t continue to refine this tool.” It’s very “general.” It let’s us “use what we have as a basis for comparison and continue to look forward to opportunities to refine” the tool.

Precinct 2 Commissioner Adrian Garcia asks whether the proposal will add costs or time to projects. 3:11:00

Petersen says no. “The framework should not require additional costs as long as we don’t look back.”

New Precinct 4 Commissioner Asks Probing Questions

New Precinct 4 Commissioner Briones then asks “how often will it be updated?” 3:13:20

Petersen replies, “We’re not considering making any changes to the framework.” She describes the primary uses as: comparing projects and determining which are eligible for funding from the Flood Resilience Trust.

Briones asks whether the framework incorporates “severity of flooding.”

Petersen points to the “efficiency” metric as the closest thing because it incorporate the number of people and structures benefitted. But Petersen sidesteps the point of the question about “depth of flooding” raised by Ramsey earlier. 3:14:25

Briones questions why partnerships are excluded.

Petersen responds that the framework was designed for use with the flood resilience trust, on projects where partnership dollars were no longer considered a possibility. “It was intended to be a backstop for projects that do not have partnership funding.” Petersen does not mention $750 million in HUD/GLO dollars pending final approval.

Briones next asks whether the framework will provide a threshold for making go/no-go decisions on projects. 3:15:40

Petersen replies, “I want to be clear. It will be used for determining whether a project is eligible for flood resilience trust funds.”

At 3:19:30, Ellis quickly closes debate before someone asks for clarification. The measure passes.

Debate Filled with Unresolved Contradictions

Petersen sidestepped Brione’s tough questions about severity of flooding and the eliminating projects. At one point, Petersen said it was “only a point of comparison.” Later, she said it would determine project “eligibility.”

She also equivocated in her response to Ramsey’s concerns. At first she implied the framework was a first step. Later she said that she didn’t plan to change it. Even though the framework is intended for future projects, most of Petersen’s answers related to the past.

Bellwether Vote

Only one thing is certain.

We’re in for four more years of fog described as transparency!

Posted by Bob Rehak on 1/11/2023

1961 Days since Hurricane Harvey

The thoughts expressed in this post represent opinions on matters of public concern and safety. They are protected by the First Amendment of the US Constitution and the Anti-SLAPP Statute of the Great State of Texas.

Development Update on 3 Areas in NW Humble

Three areas in northwest Humble are in various stages of development. Parts or all of these areas flooded during Hurricane Harvey. The flooding was deep enough that reportedly one of the developers is not even going to try to raise the area. Instead, he said he will raise the homes 6-7 feet. Let’s hope that’s enough.

The numbers in the satellite image correspond to the groups of photos below. I took all shots on 1/3/23.

#1 will become light industrial. #2 will become single family residential. #3 will become single- and multi-family residential.

Area #1 – Light Industrial

According to a 2016 map by Skymark, the developer, the first area will become light industrial.

A four-lane divided road leads from the NW corner of Townsen Boulevard to Spring Creek on the north. By Skymark Development.
The road abruptly stops before reaching Spring Creek and the Spring Creek Nature Trail.

The unpaved area between Spring Creek and where the road ends is owned by another developer (Pacific Indio) who also owns the land on the far side of the creek.

The Spring Creek Nature Trail cuts through the woods near the creek and follows it north toward I-45.
Reverse angle shot looking SE toward Deerbook Mall shows large cleared area with stormwater detention basin.

Area #2 – Single Family Residential

Contractors are in the process of building roads into an area west of Target and Kohls. Saratoga Homes reportedly plans to build 357 homes and townhomes on this location.

Looking S from over Townsen Blvd. we can see two large stormwater detention basins (lower and upper left)
Same area, but looking east toward Kohls and Target.

The closer shot below shows that not all the roads have been built yet.

Saratoga plans to build elevated homes here.

Area #3 – Single- and Multi-Family Residential

Looking south toward Sam’s with Townsen Blvd West on right, we can see a large stormwater detention pond that already has grass growing. This area will become single- and multi-family residential, some of which will be dedicated to seniors.

Note last of trees in center foreground being cleared and shredded for mulch.
Spillway from detention basin seems to have a detour built into it. The purpose? Likely to slow the water and avoid erosion at the base of the utility poles. The long ditch on the left will drain Areas 2 and 3.

Together, all three areas comprise approximately 260 acres according to this map on the Skymark Development website.

To learn more about the history of these sites, see the posts below. They contain floodplain and wetland maps.

Onward. Into the danger zone!

Posted by Bob Rehak on 1/9/23

1959 Days since Hurricane Harvey

Ellis Trying to Change How All Flood-Control Projects Prioritized

Precinct 1 Commissioner Rodney Ellis has placed an item on the Commissioners Court agenda for 1/10/23 with far reaching ramifications for flood control in Harris County. It would change the way every future project is prioritized using a formula that gives almost half the weight to population and building density. Meanwhile, it ignores the amount of damage, severity of flooding, danger to infrastructure, historical underinvestment, and the difficulty of accurately estimating population in flood zones. Ellis’ recommendation could be used to permanently deny projects to heavily flood-damaged areas like Lake Houston.

Text of Motion

In Agenda Item #250, Ellis seeks: “Request for approval to direct the Harris County Flood Control District (“District”) to assign prioritization scores using the adopted 2022 Prioritization Framework for the Allocation of Funds from the Harris County Flood Resilience Trust to all new flood risk reduction projects funded by the District when requesting Commissioners Court approval to initiate the project, and to transmit those scores as quartiles to Commissioners Court.”

So what is that framework and why do we need it?

History of Recent Efforts to Prioritize Projects

Before the 2018 flood bond, Harris County flood control looked primarily at clusters of repeat damage to define and prioritize projects. That damage also formed the basis for obtaining partner funding in many cases.

However, when the perpetually underfunded Flood Control District received the huge infusion of cash from the 2018 flood bond, a problem arose. Which of the many worthy projects would be launched first? There simply weren’t enough qualified contractors to handle all needs simultaneously.

The text of the 2018 flood bond approved by voters contained a sentence that said, “…Commissioners Court shall provide a process for the equitable distribution of funds…” (See Paragraph 14-G). That became the key to the answer…with some verbal legerdemain by Ellis that turned “distribution” into “prioritization” and “equitable” into “equity.”

2019 Equity Prioritization Framework

In 2019, Ellis proposed (and the Court adopted) the “Prioritization Framework for the Implementation of the Harris County Flood Control District 2018 Bond Projects.” This framework ranked projects with a multi-factor index using the following weights:

  • 25% Flood Risk Reduction
  • 20% Existing Conditions (Drainage Level of Service)
  • 20% Social Vulnerability
  • 10% Project Efficiency
  • 10% Partnership Funding
  • 5% Long Term Maintenance Costs
  • 5% Minimizes Environmental Impacts
  • 5% Potential for Multiple Benefits
  • Total 100%

Commissioners, including Ellis, repeatedly affirmed their intent to complete all projects originally identified as part of the bond. The framework simply prioritized their start dates.

Commissioners also talked a lot about prioritizing “the worst first.” It was a nice sound bite, but never defined. Were the worst areas those with the most damage, deepest flooding, poorest residents, highest risk, or some combination of the above? Notice that the formula above omits flood damage, the traditional way of prioritizing funds and “ground-truthing” flood-risk estimates.

At this point, all of the projects in the bond have started. Their natural lifecycles and complexity will determine their order of completion. So, the debate has shifted from the flood bond to other sources of funding and future projects.

2021 Changes Applied to Flood Resilience Trust

In 2021, Commissioners created a Flood Resilience Trust using Toll-Road funds to backstop potential shortfalls in flood-bond partner contributions. The weighting used to allocate funds from the Trust changed significantly.

  • 25% Structures Benefitted
  • 20% Flooding Frequency
  • 20% Social Vulnerability
  • 10% Cost Per Structure
  • 10% Partnership Funding
  • 5% Maintenance Cost
  • 5% Environmental Impact
  • 5% Secondary Benefits
  • Total 100%

Flood Control used this formula only to prioritize the use of backstop funds in the Trust. Note this version of the formula eliminated both damage and risk reduction from consideration.

2022 Changes

In April, 2022, Commissioners modified the 2021 weights within the Prioritization Framework – still only for Flood Resilience Trust Funds – as follows:

  • 45% Project Efficiency
    • 15% Resident Benefits
    • 30% Structure Benefits
  • 20% Existing Conditions
  • 20% Social Vulnerability Index
  • 5% Long Term Maintenance Costs
  • 5% Minimizes Environmental Impacts
  • 5% Potential for Multiple Benefits

This 2022 formula omits consideration of damage, risk reduction and partnership funding. But it gives weight to population density (project cost divided by # residents benefitted). This 15-page PDF explains how projects are scored within each category above.

2023 Proposal

Commissioner Ellis now proposes applying the 2022 Resilience Trust formula to ALL FUTURE HCFCD PROJECTS.

Problems with Proposal

Flood Control would now use Ellis’ formula to decide which projects make the list, not just which go first.

Thus, the so-called “equity” formula once used to schedule projects could now be used to eliminate projects altogether.

Two thirds of the weight goes to density and social vulnerability. Only 20% relates to flooding.

The projects most likely to be eliminated would be outside the Beltway – in less dense areas that have traditionally received the least funding. In a post-bond, financially constrained environment, the weight given to density will put every project outside the Beltway at a disadvantage.

But the Ellis formula has many other problems, too. It:

  1. Does not differentiate between types of structures while giving them almost a third of the weight. Thus, a mobile home counts for as much as a hospital or college.
  2. Gives no weight to protecting critical infrastructure such as bridges, hospitals, grocery stores, wastewater treatment plants, etc. 
  3. Omits actual damage from consideration, which “ground-truths” risk assumptions (see Existing Conditions, Page 6).
  4. Eliminates consideration of partnership funds, which have provided almost one third of HCFCD funding since 2000.
  5. Gives 20% weight to social vulnerability, but ignores the severity of flooding. Thus a low-income home with one inch of flooding counts as much as an entire condo complex swept away by 22-foot deep floodwaters. 
  6. Makes awards more subjective because HCFCD has no way of estimating how many people live in apartment buildings or homes. HCFCD can count buildings in satellite photos, but the number of residents benefitted will always be a guess. Census tracts do not follow floodplain boundaries.
  7. Undermines efforts to prevent flooding, as opposed to correcting it after people are damaged. Prevention, such as HCFCD’s Frontier Program, is always more cost effective in the long run.
  8. Forces Flood Control to judge projects before the District has engineering and cost data in hand that would help determine whether the projects are worth pursuing. That’s because “ALL FUTURE PROJECTS” include preliminary engineering projects.

Suggestions For Improvement

Below are several suggestions to improve the formula.

  1. Define “worst first.” While the sentiment is noble, in practice, the term has no practical definition. (Ditto for equity.)
  2. Incorporate measurements for severity of flooding and amount of damage. These really define worst.
  3. Prioritize critical infrastructure such as bridges whose loss can jeopardize the economic vitality of the region.
  4. Include partnership funds. They help stretch flood-mitigation tax dollars by almost a third. Even if people sometimes must wait longer to line up partner funding, partner funding helps more people in the long run.
  5. Acknowledge that HUD dollars go disproportionately and preferentially to Low-to-Moderate Income neighborhoods.
  6. Publish level-of-service data, used in the “existing conditions” calculation, for all streams in the county. It seems to be secret. I’ve been trying to get it for a year. Keeping it secret undermines trust in government. How do we know money is really going to the areas with the greatest risk?
  7. Publish results of the new prioritization index periodically, so we can see which projects are being eliminated and why. And so we can understand why 18 of the 20 currently active capital improvement projects are in Precincts 1 and 2.
  8. Publish a 5-year Capital Improvement Plan similar to the City of Houston. Let people see what is coming, when, and for how much. That way we can hold HCFCD and Commissioners accountable. Plus, we can see their “formula” in action.
  9. Acknowledge where money has really gone historically.
  10. Be fair to all. The proposed formula is like playing cards with a stacked deck.

Posted by Bob Rehak on 1/7/23

1957 Days since Hurricane Harvey

The thoughts expressed in this post represent opinions on matters of public concern and safety. They are protected by the First Amendment of the US Constitution and the Anti-SLAPP Statute of the Great State of Texas.

Next Leg of San Jacinto West Fork Greenway Now Hike- and Bikeable

The second leg of the Houston Parks Board’s San Jacinto River West Fork Greenway is taking shape nicely. Contractors have apparently finished concrete work and landscaping. It can now be hiked and biked.

Route of San Jacinto West Fork Greenway

The first leg of the three-mile route starts near the entrance to River Grove Park at the south end of Woodland Hills Drive in Kingwood. It used existing residential streets and new trails to snake its way to the Forest Cove Community Center. Then construction paused until demolition of the flooded townhomes on Aqua Vista, Timberline, and Marina Drives finished.

The second leg (dark purple below) follows existing streets through the old townhome site. However, contractors narrowed the streets to one lane. That accommodates bicycle and foot traffic, but limits most vehicle access.

Route of West Fork Greenway between River Grove Park and Edgewater Park.

The newest portion of the trail now extends from the Community Center to Hamblen Road via Timberline Pass, Timberline Drive, Aqua Vista and Burning Tree Court. The last street terminates at Hamblen, just west of the old Forest Cove Golf Course.

A final leg will extend west to Precinct 3’s Edgewater Park, paralleling Hamblen Road, but south of it (light purple).

Timing and Connections

Timing for the final leg has not yet been determined. Houston Parks Board eventually hopes to connect multiple waterways and adjacent hike and bike trail systems in the northern part of Harris County. 

For instance, this project will connect to the Spring Creek Greenway across the old US 59 pedestrian bridge. When complete, it will create one of the longest urban hike-and-bike trail networks in the United States.

Photos of Newest Leg of West Fork Greenway

The pictures below, taken on 1/3/23, show the state of the most recent construction.

Landscaping along new trail (formerly part of Aqua Vista Drive. The trail is half the width of the old street. It should accommodate both hikers and bikers.
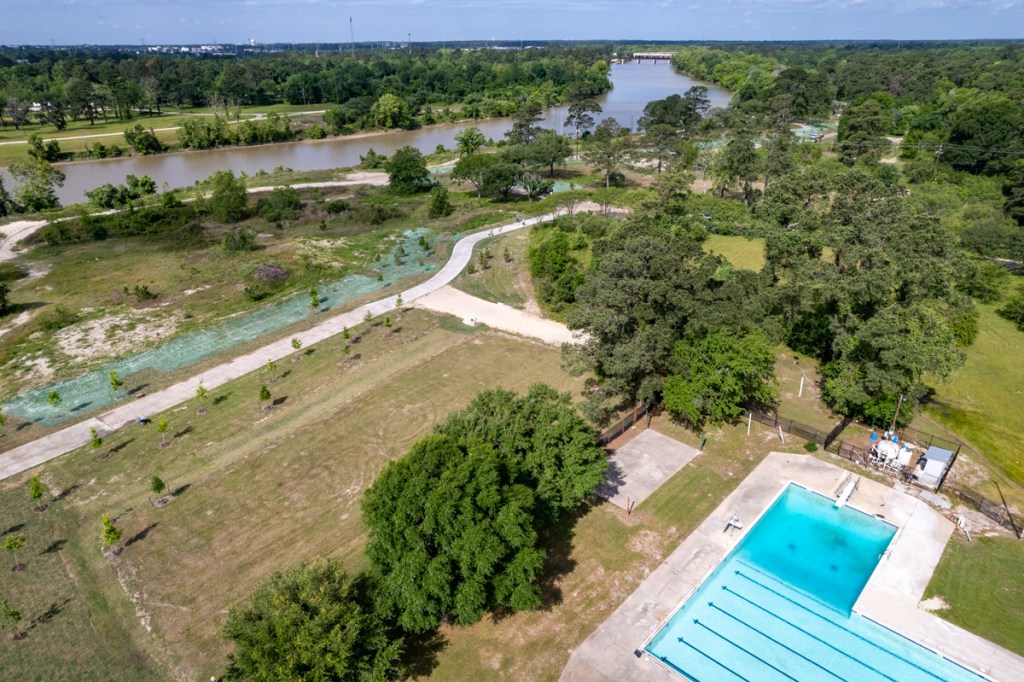
Construction on Marina Drive and Timberline Pass. Forest Cove Community Center and Pool in upper left. Looking East.
Reverse angle. Looking south from over Forest Cove Pool.
Looking west from the former turnaround at the end of Aqua Vista.
Facing west at trail connecting old Forest Cove townhome complex with Burning Tree Court. The latter turns north (right) and terminates at Hamblen Road.

More News to Follow When Plans Become Clear

The Parks Board plans to use some of the areas in the old townhome complex for parking. The fate of other streets remains unclear. Likewise, Harris County Precinct 3 has not yet announced plans for the long-awaited Edgewater Park. Harris County Flood Control District which bought out the townhome properties said it plans only to let the area return to green space.

Edgewater Park and this trail were one of the first good things to come out of Harvey. I just hope I live long enough to see them finished! Eventually, they will make a tremendous community asset.

Posted by Bob Rehak on 1/6/23

1956 days after Hurricane Harvey