A February update by Harris County Flood Control District (HCFCD) on the status of the 2018 Flood Bond showed that 35% of the way into the program (42 out of 120 months), 19.4% of the funds from all sources (including grants and partnerships) had been spent. That percentage was based on $967 million spent out of $5 billion projected.
Cost of Studies vs. Construction
While one percentage seems to lag the other by a factor of almost 2X, HCFCD estimates it is virtually on schedule. That’s because studies conducted up front cost far less than construction. And only 44 of 181 Bond program projects have entered construction at this point (24%). As more projects enter the construction phase, the pace of spending should accelerate.
From High-Level Summary to Nitty-Gritty Detail
The 13-page update features three major sections:
Summary statistics for the entire bond program
Project flow charts showing status of all projects
Watershed maps showing the amount spent to date; funded to date; and the values of all active maintenance and capital projects.
Spending by watershed on HCFCD flood bond projects through the end of February 2022.
Skewed Distribution of Capital Improvement Projects
Out of 75 active capital improvement projects, I counted only 13 in Precincts 3 and 4 which have Republican commissioners. Those contracts totaled only about $82 million out of about $249 million. That’s a testament to how thoroughly the Democrat-controlled Commissioners Court has relentlessly tweaked the Equity Prioritization Framework. For instance…
In northeastern Harris County, the update shows only two active capital projects valued at a whopping $1,000 each.
Of the 13 active capital projects in Precincts 3 and 4, six are E&R contracts valued at just $6,125 altogether. See page 13. The report lists no E&R contracts in Precincts 1 and 2.
Excavation and removal contracts let contractors sell dirt they remove from a site as a way of making back their normal profit margin. They’re a good deal for taxpayers as long as the demand for fill dirt remains high. But if demand slows, excavation progress could stall. In other words, they come with uncertainty attached.
Breakdown of San Jacinto Watershed Projects
Of ten bond projects listed in the San Jacinto Watershed, schedules show:
The February report did not address a method of distribution for $750 million allocated by HUD and the GLO for flood mitigation to Harris County. The award happened on March 18, 2022 and will likely be covered next month.
Posted by Bob Rehak on 3/30/2022
1674 Days since Hurricane Harvey
https://i0.wp.com/reduceflooding.com/wp-content/uploads/2022/03/Screen-Shot-2022-03-30-at-5.22.09-PM.png?fit=1844%2C1402&ssl=114021844adminadmin2022-03-30 17:55:032022-03-30 21:57:58Flood Bond Progress: 35% Time Elapsed, 19.4% Money Spent
In the rush to mitigate flooding after Hurricane Harvey, most people agreed that we should attack the areas with the worst flooding first. While almost everyone agreed with the “worst first” mantra, no one defined it – until after the flood bond passed.
Alternative Ways to Define “Worst First”
How would you define the “worst” flooding? The area with the:
Most flooded homes?
Most frequent flooding?
Most damage in dollar terms?
Largest population living in a 100-year floodplain?
Most low-to-moderate income residents who can least afford to fix their homes?
Largest minority populations?
Highest Social Vulnerability Index (SVI)?
Most damage to infrastructure (bridges, hospitals, grocery stores, schools, sewage treatment plants, etc.)?
Highest water above the tops of banks in a widespread storm like Harvey?
You could make valid arguments for each. And people have – almost from the day the flood bond passed – as they fought for more funding for their watersheds.
Yesterday, as I reviewed a doctoral thesis from a student at the Colorado School of Mines, I saw a graph that compared the height of the Harvey flood at the San Jacinto West Fork and US59 to other rivers/streams in the region. The West Fork flood towered above the others. So it made me wonder. How did the flood at that location compare to other streams and bayous in Harris County?
Click on the “For more information” link in the pop-up box.
On the new page (dedicated to historical information about that gage), click on the stream elevation tab.
Note the “flooding likely” elevation. This roughly coincides with the top of bank, though banks can vary slightly.
Scroll down to the bottom of the page and note the elevation of the flood at that location during Hurricane Harvey.
Subtract the “flooding likely” level from the Harvey level, to determine the feet above flood stage in Harvey.
Click on the drop-down box with the gage information to compare the same stats for additional gages.
North Harris County Had Highest Floods
This morning, I compiled the data for 33 gages. The chart below shows what I found. Of the gages I sampled, the four highest floods all occurred in the upper San Jacinto River Basin: West Fork at 59, Spring Creek at 45, Cypress Creek at Cypresswood, and West Fork at 99. Also note the preponderance of high water along Greens Bayou at numerous locations.
“Feet above Flood Stage” by itself won’t tell you which area had the worst flooding during Harvey. It’s just one measure. You must consider other factors, too, such as those listed above.
One must also acknowledge the role that topography plays in a chart, such as this. A narrow floodplain with steep banks can force water higher. A wider floodplain through a flat area allows water to spread out, lowering the height of floodwaters.
Variations in rainfall across an area can also skew results.
And finally, I didn’t click on every gage in the region. There are hundreds. You wouldn’t have been able to read the chart because the type would have been so small. So investigate on your own and let me know what you find.
Need for Active Discussion/Debate in Upcoming Elections
The Harris County Community Flood Resilience Task Force just voted to change the way “worst first” is calculated – again! The highest correlation between funding and all of the other factors I have evaluated is now with low-to-moderate-income population. It’s not with damaged structures, dollar damage, watershed size, or population density.
If you want to ensure that outlying areas get their fair share of flood mitigation dollars in the future, you need to demand them when you go to the polls this fall.
Posted by Bob Rehak on 3/29/2022
1673 Days since Hurricane Harvey
The thoughts expressed in this post represent opinions on matters of public concern and safety. They are protected by the First Amendment of the US Constitution and the Anti-SLAPP Statute of the Great State of Texas.
https://i0.wp.com/reduceflooding.com/wp-content/uploads/2022/03/Feet-Above-Flood-Stage-in-Harvey-e1699502224912.png?fit=1100%2C729&ssl=17291100adminadmin2022-03-29 15:57:372022-03-30 10:13:01How Do You Define “Worst First”?
Today, the U.S. Department of Housing and Urban Development (HUD) approved the Texas General Land Office’s (GLO) amended plan for Community Development Block Grant Mitigation (CDBG-MIT). The amended plan allocates $750 million in funding for Harris County and an $488 million to the Houston-Galveston Area Council for additional mitigation projects in the region. The funds allocated to the county should now mean that the 2018 flood bond is fully funded, if numbers provided last month on partner funding to date are accurate.
George P. Bush Quote on Process
According to a press release issued by the GLO at 7PM, 3/18/22, “Ensuring Texans receive disaster recovery and mitigation funding in a timely manner to recover from Hurricane Harvey has always been my top priority,” said GLO Commissioner Bush. “The Biden Administration’s politically weaponized Department of Urban Development and Housing has forced us to fight through mazes of red tape to secure this direct allocation for Houstonians. I will continue to fight to send money to Texans as quickly as possible. The $750 million allocation will go directly to Harris County for projects that help mitigate future flooding events, creating a stronger more resilient Texas.”
George P. Bush, Commissioner, Texas General Land Office, 2019 photo
$1.138 Billion Total
HUD’s approval of the latest Harvey Action Plan brings the total infrastructure and mitigation investments in Harris County to more than $1.1 billion. HUD’s approval of the GLO’s plan to provide $750,000,000 to Harris County is in addition to HUD’s direct allocation of $61,884,000 to the City of Houston, plus $117,213,862.96 in CDBG-MIT awards for Harris County projects, plus $209,221,800 in infrastructure funds from CDBG-DR, equals $1,138,319,662.96 in total investment in projects within Harris County. Additionally, H-GAC continues to develop its method of distribution on more than $488 million for mitigation projects within the greater Houston region.
Bush first requested a direct allocation for Harris County in May of 2021 after the county received very little money from the first round of competition for HUD. A direct allocation would have allowed Harris County to work directly with HUD and taken the GLO out of the loop. However, HUD reportedly insisted that the GLO remain involved. Subsequently, the GLO developed a 650-page action plan for the $750 million. However, HUD found it insufficient. As of early this week, the action plan exceeded 1000 pages, according to a GLO spokesperson. That apparently provided HUD what it needed. HUD notified the GLO in a letter received after 5PM today.
Method of Distribution Must Still be Developed
However, Harris County won’t get all the money immediately.
Since last November, H-GAC has been developing something called a MOD (Method of Distribution) for its allocation. However, according to the GLO, because of the expense involved, Harris County has delayed developing its MOD until the the award was approved by HUD.
Harris County’s next step will be to develop its MOD which describes where the money will go, how it will be used, and who will get it. GLO will review that and forward it to HUD. After HUD approves the MOD, HUD still won’t write a check for $750 million to the county. The money will be reimbursed to the county in batches as it is spent on approved projects.
Flood Bond Close to Fully Funded Even without Resilience Trust
Still, this will go a long way toward fulfilling the potential shortfall in partner funding for the Harris County Flood Bond. Of the original $5 billion bond, half is being paid for by Harris County taxpayers. The County hoped to get local, state, and federal partners to fund the other half.
Last July, when it looked like the $750 million might not materialize, Harris County Commissioners approved a Flood Resilience Trust that committed $833 million from the Toll Road Authority and other Harris County sources of funding. That, along with partner funding already committed, was enough to keep construction of Harris County Flood Bond projects rolling through approximately 2026.
From a presentation to the Harris County Community Flood Resilience Task Force in February 2022.
Today’s approval should make the flood bond fully funded if the numbers above are accurate. That should come as good news for all citizens who have been fighting for limited dollars. With money in the trust, this should accelerate mitigation projects throughout the county. And even fund some not identified in the original bond!
Posted by Bob Rehak on 3/18/2022
1662 Days since Hurricane Harvey
https://i0.wp.com/reduceflooding.com/wp-content/uploads/2022/03/George_P._Bush_crop.jpg?fit=930%2C1549&ssl=11549930adminadmin2022-03-18 20:45:212022-03-18 21:05:20HUD Approves $750 Million to Harris County for Flood Mitigation
New data obtained from Harris County Flood Control District via a FOIA Request breaks down flood-mitigation funding by watershed through the end of 2021. It shows where your flood-bond money is going. It also debunks some popular myths. Those include the oft repeated:
Rich watersheds get all the funding; poor watersheds get none.
Partner funding favors rich watersheds because home values are higher.
HCFCD has historically discriminated against low-to-moderate income (LMI) watersheds.
Eight out of 23 watersheds in Harris County have a majority of residents that fall into the LMI category. That means a majority make less than the average annual income for the region. As the data below shows, those eight LMI watersheds get the vast majority of county, partner, and total funding. In fact, four have received 54% of total flood-mitigation funding since 2000.
Funding now correlates more highly with LMI population than damage!
Before I dive into the data, though, let me point out that between the 3Q21 and the end of last year, the county changed the way it compiles historical data. Instead of using the start/stop dates in project management software and reporting only completed projects, the county is now using invoice dates. This produces much higher accuracy. Dollars do not spill over from one period into another. The new data also reflects spending on projects that are ongoing, but still open.
In response to my FOIA Request, the county provided spending using both the old and new methods. They differ by roughly $615 million. Of that, approximately $215 million reflects actual fourth-quarter spending and $400 million reflects the change in when expenses are recognized.
Spending by Watershed
The rank order of spending by watershed has not changed much since last year. Several watersheds moved up or down by a place or two.
The top four are still the top four in the same order. But some of the amounts changed radically, mostly due to the change accounting. For instance, White Oak increased from $387 million to $521 million. But out of the $134 million difference, $102 million comes from when expenses are recognized.
Because this gets so confusing, and because the rank order did not change much, I will use only the new totals compiled by invoice date from now on. I will not compare old and new totals based on the different accounting methods.
Spending by watershed between 1/1/2000 and 12/31/2121 broken down by county and partner contributions, and LMI/Other watersheds.
Graphs of Spending
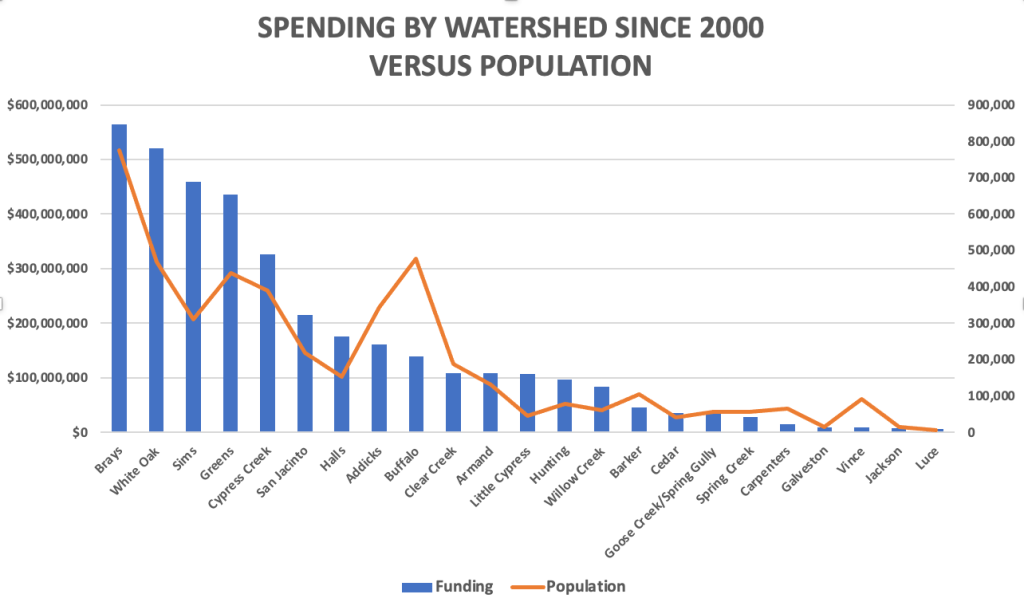
Here’s a graph of total funding by watershed since 2000, arranged from highest to lowest.
Watersheds rank ordered by amount of flood-mitigation funding received between 1/1/2000 and 12/31/2121.
Funding correlates with population. But you can see notable exceptions below. Some watersheds get far more funding than their proportion of the population, i.e., White Oak, Sims and Greens. Others get far less.
Spending is not allocated proportionately to population in all cases. Six out of eight LMI watersheds received more funding than their population alone would justify.
But population alone does not tell the whole story. Some watersheds are huge and some small. So I also looked at population density per square mile. The curves correlated even less.
Graphing population density vs. total spending shows more variance. Of the eight LMI watersheds, four (Brays, White Oak, Sims, and Greens) get far more than their population density alone would dictate.
As we saw last year, funding flows primarily to damage. The chart below plots funding versus the total number of structures in each watershed damaged in five major storms (Allison, Tax Day, Memorial Day, Harvey, and Imelda). The slope of the curves closely match. But several major exceptions exist.
Historical Discrimination?
Many community groups from LMI neighborhoods have alleged historical discrimination in the distribution of flood-mitigation funding. I just don’t see it. All of the pie charts below take into account all funding between 1/1/2000 and 12/31/2021 based on invoice dates.
The county itself sent almost 60% of its flood-mitigation funding to one third of the watershedswith majority LMI populations.An even larger percentage came from partner funding.Whether you look only at county funding, partner-funding, or the total, the picture is still roughly the same.One third of the watersheds get almost two thirds of the funding.Top 4 include Brays, White Oak, Sims and Greens. All have an LMI percentage higher than 50%.
LMI Population Now Correlates Higher with Funding than Damage
A coefficient of correlation of 1.0 is considered perfect. A good example: between gallons of gas in your car and the distance they will take you.
As a result of the constant tweaking of the equity funding formula, “Population” and “LMI Population” now correlate more highly with “Funding” than “Damage.” The correlation between “Funding since 2000” and:
Population Density = .54
Damage = .85
Population = .87
LMI Population = .89
Statisticians consider all of the last three very high.
Tonight, members of the Harris County Community Flood Resilience Task Force will vote whether and/or how to recommend changes to the equity funding formula for the third time in three years. On the table for discussion: partnership dollars.
One of the proposals under consideration is NOT to consider potential partnership funding. Said another way, taxpayers would pay for projects out of pocket rather than wait for federal and state dollars to filter down to the county level.
The main argument FOR this? Low-to-moderate income neighborhoods would not have to wait for HUD or FEMA dollars to begin construction.
The main argument AGAINST? Partnership dollars have funded roughly one-third of all flood-mitigation projects in Harris County since 2000.
So saying that you’ll bypass partnership dollars could eliminate one third of all flood-mitigation funding unless you want to increase taxes.
A highly publicized setback in the Texas GLO competition for HUD funds last year delayed a recommended $750 million award to Harris County. The delay hurt, but there’s still hope. HUD did not reject the GLO application. They just said they needed additional documentation. The two agencies have met several times since. GLO has already started reformulating its proposal and expects a decision as early as next month.
Should We Turn Our Back on Hundreds of Millions?
So should the plan now be to turn our noses up at the $1.15 billion that the county has received in partnership dollars since 2000. Should we say, “Let’s go it alone!” from now on? Should we stand by while that money goes to other areas that need it less?
LMI Neighborhoods Would Be Hurt the Most
Another argument proposed for ignoring the partnership funding: it disadvantages LMI neighborhoods because affluent neighborhoods have higher home values and therefore get higher Benefit Cost Ratios.
$797.4 million out of $1.149 billion in total partnership funds went to LMI watersheds. Percentages just happen to equal those in graph above.
While the logic sounds plausible, the only problem is that the eight LMI watersheds in Harris County (those where a majority of residents make below the average income for the region) actually receive 69% of all grants. Since 2000, they have received $797 million out of $1,149 million. So one third of the watersheds received more than two-thirds of all partnership funding.
That closely reflects the percentage of all spending (local + partnership) since 2000. The eight LMI watersheds received $2.3 billion out of $3.7 billion – 62%. Harris County has 23 watersheds in total.
The data clearly does not support discrimination against LMI neighborhoods in either partnership or overall spending. Greens Bayou for instance has received more money overall ($436 million) than all but three other watersheds since 2000. It also ranks #3 in partnership funding with $200 million. Partner dollars paid for 46% of the projects there.
Placing a Third of All Projects in Jeopardy
Eliminating partnership funds and relying on local funds will disadvantage Harris County taxpayers everywhere or cause a third of projects to be eliminated.
Date of Damage Assessments, Mitigation Also Crucial
Partnership funds can make a huge difference in watersheds in terms of flood reduction. Sims Bayou was the only bayou in Harris County that didn’t flood during Harvey. Of the $201 million it received in partnership funds since 2000, $198 million came before Harvey.
Sims also illustrates the problem with another proposal on the table tonight – using flood data going back to 1977 to determine who deserves more money. That will artificially disadvantage outlying neighborhoods which didn’t even exist in 1977. And it will funnel money into a watershed that has already largely been remediated.
When people come at these decisions from an ideological perspective without looking at data, it hurts everyone…sometimes even themselves.
My personal opinion is that when people talk about partnership funding, the debate should be, “When do you go it alone?” not “Should we go it alone?”
Ever wonder where your tax and flood-bond dollars go? Harris County Flood Control District shows all its active projects on one page. You can review those projects in tabular form or on a map. You can even click on links to learn more about each project. Or explore it in depth by going to its related “watershed” page.
Active maintenance (orange) and capital (purple) flood mitigation projects in Harris Countyas of 1/4/22 shown against backdrop of precinct boundaries adopted on 10/28/21.Purple = P1, Green = P2, Red = P3, Yellow = P4.
Paragon of Transparency
HCFCD’s Active Projects page is a paragon of government transparency. You can even switch out base maps to see where the projects fall in terms of the old or new precinct boundaries approved on October 28, 2021.
One side benefit of the two base maps is that they give you a clear, unambiguous view of the redistricting boundaries.
Zoom far enough in on the map and you can even see your street, home, and the drainage features around you (streams, channels, storm sewers, etc).
Physically seeing work in progress is difficult. Construction zones are dangerous and often fenced off or hidden behind trees. They’re also so large that seeing them from an entrance at ground level is almost impossible.
The good news: the projects almost always include hike and bike trails, like the one below, which you can enjoy upon completion.
However, if you want to monitor work in progress, your best bet is a drone.
Good News from Commissioners Court Today
Commissioner Tom Ramsey introduced a motion to affirm Commissioners’ intentions to complete all projects in the flood bond. Despite several previous attempts to cancel projects and change bond priorities, commissioners voted unanimously to complete the entire bond package. Ramsey will be the new commissioner for the Lake Houston Area if the Ellis-3 redistricting plan survives court challenges. See the sprawling red area on the map above.
Posted by Bob Rehak on 1/4/2022
1589 Days since Hurricane Harvey
https://i0.wp.com/reduceflooding.com/wp-content/uploads/2022/01/HCFCD-Actived-Project-Map-12.21.jpg?fit=1200%2C793&ssl=17931200adminadmin2022-01-04 16:43:232022-01-04 16:48:56How to Find HCFCD’s Active Projects in Your Area
To compensate for the potential shortfall, Commissioners established a flood-resilience trust with money from other Harris County departments and changed equity guidelines in June.
To help you follow this story, I make quarterly FOIA requests for Harris County Flood Control District spending and post the analyses on a dedicated funding page.
Sand-Mining Best Management Practices
Activists led by the Lake Houston Area Flood Prevention Initiative and the Bayou Land Conservancy petitioned the Texas Commission on Environmental Quality (TCEQ) to establish best management practices for sand mines in the San Jacinto watershed. We didn’t get everything we wanted, but we got a vast improvement over what we had. And the new BMPs may help reduce erosion that contributes to future floods in this area.
West Fork Sand Mine illustrates need for vegetative controls to reduce erosion.
May 9, 2021, was 1349 days after Hurricane Harvey ravaged Texas and the Gulf Coast. That’s the number of days it took the US and its allies to win World War II. But during that time we’ve had few victories in the fight against future flooding in the Lake Houston Area with the exception of dredging, So far, we’ve mainly completed studies. And many of those are still in the works.
For instance, the City of Houston has been studying ways to increase the release capacity of the Lake Houston Dam. Right now, the release capacity is one-fifteenth that of the gates on Lake Conroe. That makes it difficult to shed water quickly before and during floods. FEMA gave the City money to study the problem, but is still finalizing recommendations. The City hopes to make an announcement in January.
The Texas Attorney General is still suing the Triple PG Sand Mine in Porter on behalf of the TCEQ. There has been little movement on the case in the last 18 months. The mine’s owner changed legal counsel in July 2020. A TCEQ representative says the AG has not given up. The two sides are still in discovery.
Approximately 1700 homeowners in the Lake Houston Area sued sand mines for contributing to flooding during Harvey. The cases were consolidated in the 281st Harris County District Court under Judge Sylvia Matthews. She recently set deadlines in the first half of next year for motions, depositions, joinder, expert witness testimony and more. The case is known as “Harvey Sand Litigation.”
Various lawsuits against the SJRA for flooding during Harvey are still working their way through the legal system.
Kingwood residents reached a settlement with Perry Homes, its subsidiaries and contractors this year over two floods that damaged hundreds of homes in Elm Grove and North Kingwood Forest during 2019. The incidents had to do with development of Woodridge Village, just across the Harris/Montgomery County line.
East Fork Dredging. Photographed in early December between Huffman and Royal Shores in Kingwood.Looking south toward Lake Houston.
Bens Branch and Taylor Gully Cleanouts
In Kingwood, HCFCD finished excavating both Bens Branch and Taylor Gully to help restore their conveyance. Through gradual sediment built up, both had been gradually reduced to a 2-year level of service in places. That means they would come out of their banks after a 2-year rain.
Final phase of Bens Branch maintenance between Kingwood Drive and Rocky Woods. Note Kingwood High School in upper right.
GMA-14 will take a final vote on January 5 on the final DFCs. You still have time to protest.
Posted by Bob Rehak on 12/31/2021
1585 Days since Hurricane Harvey
https://i0.wp.com/reduceflooding.com/wp-content/uploads/2021/06/20210303-RJR_5778.jpg?fit=1200%2C800&ssl=18001200adminadmin2021-12-31 10:48:382021-12-31 11:09:51Top Stories of 2021 in Review
A myth being promulgated in Harris County Commissioners Court and certain low-to-moderate income (LMI) watersheds these days goes something like this:
The FEMA Benefit/Cost Ratio (used to rank grant applications for flood-mitigation projects) favors high-dollar homes.
That disadvantages less affluent, inner-city neighborhoods compared to more affluent suburbs.
Therefore, less affluent neighborhoods get no help and the more affluent neighborhoods get it all.
This post busts that myth. But it won’t stop activists from demanding more “equity.”
If you look at all flood-mitigation spending in Harris County since 2000, on average, less affluent watersheds already receive 4.7X more partner funding per watershed than their more affluent counterparts.
Analysis of data obtained via FOIA request
Myth Ignores Other Factors, Frequently Leaps to Wrong Conclusions
Like much of political discourse these days, the myth focuses on a narrow sliver of truth, ignores other factors, and frequently leaps to the wrong conclusions.
An analysis of Harris County Flood Control District data going back to the start of this century shows how far off the myth can be.
Today, I focus on partner grants because they represent such a huge percentage of the flood-bond budget and because there is so much misinformation floating around about them.
And I will look at partner funding from the standpoint of outcomes, not just processes (as in the myth).
Methodology for Analysis
For this analysis I obtained Harris County Flood Control District spending data between 1/1/2000 and 9/31/2021 via a Freedom of Information Act (FOIA) request. I requested the data by watershed, decade, pre-/Post Harvey, source of funding (local vs. partner), and type of activity (i.e., engineering, right-of-way acquisition, construction and more). I cross-referenced this with other data such as flood-damaged structures, population, population density, and percentage of low-to-moderate income (LMI) residents.
When considering grants, the percentage of LMI residents in a watershed takes on special significance. Department of Housing and Urban Development (HUD) grants often require high percentages of LMI residents in the area under consideration.
In the charts below, you will see references to watersheds with LMI populations above and below 50%. Above 50% means more than half the residents in the watershed have an income LESS THAN the average for the region. Below 50% means more than half the residents earn more than the regional average.
Harris County has 23 watersheds. Eight have LMI percentages above 50% (less affluent). Fifteen have LMI percentages below 50% (more affluent).
When reviewing the charts below, pay particular attention to the italicized words: Total, Partner, and On Average. They represent three different ways to look at the same question: Do housing values disadvantage an area when applying for grants?
For this analysis, I focused only on the long term, since decisions on more than a billion dollars in flood-bond grants are still outstanding.
FOIA Analysis Contradicts the Popular Myth
One of the first things you notice when you look at watersheds above and below 50% LMI, is that the eight least affluent watersheds have gotten more than 60% of all dollars actually spent on flood mitigation since 2000.
Less affluent watersheds, despite being half as numerous, received 60% of all dollars since 2000.
Because the allegation was that partnership grants favored affluent areas, I then analyzed whether partner dollars went mostly to affluent or less-affluent watersheds. The answer is less affluent…overwhelmingly.
More than 70% of all partner dollars in the last 22 years went to the eight less-affluent watersheds.
The last observation by itself is telling. But because of the widely different number of watersheds in each group, I also wanted to calculate the average partner dollars per watershed in each group. This blows the “rich neighborhoods get all the grants” argument to pieces. Less affluent watersheds got, on average, 4.7X more.
Dividing the total partner dollars by the number of watersheds in each group shows that less affluent watersheds average 4.7X more than affluent ones.
This busts the myth. But digging even deeper into the data reveals two things: wide variation between sources of funding and withinLMI groupings.
USACE Funding Skews Partner Totals
The U.S. Army Corps of Engineers (USACE) accounts for much of the partner funding. USACE has provided significant funding for projects in the Sims, Brays, White Oak, Hunting, and Greens Bayou watersheds. The Clear Creek watershed will also soon see work on a new USACE project. USACE has completed its planning process and proved positive benefits to national economic development. That made projects worthy of Federal investment.
Halls Bayou: Digging Deeper
The Halls Bayou watershed also went through the USACE planning process, but the results did not show enough flood-damage-reduction benefits to outweigh the costs of the proposed projects. Thus, the Halls Bayou watershed currently has no USACE-funded projects.
Despite that, Halls has received more partner funding than 16 other watersheds since 2000. Only two watersheds in the affluent group of 15 received more partner funding. See the table below.
Total and partner spending by watershed since 2000 arranged in order of highest to lowest LMI percentages.
USACE also evaluated the more affluent Buffalo Bayou; results showed that costs outweighed the flood-damage-reduction benefits there.
Despite Halls having the highest percentage of LMI residents in Harris County, Halls has received more total funding and 2.5X more partner funding than Buffalo Bayou in the more affluent group.
FEMA Considers More than Home Values, Not All Grants Come From FEMA
While it’s true that FEMA considers housing values as a factor in benefit/cost ratios, benefit/cost ratios (BCRs) also consider factors such as:
The number of structures damaged
Threats to infrastructure
Proximity to employment centers
Need for economic revitalization
Percentage of low-to-moderate income residents in an area
Number of structures that can be removed from the floodplain by a project.
USACE funds dozens of different types of flood-mitigation programs. Many support national defense, the national economy, strategic interests, the environment, commerce and navigation.
So don’t settle for soundbites. They often mislead.
Posted by Bob Rehak on 12/30/2021
1584 Days since Hurricane Harvey
https://i0.wp.com/reduceflooding.com/wp-content/uploads/2021/12/Screen-Shot-2021-12-29-at-4.53.47-PM.png?fit=1366%2C740&ssl=17401366adminadmin2021-12-29 21:28:052021-12-30 14:37:20Equity Myth Buster: “Rich Neighborhoods Get All the Flood-Mitigation Funding”
Making conclusions based on hearsay or a glance at a chart could be self-defeating. There is more to the story.
Partner Funds Make It All Possible
We anticipated 43% of the dollars in the flood bond would come from partners such as FEMA, HUD and the TWDB. We also anticipated it would take another 16% in local matching funds to attract the 43%. So 59% of the flood bond revolved around partner funds. Only 41% was local cash to pay for projects totally out of pocket.
From the project spreadsheet approved by voters in 2018.
Excluding Partner Funds Could Accelerate Construction in LMI Neighborhoods, Deny Others
David Berry, the County Administrator, proposed the partnership exclusion to accelerate construction of projects in Low-to-Moderate Income (LMI) watersheds, such as Halls. Halls, in particular, has waited on grant awards from the US Department of Housing and Urban Development (HUD) longer than most.
A HUD decision is expected sometime in January, according to the Texas General Land Office, which distributes HUD grants in Texas. So it’s not clear how much residents gain by Berry’s proposal. And they could lose big.
Most of the HUD grant applications for Halls are on a 90:10 basis, meaning the local share is only 10%. So excluding these grants means increasing the local contribution for that portion of the budget by 9X. That could cost local taxpayers hundreds of millions of dollars. For instance, HCFCD budgeted $500 million for Halls drainage alone. 90% of that is $450 million…to cover 2.4% of the county!
The effect would be to take money from affluent watersheds – which don’t qualify for HUD 90:10 grants – and shift it to LMI watersheds. No one then would get the grants and something would have to give somewhere down the road.
One Third of Way Through Flood Bond: Good Time to Take Stock
At the end of this month, exactly one third (3 years, 4 months) of the 10-year flood bond will have expired. So this is a good time to review spending versus projections.
Thirty-three percent of the way in, we’ve expended a little more than 16% of the flood-bond funds. While that may sound like a slow start, one must consider project lifecycles. Projects start with studies (feasibility, preliminary engineering, final engineering, design). These determine and validate cost projections. They also form the basis for grant applications, a plan and bids. But they are the least expensive part of a project. Together, they comprise only one eighth of project costs.
The expensive parts follow. They include right of way acquisition and construction. Those comprise more than three-quarters of all project costs. See the pie chart below which shows averages for the last two decades.
Average percent of costs in various project stages since 2000. ROW (Right of Way) Acquisition includes purchase of land upon which projects will be built.
For most flood-bond projects, we’re just now getting to the expensive phases. So I wouldn’t worry too much about that 16% overall average right now.
Spent/Unspent Funds by Watershed Gives Greater Insight
You can gain more insight by looking at spent and unspent dollars in each watershed.
Height of bars shows total amount budgeted per watershed in flood bond. Blue areas show dollars spent to date. Does not include any funds spent prior to flood bond.
From the charts above and below, you can see that spending rates vary widely among watersheds. Brays has consumed 57% of its budget already. On the opposite end of the spectrum, Sims has consumed just 1.6% of its. Why the wide variation?
To understand, we need to look at unique circumstances in each watershed. The chart below makes it easier to see actual spending as a percent of the budget that voters approved for each watershed in the flood bond.
Percentages represent the portion of budget spent to date. See discussion below for explanations of ranks.
The height of some of the bars above could be “predicted” by referring to the flood bond equity prioritization framework. Brays and Greens Bayous, for instance, are two watersheds with high percentages of LMI residents (58% and 57% respectively).
But others cannot. More than half the residents in Goose Creek/Spring Gully, Hunting, White Oak, Halls, Vince and Sims Watersheds also qualify as LMI. But dollars spent to date in those watersheds are far lower as a percent of the total budget. To see why, you need to put the numbers in a bigger context that includes:
Investment Prior to Flood Bond
Size of Total Budget for Each Watershed
Percentage of Partner Funds
Grant Application Status
Stage of Project Lifecycle
Bigger Context Shows Reasons for Variance
Brays and Greens had a large number of shovel-ready projects that had already been studied and approved when the flood bond passed. They were just waiting for dollars to become available. So they had head starts.
Other factors explain LMI watersheds further down the curve:
Sims received $380 million in federal funding for 23 Army Corps projects that finished construction by 2015. As a result, Sims was the only bayou in Harris County that stayed within its banks during Harvey. None of that spending shows up in the Bond Program charts. Because it’s already done!
White Oak received full funding in the Bi-Partisan Budget Act of 2018. The Army Corps also started addressing many projects there before the flood bond.
Vince lies wholly within the City of Pasadena and is primarily the City’s responsibility.
Halls is the poorest watershed (71% LMI) and has only spent 6% of its projected budget to date. Lest you attribute this to racism, understand that the bond allocated more than HALF A BILLION DOLLARS to Halls. In percentage terms, the $29 million dollars spent to date looks small. But in absolute dollars, it outranks 15 other watersheds.
Far more affluent watersheds – such as Buffalo Bayou, Cedar Bayou, the San Jacinto River, Barker, Willow Creek, Armand Bayou, Galveston, Luce Bayou and Jackson Bayou – have each received fewer dollars from the flood bond than Halls.
HCFCD had just finished a watershed plan for Halls Bayou in 2018 when the flood bond passed. That explains the size of the watershed budget as well as the late start compared to Brays, White Oak, Greens, and Sims.
Other factors also explain affluent watersheds further up the spending curve, such as Little Cypress. HCFCD started working on that watershed long before the flood bond, too. Dollars spent to date on Little Cypress primarily reflect right-of-way acquisition costs, not construction. It’s also important to understand that the total budget for Little Cypress is only 37% of the total budget for Halls.
Creating a Win-Win For Everyone
In another three years and four months, these charts will look totally different than the ones you see today. Construction costs will surge for some and be long gone in the rear view mirror for others.
In my opinion, we need to stop creating chaos with endless tinkering in the bond program. The people have spoken. Leaders should listen. Let’s stop changing the allocation formula, focus on construction, and work like hell to win those grants. Then everybody wins.
Posted by Bob Rehak on 12/28/2021
1582 Days since Hurricane Harvey
https://i0.wp.com/reduceflooding.com/wp-content/uploads/2021/12/Flood-Bond-Allocation.jpg?fit=1200%2C804&ssl=18041200adminadmin2021-12-27 20:18:272021-12-28 13:28:32“Excluding” Partner Funds Could Lead to Shortfalls in Flood-Mitigation Funding
At the last meeting of Harris County Commissioners Court, Harris County Flood Control District (HCFCD) released a flood-bond update that shows spending through the end of November 2021. It provides a quick and easy way to see what your money is being spent on and where it is going. This differs from data reported recently from my FOIA Request. That data goes back to 2000 and looks at data pre- and post-Harvey, not just the start of the flood bond.
November Highlights
Below, some of the highlights from the November spending update:
Professional services invoices paid to date total $296 million. In November, payments totaled $338 thousand. Three quarters of that amount went to minority- or women-owned businesses.
HCFCD has awarded $354 million in construction contracts. Five more were awarded last month totaling $335 thousand.
Total spending since the approval of the flood bond through the end of November totaled $885 million. Of that, $447 million came directly from bond funds. Another $321 million came from grants. Other local funds totaled $117 million.
Three years into a ten year bond program, we’ve expended 17.9% of the anticipated total.
Home buyouts continue to drag out. HCFCD has completed 676, but 613 remain in the pipeline.
Brays Bayou still leads the dollar derby by a factor of two compared to the next three contenders. Brays has received $162 million flood-bond dollars to date. Cypress Creek, Addicks, and Greens Bayou have each received approximately half that. Then there are all others.
Where your flood-bond dollars have gone through the end of Nov 21..
Dollars spent in each watershed through the end of November.
Dollars funded in each watershed through the end of November.
Active maintenance projects and their values in December.
Active capital projects and their values in December.
The visual nature of this report makes it easy to see where your money is going at a glance.
Posted by Bob Rehak on 12/20/2021
1574 Days since Hurricane Harvey
https://i0.wp.com/reduceflooding.com/wp-content/uploads/2021/12/20211220-Funding-by-Watershed-through-Nov-21.jpg?fit=1200%2C916&ssl=19161200adminadmin2021-12-20 21:23:122021-12-20 21:40:09Flood-Bond Update through End of November 2021