Widening of Hunting Bayou, one of the poorest and most flood-damaged watersheds in the county, is kicking into high gear.
Annual Rate of Spending Almost Quadruples since Harvey
According to data obtained as part of a Freedom of Information Act (FOIA) request, Harris County Flood Control District and its partners (mainly the Army Corps and City of Houston), spent $44 million on flood mitigation in the Hunting Bayou watershed between 1/1/2000 and Hurricane Harvey.
That averaged $2.4 million per year for those 18 years. However, in the 4 years since Harvey, HCFCD has spent $37 million – more than $9 million per year.
That rate of spending averages 3.75X higher after Harvey than before.
HCFCD Spending Data Obtained via FOIA Request
Here’s a breakdown.
From FOIA Request.Hunting Bayou flood-mitigation expenditures by time period and category since 1/1/2000 through end of third quarter 2021.
Focus of Current Construction Activities
The upstream portion of Hunting Bayou parallels the south side of Loop 610 for most of its length. Where North Loop 610 turns south, Hunting cuts under it between McCarty and Wallisville Roads. From there it continues east. It then turns southeast at San Pedro Street and eventually joins Buffalo Bayou and the Ship Channel.
Note width of floodplains in red box. HCFCD is now widening Hunting between the left and right boundaries of the box.From Harris County Flood Education Mapping Tool. Blue = 100-year. Green = 500-year floodplain.
The Hunting Bayou watershed has the second highest percentage of low-to-moderate income (LMI) residents in the county (69%) after Halls Bayou (71%) immediately to the north.
Hunting also is heavily industrialized with rail yards, tank farms, manufacturing, and shipping companies. The highest points of land are the railroad tracks. Within the red box above, you can see how they affect the flood plain.
After driving around the neighborhoods along Hunting Bayou for an entire day, it appears that the worst storm damage is in the red box above. Many homes are boarded up and abandoned in this area. Others have been elevated. Some have been renovated and are waiting for the next flood.
Current Construction Photos of Bayou Widening Efforts
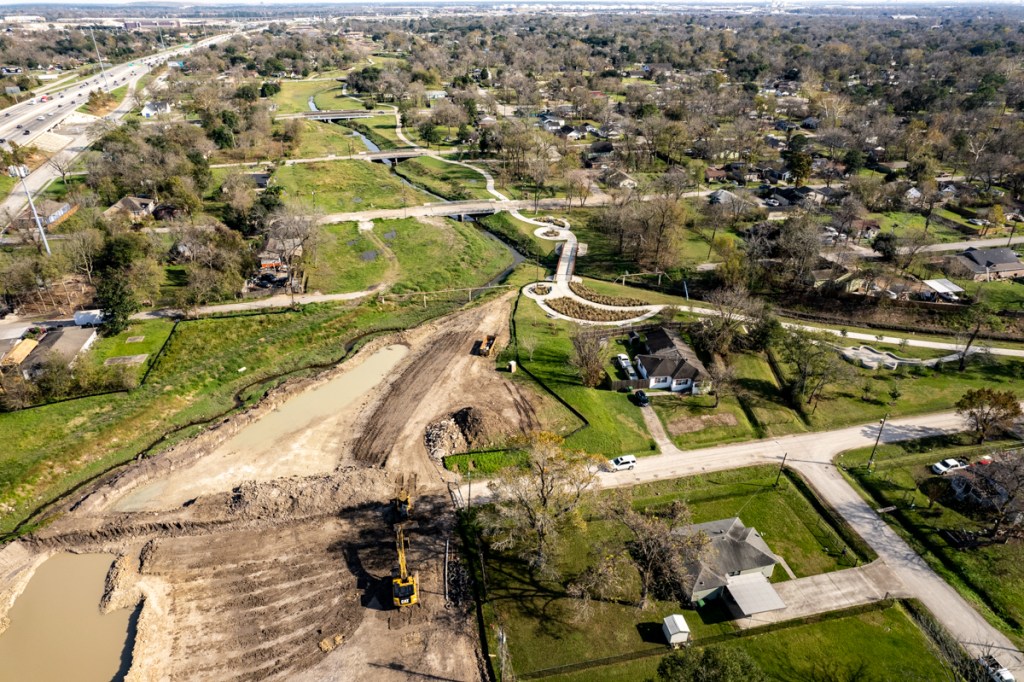
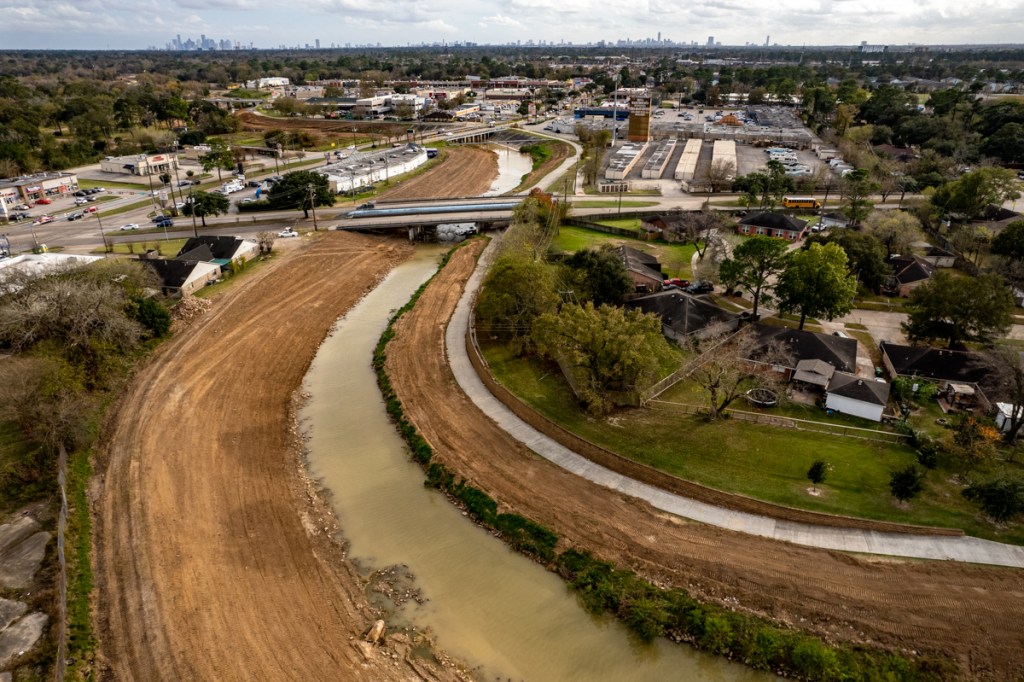
HCFCD bayou-widening efforts focus on this area right now. They extend from US59 on the west to approximately Wayside Drive on the east. Bayou widening may be an understatement. HCFCD appears to be creating a long series of connected detention basins, some more than 450 feet wide and several city blocks long that narrow at bridges.
This should help drain water from nearby neighborhoods during heavy storms. See pictures below all taken on Sunday, 12/19/2021. They generally trend from west to east, starting at US59 and heading downstream.
Looking east at first of numerous ponds along channel of Hunting Bayou. Photographed from over US59. Loop 610 is in upper left.
Looking east over Hunting Street. Loop 610 on left.Note new hike and bike trails in this and other pictures below.
Looking east from Kashmere Street at a previously excavated area now covered with grass and newly excavated areas beyond it.
Looking east from over Wipprecht Street at work in progress.
Looking east toward Lockwood from Pickfair Streetand one of the constrictions mentioned above.
Closer shot of constriction at Lockwood.
Looking east from Hutcheson Park
Opposite angle. Looking west over expanse of Hutcheson Park. Loop 610 on right.
Looking NE from the eastern end of Hutcheson Park, where Hunting cuts under 610.
Looking NE from over Loop 610 toward Homestead Detention Pond in background.Kelly Street cuts left to right through top of frame.s
Looking east from over Homestead at limit of current downstream work.
Funding Flows to Damage
Altogether, the current excavation work stretches 3.33 miles.
In the last five major storms (Allison, Tax Day, Memorial Day, Harvey, Imelda), 15,763 structures have flooded along Hunting Bayou. That ranks 7th among all Harris County Watersheds. But one must remember, that Hunting, comprises only 31 square miles. That ranks it 19th in size out of 23 watersheds. The damage per square mile ranked #2 (508.5 structures).
Another reason spending has accelerated here is political policy – namely the Equity Prioritization Framework implemented a year after the flood bond passed.
https://i0.wp.com/reduceflooding.com/wp-content/uploads/2021/12/20211219-DJI_0152.jpg?fit=1200%2C799&ssl=17991200adminadmin2021-12-19 20:53:442021-12-19 23:31:42Widening of Hunting Bayou Kicks into High Gear
Since 2000, White Oak Bayou has received $386.8 million in Harris County Flood Control (HCFCD), federal, and local partner funding. That ranks it #2 in dollars received among all 23 Harris County Watersheds, second only to Brays Bayou at $544.5 million. Data received via a Freedom of Information Act (FOIA) request, showed that these two watersheds alone have received close to a billion dollars out of $3 billion spent between 1/1/2000 and the end of the third quarter this year. Said another way…
Two watersheds out of 23 received about a third of all HCFCD flood-mitigation spending in the last 22 years.
White Oak is difficult to photograph. As with Brays, homes and apartments back up to White Oak almost the entire way. They largely conceal most of it from public view except near bridges. Those homes and apartments also conceal the magnitude of construction from public view.
A Low-to-Moderate Income Watershed
Within the watershed, White Oak has slightly more low-to-moderate income (LMI) residents (51%) than those who earn above the average for the region. Other interesting stats:
It comprises 111.1 square miles. That ranks #6 among all watersheds.
White Oak has 468,214 people. That ranks #3 among all watersheds.
White Oak ranks #3 in total damage and #5 in damage per square mile.
Continuous Improvement for Decades
Money has poured into the White Oak watershed – as it has for Brays – because of the large number of flooded structures and associated damage. White Oak has had almost 26,000 structures flooded in the last five major storms – Allison, Tax Day, Memorial Day, Harvey and Imelda. That ranks it #3 in total damage among all 23 Harris County Watersheds.
The 2018 Bipartisan Budget Act helped fund the latest round of construction shown below on White Oak as well as Hunting and Brays Bayous. All three started more than 20 years ago and advance sporadically as more money becomes available.
Fighting Constrictions of Development to Make Room for More Floodwater
The photos below show HCFCD’s and the Army Corps’ commitment to completing a number of major projects along White Oak. Residential and commercial developments pressing against the bayou along its length make that difficult. They leave little room for widening to accommodate more floodwater. As a consequence, HCFCD is forced to buy out whole subdivisions to make room for detention basins.
Regardless, I photographed an impressive amount of construction along the length of White Oak between FM1960 and West Little York. Below are 10 out of more than 120 photographs. I took them all on 12/17/2021.
White Oak Bayou widening and deepening. Photographed from Kari Court.
Note how close houses are to the channel. Making more “room for the river,” as the Dutch say, would require buying out many of the homes you see below.
White Oak Bayou photographed from over Lewis Street.
Looking upstream at White Oak from Gessner
Looking downstream from Gessner. Another example of not leaving “room for the river.” t
Looking SW across large detention basin. White Oak cuts through top of frame from left to right. Fairbanks North Houston cuts through top of frame on right.
Looking NE from over Fairbanks North Houston. White Oak cuts through center of frame. Note Greenspoint on horizon, right of center.
White Oak near Antoine, looking S toward downtown and Galleria on horizon.
White Oak from Tall Pines Drive looking SE.
White Oak from Deep Forest Drive looking downstream.
HCFCD currently has $45 million in ACTIVE construction projects underway in White Oak Bayou. But many more construction projects along the bayou are still pending buyouts to make way for more detention basins.
Of the $386 million spent on White Oak in the last 23 years, $235 million has gone to buyouts and right-of-way acquisition compared to $90 million so far for construction. White Oak buyouts have cost 2.6X more than construction. Normally, buyout and construction costs differ by only a few percentage points.
That tells you how how many homes and businesses are overcrowding the flood plain!
And that brings to mind my grandmother’s favorite saying, “An ounce of prevention is worth a pound of cure.”
https://i0.wp.com/reduceflooding.com/wp-content/uploads/2021/12/20211217-DJI_0098.jpg?fit=1200%2C799&ssl=17991200adminadmin2021-12-17 20:42:492021-12-19 11:24:48White Oak Bayou Gets A Makeover…Again
Harris County Commissioners Court considered a motion today by the County Administrator to change the prioritization of flood-bond projects for the fourth time. By a 3-2 party-line vote, they approved a proposal that could soon lead to depriving outlying neighborhoods of flood bond funding. The vote today was preliminary. Before they take a final vote, they will submit the proposal to the Community Flood Resilience Task Force (CFRTF) for input, then take a final vote in 60 days. Based on past experience, the CFRTF will likely rubber stamp the three recommendations in the proposal:
Exclusion of partner funding
Inclusion of street flooding in 500 year floodplain
Counting people not structures when measuring benefits
Exclusion of Partner Funding
The exclusion of partner funding will mean that 90% match grants from the US Department of Housing and Urban Development (HUD) will no longer be available to anyone. Inner city neighborhoods will use flood-bond money to complete their projects instead of HUD money. And more affluent, outlying neighborhoods do not qualify for HUD grants.
County Judge Lina Hidalgo, Precinct 1 Commissioner Rodney Ellis, and Precinct 2 Commissioner Adrian Garcia all admitted during debate that there wasn’t enough money to complete all the bond projects. But they voted to consider the allocation changes regardless.
Precinct 4 Commissioner Jack Cagle and Precinct 3 Commissioner Tom Ramsey also agreed there wasn’t enough money to complete all bond projects. However, they voted against the proposal.
The 3-2 vote will send the proposal to the CFRTF for input. To date, the CFRTF has rubber stamped everything proposed by Democrats that benefits low-to-moderate income (LMI), inner-city neighborhoods at the expensive of outlying neighborhoods.
That means construction funds may not be available for outlying projects by the time inner city neighborhoods complete theirs.
Those who compiled the list of bond projects were counting on approximately $2.5 billion in partner funding. The Flood Control District has already secured more than a billion just three years into a ten year bond. But this move could now jeopardize a large portion of the remaining partner funding.
Inclusion of Street Flooding
Not one project in the flood bond addressed street flooding. That is not within HCFCD’s scope of responsibility.
Regardless, Commissioner Garcia said, “People don’t care where they flood from. They just want it fixed.” He never addressed the budget issue or who was responsible for cleaning out those roadside ditches – Garcia, Ellis, Turner and other City mayors!
Expanding the scope of the bond and eliminating partner funding will mean even fewer dollars left over to address flooding in outlying neighborhoods.
I have photographed hundreds of clogged roadside ditches like these in watersheds inside Beltway 8. Dems now want to use what’s left of your flood bond money to clean them out even though the flood bond never mentioned them.
Counting People Not Structures
Typically, the objective of flood-mitigation projects is to remove structures, not people, from a flood plain. By counting people, not structures, in an evaluation matrix, you push funding toward more densely populated neighborhoods. Normally, helping more people is good. But what if the density is vertical, not horizontal?
Let me give you an example. Consider an apartment building with a hundred residents. But none lives on the ground floor.
Now consider 25 single family homes each with three people. All live on the ground floor.
Project A could take a 100 people out of the flood plain whose apartments would not flood. Project B would take 75 people out of the floodplain and prevent damage to 25 structures that would flood. Should A or B get the flood-mitigation project?
This provision would also drive funding away from outlying neighborhoods which generally have fewer apartments.
The People Spoke and Are Being Ignored
The People – with a Capital P – voted on the flood-bond and approved it overwhelmingly. Now its being repeatedly changed by a few individuals to push ever more funding to inner-city neighborhoods which already get the lion’s share. These latest moves could deprive outlying neighborhoods of construction dollars needed to complete projects.
Seems to me that the three Dems and their proxies are depriving half the county of their votes and taxes.
The two Republicans on Commissioners Court, Precinct 4 Commissioner Jack Cagle and Precinct 3 Commission Tom Ramsey, argued against the changes.
Commissioner Cagle argued that “We must do what we say. We must work on projects in the bond.” He went on, “Changing the projects included in the 2018 flood bond is a bad idea. The promises we made to voters in 2018 are sacred. While I support the concept of asking to finance more flood mitigation projects in the future, the public has to know that we can be trusted to keep our word.”
Top 4 LMI Watersheds Receive 53% of All Funding since 2000
However, when you look at spending to date and the ever-changing “equity” guidelines, we’re far from approaching anything that resembles equity. And we’re getting farther from it with each round of changes to the so-called “equity” guidelines.
Four LMI watersheds out of 23 (Greens, Sims, Brays and White Oak) have received 53% of ALL funding since 2000, yet their representatives complain about historical prejudice and demand more.
Analysis of HCFCD Spending Data from 1/1/2000 through Q3 2021 obtained via FOIA request
For the record, that’s $1.6 billion out of $3.1 billion during the period of comparison.
Top LMI Watersheds Get More than Twice as Much as Top NON-LMI Watersheds
Comparing those 4 LMI watersheds with the most dollars to the four NON-LMI watersheds with the most, we can see that LMI watersheds have received more than two dollars for every dollar received by a non-LMI watershed.
Pie represents total dollars spent among top four LMI and NON-LMI watersheds. An LMI watershed is one where more than half the residents earn below the average annual income for the region.
The four LMI watersheds receiving the most money included Brays, Greens, Sims, and White Oak Bayous.
The four NON-LMI watersheds receiving the most included Cypress Creek, Addicks, San Jacinto and Buffalo.
All dollars include HCFCD and partner spending from 1/1/2000 through Sept. 30, 2021.
Bottom 4 LMI Watersheds Get 3X More than Bottom 4 NON-LMI
At the opposite end of the spectrum, the four LMI watersheds receiving the least money have received 3X more dollars than the four lowest NON-LMI watersheds since 2000.
Comparison of total dollars spent in the four lowest LMI and NON-LMI watersheds since 2000 through the end of Q3 2021.
There are only 8 LMI watersheds hence the comparison of groups of four.
The four LMI receiving the least dollars since 2000 include Halls, Hunting, Goose Creek/Spring Gully, and Vince.
The four NON-LMI watersheds receiving the least include Luce, Galveston, Jackson and Carpenters.
But what about those other NON-LMI watersheds in the middle of the spending pack? Simple. Altogether, the scale is already so tilted, they can’t tilt the balance back much. See comparison below of ALL LMI and NON-LMI watersheds.
LMI vs. Non-LMI flood-mitigation funding through Q3 2021 for ALL watersheds. Note Non-LMI watersheds outnumber LMI watersheds almost 2:1, yet have gotten only a little more than a third of total funding.
Partner Funding Also Favors LMI Watersheds, Not Affluent Ones
Anyone who doubts the percentages above can check my calculations. Here’s the raw spending data for each watershed with percentages of low-to-moderate income residents – including pre- and post-Harvey spending.
I’ve also included partnership funding since 2000 for each watershed. Because the dollars involved vary widely and because Non-LMI watersheds outnumber LMI watersheds 2:1, the fairest way to compare partner funding is by looking at it as a percentage of total funding for each watershed since 2000.
Watersheds with a high percentage of LMI residents are not disadvantaged in total spending or partner funding. LMI watersheds are those with a percent of LMI residents above 50%.
During that period, 26% of all flood mitigation funding in Harris County has come from partners, such as FEMA, HUD, the Army Corps, TWDB or cities. However, LMI watersheds have attracted a higher percentage of partner spending: 30%.
While that’s not a huge advantage, it shows conclusively that LMI watersheds, as a rule, are not disadvantaged when it comes to partnership funding.
The correlation between total dollars and partnership dollars spent in all watersheds is not a perfect (1.0), but very high at .79.
In fact, the two highest partner percentages both belong to LMI watersheds (Sims at 55% of the watershed total and White Oak at 33%). The two lowest partner percentages belong to two of the most affluent watersheds (Willow Creek at 6% and and Barker at 3%).
This debunks another myth frequently heard in commissioners court, i.e., that partner dollars always go to the watersheds with the highest home values.
Conclusion: Organize, Protest
Outlying communities must organize and protest en masse before commissioners take a final vote on shifting even more dollars to LMI communities based on bad information. If they change the deal on this flood bond, they’ll do it again on the next.
Fool me once, shame on you. Fool me twice, shame on me.
Posted by Bob Rehak on 12/14/2020
1568 Days since Hurricane Harvey
The thoughts expressed in this post represent opinions on matters of public concern and safety. They are protected by the First Amendment of the US Constitution and the Anti-SLAPP Statute of the Great State of Texas.
https://i0.wp.com/reduceflooding.com/wp-content/uploads/2021/12/Screen-Shot-2021-12-14-at-8.56.24-PM.png?fit=1616%2C854&ssl=18541616adminadmin2021-12-14 22:23:322021-12-15 09:44:23Move by Dems Could Mean Flood-Bond Projects in Outlying Neighborhoods Never Get Built
For years now, certain Commissioners have argued that poorer watersheds should get more help because their residents are financially less able to recover from floods. But none has ever said what a fair split should be. They just incorrectly assert that rich neighborhoods like Kingwood get all the money to justify shifting even more money toward poorer neighborhoods.
Where Money Really Goes
So let’s look at where the money is really going. Via a Freedom of Information Act (FOIA) request, I obtained Harris County Flood Control District (HCFCD) spending data by watershed dating back to 2000. The numbers below go through the end of the third quarter this year.
LMI Watersheds Already Receive 61% of All Spending
Because of damage patterns during floods and “equity guidelines” established by Commissioner’s Court, eight LMI watersheds have received 61% of all flood-mitigation spending since 2000. Fifteen other watersheds cover twice as much area but receive only 39%.
LMI = residents earning less than half of average income for region. An LMI watershed is one where more than half the residents qualify as LMI.
But the lopsided spending is even more dramatic when you look at the distribution within the LMI category. Just four watersheds have received more than half of all spending since 2000.
Spending by watershed since 2000.Includes HCFCD plus partners.
The top four LMI watersheds alone (Brays, White Oak, Sims and Greens) have received 53% of all flood-mitigation spending since 2000 even though they comprise just one quarter of the square mileage in the county.
HCFCD spending data through end of q3 2021.
Proposed Changes in Allocation Formula Could Accelerate Spending in LMI Watersheds
The changes being considered tomorrow would let projects in poorer neighborhoods move forward immediately before the status of $750 million in HUD funding becomes clear – reportedly in January. They would also let flood-bond money be used to cover street flooding, something never contemplated in the flood-bond project list and something that is not part of HCFCD’s charter.
These changes could ultimately leave projects in more affluent watersheds without enough money to complete them. For a fuller discussion of the impacts, see this post. What’s Fair?
As certain commissioners seek to increase spending in LMI neighborhoods even more, the question arises: “Are others getting their equitable share?” I’ve asked that question many times and can never get an answer. I’m always met with silence. Regardless, tomorrow, certain commissioners will try to tilt the scales even further. I’ll be watching to see how they try to justify it.
To comment on the proposal (Item 17 on the agenda), you must sign up to speak before 10:00 a.m. on Tuesday, December 14, if you attend the meeting in person. If you attend virtually, you must sign up to speak no later than 8:00 a.m. at https://appearancerequest.harriscountytx.gov/. If you sign up to speak, you will be placed in a queue and called when it is your turn.
Posted by Bob Rehak on 12/13/2021
1567 Days since Hurricane Harvey
The thoughts expressed in this post represent opinions on matters of public concern and safety. They are protected by the First Amendment of the US Constitution and the Anti-SLAPP Statute of the Great State of Texas.
https://i0.wp.com/reduceflooding.com/wp-content/uploads/2021/12/Screen-Shot-2021-12-13-at-2.58.23-PM.png?fit=1708%2C1120&ssl=111201708adminadmin2021-12-13 16:19:242021-12-13 16:22:39Should Already Lopsided Flood-Mitigation Spending Tilt Even More Toward LMI Neighborhoods?
12/11/2021 – Data obtained via a Freedom of Information Act Request shows that four Harris County watersheds – those with the highest low-to-moderate income (LMI) populations – have received more flood mitigation spending than all other 19 watersheds combined since 2000.
Recent Harris County Flood Control District (HCFCD) figures show that the size of an LMI population in a watershed correlates more highly with mitigation spending than even damaged structures. Previously, I coined the phrase “funding flows to damage.” That’s still true, but the number of LMI residents in a watershed now correlates even more strongly.
The latest spending data through the third quarter of 2021 also debunks the myth that flood mitigation projects always go to neighborhoods with the highest home values.
How Correlation Works
Correlation is not causation. A coefficient of correlation indicates the strength of a relationship between two variables. In a perfect correlation (1.0), every unit of change in one variable produces a proportional amount of change in a second variable. Variables move together by the same percentage and direction 100% of the time. But in real life, one rarely finds perfect correlations. However, these come close. Statisticians consider them very strong.
Funding Correlates Strongly with Both LMI Population and Damage
Dollars spent on mitigation have the following coefficients of correlation:
.93 for LMI population by watershed
.84 for structures damaged in five major storms
The storms included Allison, Tax Day, Memorial Day, Harvey and Imelda. Spending included HCFCD and partner dollars from 1/1/2000 through 9/30/2021.
You would expect mitigation spending to correlate highly with damage. After all, no one spends money to fix areas that didn’t flood. And the most attention would be focused on areas that flooded the worst. So they vary closely in the same direction.
But why does flood mitigation spending correlate so strongly with LMI population? That’s less expected.
Hypothesis to Explain High LMI Correlation
Observation suggests that LMI households tend to be in older neighborhoods often built to lower standards. For instance, homes tend to be closer to street level.
Population density is also literally twice as high in LMI watersheds compared to affluent ones (3,947.11 people per square mile for watersheds above 50% LMI vs. 1,831.52 for watersheds below 50% LMI). So homes tend to be closer together, have a higher percentage of impervious cover, and crowd floodplains. Said another way, more people live in harm’s way.
Brays Bayou is a good example. It has the largest LMI population, the highest density and the most damage. It has received the most flood mitigation money since 2000 – $544 million or $158 million more than any other watershed.
At the opposite end of the spectrum, Luce Bayou has the smallest population and suffered the least damage. It received the least flood mitigation spending – only about 1% of Brays’ total.
LMI neighborhoods also tend to be in areas (inside the Beltway) surrounded by more upstream development. When developers built those older neighborhoods, they probably weren’t expecting the Houston Metro Area to explode from 700,000 people in 1950 to almost 7 million today.
We also didn’t know as much about flood mitigation in 1950. We didn’t force upstream developers to build detention ponds and didn’t reserve rights of way for future channel expansion. (Or at least not as much as we needed.)
Buying that additional right of way typically costs almost as much as construction – even more in densely populated areas. White Oak Bayou, for instance, has the third highest population and the fourth highest population density. Out of the $386 million it has received since 2000, a whopping 61% has gone toward right-of-way acquisition and 20% toward construction.
As a result of all these complex historical factors and dependencies, LMI population, damage and flood-mitigation spending tend to co-vary. That’s the best explanation I can offer.
In Harris County, Mitigation Spending Favors Low-, Not High-Income Areas
The narrative often heard in commissioners court is that higher home values increase the benefit cost ratio (BCR) for flood mitigation projects and that FEMA favors the highest BCRs. Those, in turn, theoretically favor mitigation projects in affluent communities. But that argument ignores:
The different priorities of HUD, TWDB and local partners.
For proof positive, see the charts below.
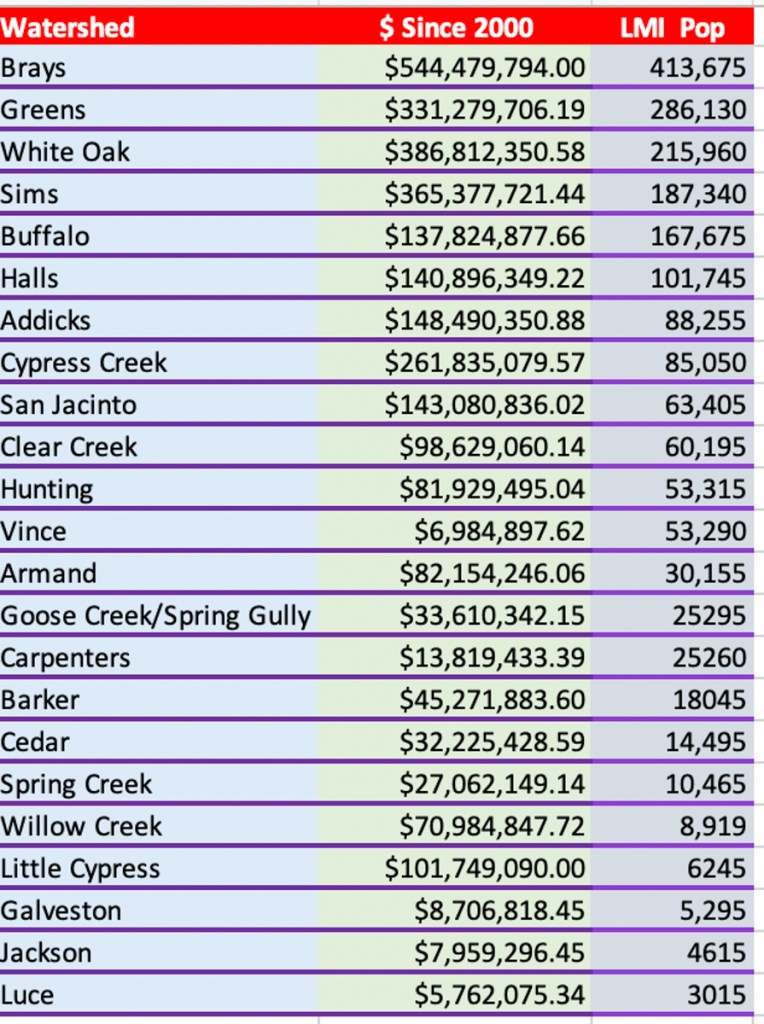
Brays, White Oak, Sims and Greens all have the highest LMI populations. And all have received the most flood-mitigation dollars since 2000. In fact, those four LMI watersheds alone received more money than all other 19 watersheds combined.
Watersheds with large low-income populations tend to cluster on the left; those with high-income on the right with a few exceptions.Spending since 2000 for each Harris County Watershed shown with watershed’s LMI Population
To me, this debunks the myth that having less-expensive housing disadvantages some areas. In Harris County, density, public policy and other factors more than compensate for any influence home values exert on BCRs and the allocation of flood-mitigation dollars.
Posted by Bob Rehak on 12/11/2021
1565 Days since Hurricane Harvey
The thoughts expressed in this post represent opinions on matters of public concern and safety. They are protected by the First Amendment of the US Constitution and the Anti-SLAPP Statute of the Great State of Texas.
https://i0.wp.com/reduceflooding.com/wp-content/uploads/2021/12/Spending-by-Watershed-w-Top-4-More-than-50-percent.jpeg?fit=1200%2C900&ssl=19001200adminadmin2021-12-11 20:09:412026-04-18 14:38:17Mitigation Spending Correlates Even More Strongly with LMI Population than Damage
The new county administrator, David Berry, put an item on the Commissioners Court Agenda for next Tuesday that would modify the formula for allocating flood-bond spending among watersheds – again. Item #21-6881 (17th on the agenda) reads: “Request for discussion and possible action to modify the previously adopted “Prioritization Framework for the Implementation of the Harris County Flood Control District 2018 Bond Program” (Prioritization Framework).”
At the time, Judge Lina Hidalgo and Commissioner Adrian Garcia swore that the guidelines would only affect the ORDER in which Harris County Flood Control District (HCFCD) initiated bond projects and that they would cancel no bond projects.
Changes included eliminating flood-risk reduction from consideration (formerly 25% in original formula). They also eliminated “existing conditions” as a weighting factor (formerly 20%). So for instance, if a creek near you flooded every other year and someone else lived near a creek that only flooded every 25 years, that risk would be eliminated from comparison for funding purposes.
Third Change in Priorities Attempted
Later, in October, as part of the redistricting process, Adrian Garcia attempted to shift money from part of his old district to a new area that he would inherit. The switch would have deprived Cedar Bayou of $191 million in previously allocated flood-bond funds. Luckily Commissioner Cagle reminded Judge Hidalgo of her promise and she voted with Republicans on that issue to defeat it.
Although Garcia lost that particular motion, before the debate ended, he made a demand – that HCFCD address flooding in the 500-year flood plain, not just the 100-year. This is a complex issue. Usually, homes flooding OUTSIDE the 100-year floodplain – on less than 100-year rains – indicates local (street) drainage systems are deficient.
Such flooding is a common complaint in large parts of Northeast Houston. See the reason why below.
I photographed hundreds of ditches like these while driving around NE Houston for an entire day in June this year.
HCFCD doesn’t build or maintain street drainage systems. That is the job of cities and precinct commissioners. Flood-bond spending was never intended to cover such repairs. So now, if flood bond money is forced to stretch to cover them, something else must give.
Garcia’s demand was really a veiled attempt to have flood-bond spending cover part of his budget. And in fact, that demand showed up in the…
Fourth Potential Change in Priorities
In my opinion, this latest proposal has the potential to cancel projects and shift money between watersheds. However, Berry’s office does not address either of those possibilities in backup materials provided to Commissioners and the public.
Berry says of the changes to the equity framework, “We are proposing a number of modifications to improve the Framework to more effectively and more equitably allocate money from the Flood Resilience Trust, as well as to help prioritize new projects not included in the 2018 Bond Program.”
Key changes include:
Placing greater emphasis on the number of people that a project benefits.
Excluding partnership funding
Addressing flooding both inside and outside of the mapped 100-year floodplain
Here’s my take on these.
Number of People
While it’s always good to help the greatest number of people possible, in Harris County, most people live inside Beltway 8. That places areas outside Beltway 8 at a disadvantage – especially those in rapidly growing areas, for instance near the Grand Parkway.
It also places emphasis on flood mitigation at the expense of flood prevention. In that sense, it emphasizes short-term as opposed to long-term gains.
As the Grand Parkway builds around to the east, we have only to look at flooding on the west side to see the future on the east. This measure, if adopted, would be like a doctor who only treats disease and ignores disease prevention. Both are important.
Harris County’s Frontier program is currently buying up land on the periphery of the county in the Little Cypress Creek watershed in an attempt to prevent rapidly developing areas from inundating current residents downstream. We could use more of that! It’s much less expensive and more humane in the long run than waiting until after people flood to do something.
Excluding Partnership Funding
Approximately half of total flood-bond spending relied on Partnership Funding from sources such as FEMA, HUD and the Texas Water Development Board.
Voters actually only approved $2.5 billion in flood bonds. Officials at the time counted on another $2,389,261,250 in partner funds (grants) to complete the list of flood-bond projects. However, if this motion passes, we will no longer consider potential HUD funding. We’ll just pay cash out of the flood bond or flood resilience trust for projects in low-income neighborhoods, some of which have a 90% match for a 10% local share. Then, when the $2.5 billion runs out, the people with uncompleted projects (those that started last) won’t even be eligible for HUD funding, because they don’t live in low-to-moderate income neighborhoods with a high social-vulnerability index.
Basically, Berry’s proposal could increase out-of-pocket costs up to 9X for a large portion of the flood bond.
Inside AND Outside 100-year Floodplain
As previously mentioned, there’s not enough money in the flood bond to shift responsibility for street flooding to HCFCD, Even with the flood-resilience trust. Something has to give.
That something will likely be projects that are still in the study phase where right-of-way acquisition and construction have not yet started. Hmmm. Guess who that is!
A spokeswoman for the GLO said she expects HUD to rule on $750 million in grants to Harris County in January. That could make all of this juggling a tempest in a teapot. So why the rush?
Belly Laugh of Day
Mr Berry also proposed a new “Open Data Policy” for the County under the guise of providing more transparency (Agenda Item #20).
He provides three pieces of backup to explain it:
Legislation Text – which doesn’t contain the text of the proposed motion.
Text of new County Administrator’s proposed legislation on “open data,” AKA transparency.
As if to underscore Mr. Berry’s commitment to transparency, he has placed yet another item on the Agenda – #119. It would take $20 million out of the flood resilience trust for engineering studies for projects that he considers high priorities. But he never describes what the projects are. Nor does he disclose who would get the $20 million.
So much for transparency!
Posted by Bob Rehak on 12/10/2021 based on the agenda for the next Harris County Commissioners Court meeting.
1164 Days since Hurricane Harvey
The thoughts expressed in this post represent opinions on matters of public concern and safety. They are protected by the First Amendment of the US Constitution and the Anti-SLAPP Statute of the Great State of Texas.
https://i0.wp.com/reduceflooding.com/wp-content/uploads/2021/06/MultiBlockages.jpg?fit=1440%2C960&ssl=19601440adminadmin2021-12-10 19:54:252022-01-28 15:43:20New County Administrator Moves to Modify Formula for Allocating Flood–Bond Spending – Again
Harris County Flood Control District (HCFCD) is accelerating its spending on flood mitigation projects. I compiled the chart below with data from a FOIA Request. This request parallels an earlier request at the end of the first quarter and includes spending through the end of the third quarter. In the 3.5 years since the flood bond, HCFCD has completed many preliminary studies and engineering designs. Now many projects are moving into the capital-intensive phases: Right-of-Way Acquisition and Construction.
Current Spending Rate is 8X over pre-Harvey Rate
Comparing the periods before and after Harvey, spending per month tripled. And comparing the last six months to the post-Harvey period, you can see that the pace accelerated another 2.75X. The average for the last six months is up a whopping 8X compared to the pre-Harvey period.
HCFCD Flood Mitigation spending is rapidly accelerating.
That’s good news.
Where/When Spending Occurred
The chart below shows where HCFCD has spent that money. It ranks watersheds by total spending. But within that, you can see tremendous variability between the pre- and post-Harvey eras. In some watersheds, such as Sims, HCFCD largely completed projects with its partners, before Harvey. In other watersheds, such as Little Cypress, you see the opposite. HCFCD accelerated spending on land acquisition as part of its Frontier Program to help prevent, rather than remediate flooding.
Looking at spending before and after Harvey shows the most watersheds ramping up spending as a few taper off.
Four Watersheds Have Received 53% of All Spending since 2000
The flood bond prioritization framework helps shape the curve above. It gives priority to low-income, socially vulnerable neighborhoods. Those projects started first while others wait.
Thus, most of projects in low-income watersheds cluster toward the left. Likewise, with a few exceptions, more affluent watersheds tend to cluster toward the right.
In the years ahead, as HCFCD completes more projects on the left and begins more projects on the right, the slope of the curve may change.
Spending continues to be concentrated in a handful of watersheds. Four have received more than half of all dollars since 2000.
In the meantime, however, looking at subsets of this data, reveals much about priorities. Only five watersheds out of 23 have been allocated significant dollars above the average.
If you took Cypress Creek out of that mix, four other watersheds would be at the average. And fourteen would be below it.
But the top four watersheds alone comprise 53% of all spending since 2000.
Additional Analysis to Follow
In the next few days, I will examine other aspects of spending and what drives it. Those other aspects will include, but are not limited to:
Where the most damage has occurred
Population density
Watershed size
Percent of low-to-moderate income residents
Partnership funding
More news to follow.
Posted by Bob Rehak on 12/9/2021
1563 Days since Hurricane Harvey
The thoughts expressed in this post represent opinions on matters of public concern and safety. They are protected by the First Amendment of the US Constitution and the Anti-SLAPP Statute of the Great State of Texas.
https://i0.wp.com/reduceflooding.com/wp-content/uploads/2021/12/Spending-Acceleration-Bar-Chart.jpeg?fit=1200%2C900&ssl=19001200adminadmin2021-12-09 15:31:072021-12-09 16:04:49HCFCD Accelerating Spending on Mitigation Projects
On the Harris County Commissioner’s Court agenda for today are two Harris County Flood Control District (HCFCD) “transmittals.” One will update commissioners on flood-bond spending to date. The other will update commissioners on the progress of new flood maps (the MAAPnext program). They are items 269 and 270 on today’s agenda.
Transmittals are reports by departments. Commissioners don’t usually discuss them unless one of the commissioners wishes to make comments for some reason. So, I’m calling them to your attention here.
Flood-Mitigation Spending Through Third Quarter Reaches $865 Million
About half of the $865 million spent on flood mitigation since voters passed the bond in 2018 has come from bond funds. The rest has come from grants and local partnerships. See pie chart below on left.
The left pie chart underscores the importance of partnership funding.
The map below shows where flood-bond spending has occurred.
Flood-mitigation spending by watershed since approval of flood-bond in 2018.
The winner in the $weep$take$: HCFCD spent almost $154 million on Brays Bayou.
Other leading watersheds (rounded to nearest million) in flood-bond spending included:
$81 million in Addicks Reservoir
$76 million on Greens Bayou
$76 million on Cypress Creek
$50 million on Little Cypress Creek
$46 million on White Oak Bayou
$32 million on Clear Creek
With a few exceptions, this spending reflects the influence of the Harris County Flood-Bond Equity Prioritization Framework implemented in 2019. That framework gives highest priority to low- to middle-income watersheds with a high social-vulnerability index. Thus, tiny Halls Bayou has received more assistance than the largest watershed in the county – the San Jacinto River. And Brays Bayou has received almost 11 times more assistance than Buffalo Bayou.
Two notable exceptions are:
Vince Bayou which is almost totally inside the City of Pasadena and is therefore primarily Pasadena’s responsibility.
Little Cypress Creek which is part of HCFCD’s experimental Frontier Program. The Frontier Program aims to prevent future flooding by buying up land on the cheap before it’s developed. HCFCD then sells detention basin capacity to developers to help make back its investment.
Other Insights Gained from Report
Most projects are ahead of schedule and on budget. Good news!
More than half of buyouts have been completed and enough funding apparently remains to complete the rest.
Progress continues on the $124 million FEDERAL Flood Damage Reduction project on White Oak Bayou, where six stormwater detention basins will hold almost a billion gallons of stormwater. That’s equivalent to about a foot of stormwater falling over almost 5 square miles.
An earlier version of this report generated some controversy. People in some watersheds didn’t believe the reported expenditures. Members of the Northeast Action Collective questioned whether any projects had started in their watersheds. They demanded immediate cancellation of projects in Kingwood and transfer of Kingwood’s funds, so that projects in Halls and Greens Bayou could start immediately.
That’s, in part, why I wrote “How to Find and Verify Flood-Related Information: Part I.” Flood-mitigation projects are hard to spot from the ground. Construction almost always happens out of sight behind tall fences and dense tree lines. After construction, the projects are often disguised as parks. For those who doubt, I recommend confirming the existence of projects from the air.
I haven’t confirmed every project in the county, but I have spot-checked many. And I have yet to find discrepancies between what HCFCD reports and what I can see from the air.
C-25, a Halls Bayou Detention pond now under construction by HCFCD. The bayou runs through the trees in the foreground.New basin at Hopper and US59 on a tributary of Halls Bayou.Lauder Detention Basin on Greens Bayou as of 10/12/2021. Phase One of a two-phase project is nearly complete.Cutten Road detention basin on Greens Bayou continues its relentless expansion.Phase 1 of the Greens Bayou Aldine-Westfield Basin on left is complete. Phase 2 on right is now beginning.
For more information that includes watershed spending data before the flood-bond, check out the funding page.
MAAPnext Effort About to Be Turned Over to FEMA
Harris County Flood Control (HCFCD) estimates it has completed 86% of its part of the flood-map updates. HCFCD will deliver drafts of the new maps to FEMA in January for review and kick off a campaign of public meetings at the same time. The public will see draft maps in February. A public comment period of 90 days will follow. And FEMA hopes to release preliminary flood insurance insurance rate maps by mid-year next year.
I have had a peek at the new maps and reports. And I must say, the effort should result in a dramatic leap forward in flood-risk understanding. Individualized reports will inform homeowners of their flood risks from a variety of different sources, including street flooding. The prototype of the website is very user friendly.
After receiving preliminary maps from HCFCD, it typically takes FEMA another 18-24 months to release final, official flood maps. That gives affected property owners time to comment and appeal. The process looks like this.
MAAPnext milestones as of the end of 2021.
Posted by Bob Rehak on 11/30/2021
1554 Days since Hurricane Harvey
https://i0.wp.com/reduceflooding.com/wp-content/uploads/2021/11/20211130-Screen-Shot-2021-11-30-at-10.31.04-AM-2.jpg?fit=1200%2C836&ssl=18361200adminadmin2021-11-30 12:47:472021-11-30 12:47:51Where Flood-Bond Spending Is Going, When New Flood Maps Will Be Released
The recent redistricting of Harris County precincts could not have been more disruptive. More than half the county’s residents changed both precincts and commissioners. Can you say, “Tossed Salad”? It will take some time to work this out. In the meantime, “Many are asking how will new precinct boundaries affect flood-mitigation priorities?”
Officially, Harris County Flood Control District (HCFCD) does not allocate flood-bond mitigation money by precinct. They allocate it by watershed and project – with the most money going to the most heavily flood-damaged areas.
But those who watch Commissioners Court regularly know that Commissioners control HCFCD priorities, and no project moves forward without their approval.
Lake Houston Dam Example
All this raises the question, “How will the re-alignment of Commissioner’s precincts re-align flood-mitigation priorities?”
For instance, the Lake Houston Dam was half in Precinct 1 and half in Precinct 2 both controlled by Democrats. But P2 Commissioner Garcia has given that area up. The east side of the dam will now be in Precinct 3 now controlled by Republican Tom Ramsey. Ramsey will now also control virtually all the homes around the lake with the exception of a small area in Summerwood. The flood bond allocated $20 million to help support expansion of the flood gates on Lake Houston (Project CI-028). How solid is that commitment now that Democrats have given up most of the area?
Across the county, from Cypress Creek to Armand Bayou, people have dozens of questions like that about projects affecting them. The answers will take time to sort out.
New High-Resolution Precinct Maps Finally Available
Until a few days ago, the lack of resolution and streets in redistricting maps made it difficult to tell exactly where the new precinct boundaries were.
But just last week, the Harris County Attorney posted a new high-resolution map showing new boundaries. The map also shows major streets and voting precincts (in addition to the county precincts).
The plan, designed and approved by Democrats, will force Commissioners Cagle and Ramsey to run for re-election in areas where they are relatively little known – unless they want to move their residences. Commissioner Rodney Ellis carefully drew district boundaries so that Cagle and Ramsey would no longer live in precincts they once represented. And by law, Commissioners must live in the precinct they represent.
Ramsey and Cagle will now have whole new watersheds to learn.
Watershed Boundaries Not Yet Shown on New Precinct Map
Unfortunately, the new high-res precinct map does not show watershed boundaries, although it shouldn’t be hard to create one – for someone with better Photoshop skills than mine!
At the moment, to see how your watershed could be affected, compare two maps side by side.
The latter shows watershed boundaries if you click on the Watershed button in the left-hand column.
Most of the Lake Houston Area including Huffman, Kingwood, Humble (east of Bush Intercontinental Airport), Atascocita, Crosby and Spring will now be in Precinct 3 with Commissioner Tom Ramsey.
The thoughts expressed in this post represent opinions on matters of public concern and safety. They are protected by the First Amendment of the US Constitution and the Anti-SLAPP Statute of the Great State of Texas.
During a spirited, but cordial debate Thursday that lasted almost two hours, Harris County Commissioners Court decided NOT to divert $191 million designated for Cedar Bayou in the flood bond. The deciding factor: previous promises not to cancel projects made by Lina Hidalgo and, you guessed it, Adrian Garcia himself.
Commissioners also recognized a need to ask voters for more flood-mitigation money and feared that cancelling projects would jeopardize the trust of voters and put future bonds at risk.
In the end, Commissioners Cagle and Ramsey got Judge Lina Hidalgo to agree with them, and Garcia withdrew his motions to transfer the money. It was reportedly the first time in years that Democrats broke ranks. Garcia seems crushed.
Two Sides Lay Out Opening Positions
Democrats primarily argued that we need to spend the money quickly to protect populated neighborhoods that have repeat flooding instead of newly developing areas.
Garcia led off the debate by stating the ideas behind the motion: flood bond matching funds have not yet fully materialized, so money is short. And cure is more important than prevention.
Republicans argued that voters approved a bond with a list of projects, and that diverting money would violate the public trust and jeopardize future bonds.
Cagle Reminds Hidalgo and Garcia of Previous Promises
The last page of the letter also contained a FAQ sheet. The very first question: “Is Harris County going to cancel my project?” Answer” “No, every project on the Flood Bond project list will be completed.”
Cagle also showed a rambling statement Garcia himself made at Commissioners Court on 8/27/2019. “If anybody and if anybody is watching on live streaming that believes that this body has somehow taken action to eliminate projects that were already planned, already posted, and already listed, I want people to know that whoever is spreading that rumor, whoever may be making phone calls, whoever may be having someone make phone calls, whoever may be out there telling people to call you and tell you come down to Commissioners Court and tell them don’t eliminate our projects or why are you eliminating our projects. I want to make sure you know that that is blatantly false if not maybe a lie. If anyone is getting that kind of information that things of that nature are happening, I’m not sure how this information is getting out there but it is just downright false.”
Whew. That first sentence is 88 words long! But the gist of it is that, “The allegation that we’re eliminating projects is blatantly false.”
Commissioner Ramsey focused mostly on a project he wanted to kill just six months ago, so he could use the money on one he considered more important in the same watershed. However, he was told that he couldn’t. Ramsey, in essence, was arguing that a double standard seemed to exist.
Those reminders seemed to turn Hidalgo. Realizing there was no hope of a win, Garcia withdrew the motions (#136 and #323) to divert the Cedar Bayou money.
Garcia Makes New Motion
But that didn’t end the discussion. Garcia made another motion. He asked the county administrator to work with Flood Control to come back with a funding recommendation “for projects outside the 100-year flood plain.” The motion carried unanimously without debate.
However, someone should have asked if he was so concerned about repeat flooding why would he focus efforts on 500-year floods instead of floods with higher frequency.
Misrepresentation of Available Funds
Repeated falsehoods marred the discussion. One had to do with the amount of money available. On numerous occasions, Garcia claimed only $2.5 billion was available. However, because of partnership funds already received and transfers from HCTRA, the total committed to flood mitigation to date exceeds $4 billion. As of June 2021, only another $951 million is needed to fully fund all bond projects with seven years left to find the money. And the GLO is waiting in the wings with another $750 million from HUD. That one grant could come close to fully funding all bond projects.
If you look closely in Garcia’s spreadsheet, you will also see that his consultant claims Garcia’s projects will take more homes out of floodplains than Harvey flooded. Hmmmm, 2494 flooded in Harvey vs. 3697 removed from floodplains. Wonder how that works.
Show Me the List!
Finally, after repeatedly talking about specifics and referring to “this project” or “these projects”, the number of homes that could be removed from the 500-year floodplain, and the rankings of projects, Garcia pretended that “a list” was still in development. However, I later obtained a copy. While Garcia may still be fine tuning the list, he had one that he shared with other commissioners but not the public. That list identified 17 projects from which he compiled the 2,494 structures saved.
The 17 projects include Carpenters Bayou, Vince Bayou, Goose Creek, Jackson Bayou, Spring Gully, Armand Bayou, Galveston Bay, Greens Bayou and San Jacinto watersheds.
Projects Fall within Boundaries of Precinct 2 Proposed in Ellis Plan
The flood bond already included money for nine of those projects. So transferring money for them should have been unnecessary, but Garcia included their costs in his total dollars needed.
Nine were within Cities (Pasadena, Baytown, La Porte). And eight were in unincorporated areas. The county’s primary mission is to serve unincorporated areas.
Proposed new Harris County Precinct Boundaries in Ellis Plan. Lines represent existing boundaries and colors represent proposed new boundaries.
This supports the hypothesis that the attempted transfer related to bolstering Garcia’s re-election chances.
The location of the projects relative to the proposed Precinct 2 boundaries never came up in debate, however. That’s probably because dozens of additional people complained about redistricting plans today BEFORE the discussion of shifting Cedar Bayou money.
Head Scratcher
Garcia also repeatedly mentioned homes that flooded in the 500-year flood plain. And his motion talked about removing homes from the 500-year floodplain rather than protecting homes in the 10, 50, and 100 year floodplains. Those flood far more frequently and he said upfront that his primary concern was repeat flooding.
https://i0.wp.com/reduceflooding.com/wp-content/uploads/2021/10/Screen-Shot-2021-10-27-at-12.01.01-AM.png?fit=1928%2C1118&ssl=111181928adminadmin2021-10-27 00:07:112021-10-27 11:05:36Garcia’s Proposal to Divert $191 Million in Flood Funds from Cedar Bayou is Defeated