Brays Bayou Received Approximately Half Billion in Flood Mitigation Funding In Last 23 Years

Since 1998, the Brays Bayou watershed has received approximately a half billion dollars in flood-mitigation funding. To compile that estimate, I consulted Harris County Flood Control District’s (HCFCD) 2019 Federal Briefing (see page 45) and HCFCD’s “active construction projects” page for May 2021.

Map of Improvements

From page 57 of HCFCD 2019 Federal Briefing. Note all of the projects recently funded, completed or under construction.

Nature of Improvements

The 2019 Federal Briefing (page 56) separates Brays improvements into two areas:

  • Upstream (west of Sam Houston Tollway)
    • 3 detention basins: 595 surface acres; 9,623 acre-feet of storage – enough to hold a foot of water falling over 15 square miles (13% of entire watershed)
    • 3.7 miles of channel conveyance improvements, including control structures, from Old Westheimer Rd. to SH 6
  • Downstream (east of Sam Houston Tollway)
    • 17.5 miles of channel conveyance improvements from the mouth to Fondren Rd.
    • 1 detention basin: 252 surface acres; 1,865 acre-feet of storage – enough to hold a foot of water falling over 3 square miles
    • 30 bridge replacements/modifications, and/or channel conveyance improvements under bridges (16 due for completion this year)

Harris County Flood Control District (HCFCD) manages, designs, and builds the projects; buys land, easements, rights-of-way; relocates utilities; adjusts bridges (except for railroads); and operates and maintains the channel after construction.

Benefits and Costs

After completion, upstream improvements should give residents a 100-yr. level of flood protection (1% annual chance).

Likewise, downstream improvements should reduce the number of structures:

  • In the 4% or 25-year flood plain from 3,520 to 50.
  • In the 100-year flood plain from 16,800 to 1,800.

Total Cost Estimate: $480M though 2019 (Source: 2019 HCFCD Federal Briefing, Page 45)

Benefit-Cost Ratio: 7.0 (Source: 2019 HCFCD Federal Briefing, Page 56)

The size of the cost in conjunction with the benefit-cost ratio makes these numbers impressive. The primary requirement for the ratio is that it exceeds 1.0, i.e., that the benefits exceed the costs.

Brays’ watershed includes 114 square miles. That makes the cost per square mile a whopping $4.4 million throughout the watershed. However, one must also consider that the population of Brays is the largest of any watershed in Harris County – more than 700,000 of which (57.5%) qualifies as low-to-moderate income.

The map below, taken from a 2020 HCFCD grant application to the US Department of Housing and Urban Development (HUD), shows the distribution of income throughout the watershed. Areas such as West University and the Medical Center in the middle (blue) rank higher in income than areas east and west (tan/red).

LMI quartiles within Brays Bayou Watershed as of 2020. Source: HCFCD HUD grant application.

Possible Reasons for Large Investment

You could justify this extraordinary level of investment any number of ways. By the:

  1. Large population
  2. High population density
  3. High benefit/cost ratio
  4. Protection of critical infrastructure, such as the Texas Medical Center
  5. Number of homes and businesses flooded historically – also the largest in Harris County: 32,194 structures since Allison (Source: 2019 Federal Briefing: Pages 16-21)
  6. Length of time projects have been in the pipeline (most before Harvey and some even before Allison)
  7. Proximity to older, central part of county

Do not underestimate the last two points. Funding for many flood-mitigation projects can take decades.

Disproven Theories

Regardless of the reasons why Brays has received so much investment, one can also look at what this example does not show. It does not support the “equity” narrative propounded by some. That narrative asserts low-to-moderate-income neighborhoods receive less flood-mitigation funding because of lower home values compared to more affluent neighborhoods. Those affluent neighborhoods theoretically get more flood-mitigation funding because they allegedly support higher benefit-cost ratios (BCRs).

Home Value Alone Does Not Determine Benefit/Cost Ratio

The 7.0 BCR in Brays proves that low-to-moderate income neighborhoods are not automatically disadvantaged. Population density can offset lower property values. A whole apartment complex can sit on the same amount of land as one suburban home, yet the apartments would have higher value.

Experts also point out that many other elements affect calculation of BCRs. This study from the William & Mary Law School summarizes the approaches of HUD, FEMA, the Corps and others in determining BCRs. Table I.1 on page 11 shows many of the factors considered:

  • Resiliency benefits
    • Direct Physical Damages to Buildings, Contents and Inventory
    • Essential Facility and Critical Infrastructure Serivce Loss
    • Human Impacts
    • Economic Losses
  • Environmental Benefits
    • Provisioning Services
    • Regulating Services
    • Supporting Services
    • Cultural Services
  • Social Benefits
    • Recreational Benefits
    • Health Benefits
    • Aesthetic Benefits
  • Economic Revitalization
Brays Watershed Investment Not Suffering From Discrimination

The Brays watershed cuts across racial, ethnic and socio-economic boundaries. Flooding has been recognized as a problem here for decades and HCFCD has successfully obtained many grants during that time. HCFCD has also invested more in Brays than any other watershed. Like Halls Bayou and Greens Bayou, the narrative re: Brays is far more complex than some acknowledge.

Photos of Improvements in Bray’s Bayou Watershed

On May 26, I flew from Beltway 8 West to the Ship Canal east of downtown along Brays Bayou. Out of more than 1100 images, here are 16 that represent what you see along the way. Lots of detention ponds, channel improvements, and new bridges. The bridges are higher and often wider, with wider supports to avoid constrictions and blockages. New bridges never have more than two supports in the water flow; some old ones had seven.

Arthur Storey Park at Beltway 8 West and Bellaire Blvd. Looking N toward Westchase District.
Southern part of same park. Looking NE across BW8 West.
Looking NNE at Hilcroft and North Braeswood Blvd.
Looking WSW across same new bridge at Hillcroft. Note wide spans and wings designed to prevent erosion.
Looking north at new bridge over Brays at Chimney Rock
SW Corner of Loop 610 looking toward downtown in upper right.
Same intersection south of Galleria area. Note complexity where seven streams of traffic intersect.
Looking east toward downtown along Brays just inside of Loop 610 at detention pond. Note sewage treatment plant across bayou.
Looking north across new bridge over Brays along Buffalo Speedway toward Greenway Plaza in background.
Looking NE toward downtown in background along Main Street. Medical Center is in middle of frame.
Looking NE toward downtown where Fannin St. crosses Brays at UT Health Science Center.
Looking NE toward Med Center and downtown in background across another new bridge over Brays. Note the electrical infrastructure next to the bayou.
288 and Brays. Bridge construction on Almeda.
New Bridge over Brays at South 75th.
Looking NE across Brays at new railroad bridge near Tipps Street.
Downstream end of Brays near Buffalo Bayou. The ship canal and Port of Houston are in background.

As these pictures show, flood mitigation funding isn’t all about home value. Brays traverses some of Houston’s most critical infrastructure, job centers, rail lines, diverse neighborhoods and employment centers.

HCFCD describes Project Brays as the largest it has ever managed. To learn more more and see before/after pictures of many improvements, visit Project Brays’ own website.

Posted by Bob Rehak on 6/3/2021

1374 Days since Hurricane Harvey

Halls Bayou Illustrates Cost, Difficulty of Flood Mitigation in Overdeveloped Areas

Flooding within the Halls Bayou watershed illustrates what happens when development, density, lack of detention and insufficient distance from streams put people and their property in harm’s way. Instead of protecting a strip of green space near the bayou years ago, developers built right up to the edge. As density increased and developers built further upstream without sufficient detention, people who crowded the Bayou then started to flood repeatedly.

As the images below show, once developed, the cost and time of mitigation increases exponentially.

All of that argues for better planning and the protection of green spaces that can accommodate future floods and flood mitigation projects throughout the region.

Halls Bayou Not Unique

This same scenario happened repeatedly in other Houston watersheds: Greens Bayou; Brays Bayou, White Oak Bayou, and Cypress Creek, for instance. But let’s save those for future posts. For now, let’s go back in time.

Solution Well Known for More than a Century

In 1913, recognizing the potential for continued growth, a well-known landscape architect, Arthur Comey created the first comprehensive plan for the Houston Park Commission. He observed that Houston ranked far behind other major U.S. cities in parkland. It had one acre of park for every 685 residents. Seattle was a distant second at 224 residents per acre.

To address this inequity, Comey’s plan included a visionary idea. Noting that the city’s network of bayous were already “natural parks,” he proposed a series of linear and large parks along their lengths.

As he wrote, the “bayous and creek valleys readily lend themselves to trails and parks and cannot so advantageously be used for any other purpose.”…

Unfortunately, developers ignored him.

About Halls Bayou

The Halls Bayou Watershed comprises a city within a city.

  • Older homes and businesses are densely packed.
  • Many are built right up to the edge of the Bayou.
  • 70% of the population is low-to-moderate income.
  • You see far more signs in Spanish than English

Economically, the area looks poor. Culturally, it feels rich.

Frankly, as I drove through it last weekend to photograph flood mitigation projects, it felt much more vibrant than more affluent neighborhoods father to the north or south.

For the most part, people have fixed their homes since the last big flood. These folks may be poor, but the vast majority take great pride in what they have.

The map below shows the route of Halls Bayou through surrounding mid-north neighborhoods. Homes are packed so close to the bayou that it’s hard to see it in places, so I outlined the route in red.

Route of Halls Bayou through mid-north part of Houston. Airline Drive is on left, I-45 in middle and US 59 on right.

Now, let’s superimpose floodplains over the same area.

Floodway = cross hatch, 100-year floodplain = aqua, and 500-year floodplain =tan. Map last updated in 2007 based on data from Tropical Storm Allison.

North to south along US 59 (on right), the floodplain extends almost 3 miles. And it will extend even farther when new maps based on Atlas 14 are officially released based on Harvey data. The image below shows what the area around US 59 and Halls looked like in 2002 shortly after Tropical Storm Allison.

Note subdivisions built right next to bayou.

Next, see how that area looks today where Halls Bayou crosses under US 59. Two large detention ponds exist where the subdivisions used to be.

Note the two large detention ponds, one on either side of the freeway. The one on the left was substantially completed in 2015 and the one on the right in 2018.

Each detention basin took about three years to build.

Time, Costs of Buyouts

Before HCFCD could construct the detention ponds, it had to buy out homes in adjacent subdivisions and demolish them. Buyouts near the detention areas above began in 2002 when HCFCD received a large grant from the federal government after Allison. Google Earth images show that the buyouts took at least another three years.

Then Flood Control had to get permits from the City of Houston to demolish the streets. That took additional years.

So from 2002 until the completion of construction took 13 to 16 years (2015 and 2018). But the construction itself took only 3 years.

Thus, the total project took 4-5X longer than construction.

$1 of Prevention Worth a $1000 of Flood Mitigation

This area started to develop in the 1940s. The earliest image in Google Earth (1944) shows that it was at the edge of the City then. With more wetlands and farm land to absorb rainfall, the flooding problems were probably not as bad. A few scattered subdivisions pressed against the edges of the bayou. But the lots were large. And had green space been set aside then, the story today might be different.

Halls Bayou in 1944. Note: only two subdivisions started to encroach on the bayou. Rest was rural.

Compare again the shot above with the one below for a dramatic example of infill development. The shot above is NOTHING like today’s below.

Compare the dramatic increase in density with the decrease in bayou width.

Just looking at these two maps, you can see how the dramatic increase in density limits flood mitigation possibilities and raises costs.

We no longer have any easy solutions.

To make matters worse, despite flooding, people often fight buyouts. Most people in neighborhoods like this depend on support networks of friends and family. They fear leaving those networks. Many date back generations.

Should Have Known Better

Developers and home buyers knew or should have known this area was flood prone. But still, they built or bought here at great risk to themselves, and ultimately at great cost to the community.

That raises the question: Why were people allowed to build so close to the bayou in the first place? Why wasn’t sufficient green space left along the bayou to widen it or build detention ponds?

There are no simple answers to that question. Residents may not have felt at risk until upstream development sent more water downstream faster. They may not have been knowledgeable enough about flooding to ask the right questions.

Some just wanted to live close to work. Some wanted to be near family and friends. Some needed the support. And some just pushed their luck because they liked the view or location and the lots were cheap. Regardless, everyone is paying the price for decisions often made decades ago.

Posted by Bob Rehak on April 28, 2021

1338 Days since Hurricane Harvey

Harris County Commissioners Supplement Flood-Bond Funds with Highway Money to Accelerate Mitigation

Tuesday, Harris County Commissioners Court voted 5-0 to transfer $315 million of toll road revenue, unallocated County road bonds and other county funds to accelerate the construction of certain flood-bond mitigation projects. They will allocate the funds to mitigation projects using the 2018 Flood Bond Prioritization Criteria.

The transfer will provide backstop funding for 100% of the projects in the Road & Bridge Subdivision Drainage Program of the 2018 Flood Control Bond Program, removing the risk that partner-funding shortfalls prevent projects from being completed.

Text of Motion

The final language as amended and approved reads as follows:


Create a new funding facility of $115 million, made up of County road bonds or HCTRA surplus revenue, to free up Flood Control bond capacity currently used for the Subdivision Program.  The Flood Control bond capacity will be allocated by utilizing the 2018 Flood Bond prioritization criteria.

Create an additional funding facility of $200 million, comprised of HCTRA surplus revenue or other County resources, to support completion of projects that are part of the 2018 bond program with the required transportation nexus.


Here is a background sheet from the county’s budget management department that explains the switch.

The Subdivision Program consists of 91 projects which, according to HCFCD estimates, reduce the risk of flooding to more than 45,000 homes.

Background

The projects benefit neighborhoods with outdated drainage infrastructure or which never had modern drainage systems in the first place. Furthermore, multiple projects are located in watersheds that have been historically disadvantaged in securing federal funds for flood control. According to the Office of the County Engineer, the Subdivision Program has a current estimated total cost of $535 million (or ~$590 million including an approximately 10% contingency).

Among the objectives:

  • Provide backstop funding for partnership projects in case grants don’t materialize or are delayed beyond a reasonable time
  • Let projects with mature or advanced partner funding opportunities pursue those opportunities for a defined (but not unlimited) period of time..

The background sheet contains a list of eligible projects in each precinct. Any Subdivision Program project costs that have not received a notice or award of partner funding by August 31, 2021, would be eligible to receive additional money from the backstop funding.

Discussion

Discussion on the motion and amendment lasted about an hour. It became clear that commissioners believe they:

  • Must complete all projects in the bond.
  • Expect not to find partnership funds for some projects, leaving those projects underfunded.
  • Need more money.
  • Must use diverted funds on flood projects that have some connection to transportation, i.e., problems created by new highway construction.
This approval will remove a cloud of uncertainty from projects that rely on partnership funding which has not yet materialized for some projects.

Including projects from all four precincts helped ensure a unanimous vote.

Another Bond? Not So Fast

Commissioners talked about the possibility of another flood-bond offering. However, the likelihood of that passing is slim. Poor people feel the money is going to affluent neighborhoods and affluent people feel the money is going to poor neighborhoods. If no one is happy with the way the current bond money has been handled, why would anyone vote to approve more?

Commissioners have grappled for more than a month with how to handle a possible shortfall in partner funding. Precinct 1 Commissioner Rodney Ellis threatened to slow down or halt all flood-bond projects until Flood Control found a way to fully fund projects in Halls and Greens Bayous. Today’s development, seemed to avoid that showdown.

Flood Control will try to collapse a ten-year timeline down to five years.

It’s unclear at this time how today’s development will affect HUD grants in the pipeline, the interest costs on borrowed money, or the availability of qualified contractors.

Posted by Bob Rehak on 4/28/2021

1338 Days since Hurricane Harvey

Four Halls Bayou Detention Ponds Recently Completed; Four More Virtually Done

If you saw the recent front page article in the Houston Chronicle about Halls Bayou, you would think that Harris County Flood Control District (HCFCD) relegated residents in the watershed to “the back of the bus.” Even before the bond, Halls received four floodwater retention projects, three of which are major. HCFCD is trying to expand the fourth of those. And since the flood bond, HCFCD has virtually completed four more floodwater retention projects..

Here’s what I found by simply driving around after consulting the HCFCD website and Google Earth Pro. I wish the Chronicle writer had done the same. There’s just no substitute for laying eyeballs on the job sites before riling up millions of people. Let’s start with the flood-bond projects first. I took all the photos below on 4/25/21 and 4/26/21.

Almost Completed Stormwater Detention Basins in Halls Watershed

Basin on Little York east of US59
New basin at Hopper and US59
Third new basin north of Helms Road east of Airline Drive
Fourth new basin south of Helms Road west of Airline Drive.

Recently Completed in Halls Watershed

Hall Park Stormwater Detention Basin East of US59 at Parker. Google Earth images show this project was substantially completed in 2018.
Bretshire Stormwater Detention Basin West of US59 at Parker. Google Earth images show this project was substantially completed in 2015.
Keith Weiss Park Stormwater Detention Basin on Halls Bayou east of Aldine Westfield. Google Earth images show this project was substantially completed in 2015.
West of Aldine Westfield, there’s a small basin owned by TxDOT. HCFCD hopes to enlarge this basin into the surrounding wooded areas as part of bond project C-25. Google Earth images show the first phase of this project was completed in 2012.

Funding “Shortfall” Not Yet Known

The Chronicle writer also claimed a “funding shortfall” for Halls of $272 million. Curious that he would make this statement just days before the GLO announces the winners of a statewide competition. Harris County could get some, none or all of its requests. To be clear, the competition is stiff; Harvey affected more than 40 counties. Regardless, there’s more than $2 billion up for grabs ($1 billion in this round and $1.144 billion in the next). It seems to me, the Chronicle writer could have waited a few days to publish results rather than rumors.

We Need Real Historical Data on Flood Mitigation Spending

Whether you agree with Rodney Ellis, Adrian Garcia and Lina Hidalgo or not, they have fought tenaciously for their constituents. They succeeded in reordering the priorities in flood-bond spending to serve low-to-moderate income neighborhoods first. For the Chronicle to imply that they failed their constituents is an insult to the Judge and Commissioners.

And to imply that all the money is going to more affluent neighborhoods is simply false. That claim seems designed to inflame racial hatred. Kingwood, for instance, has NEVER received one federally funded capital improvement project from HCFCD. Yet the Chronicle’s readers evidently concluded rich neighborhoods get all the money. Again, there’s no substitute for research.

From the Chronicle writer’s Twitter feed.

Inflaming racial tensions based on false information is the last thing America needs at this time.

In my opinion, we need facts, not fiction. Asserting discrimination is not the same as proving it.

Chronicle Article Also Ignores Tax Issue, Funding Realities

The Chronicle’s “HCFCD-puts-poor-people-at-the-back-of-the-bus” narrative also ignores the mechanics of funding projects. Before the flood bond vote in 2018, I spent an hour with former County Judge Ed Emmett discussing funding needs. A high priority at that point was to make local tax dollars stretch as far as they could by leveraging partner funding.

The need to leverage partner funding was even addressed in the final flood bond language. Paragraph 14 G states “…the commissioners court shall provide a process for the equitable expenditure of funds recognizing that project selection may have been affected in the past and may continue to be affected by eligibility requirements for matching Federal, State and other local government funds.”

Nobody stretches local tax dollars like the US Department of Housing and Urban Development (HUD). HUD is one of the main sources for funding projects in low-to-moderate income neighborhoods. Why?

HUD often offers a 90% match.

But there are two catches. First, you’re only eligible if at least 70% of residents that benefit from a project qualify as “low-to-moderate income” (LMI). Second, HUD is slow. To put “slow” in perspective, the Texas General Land Office just started accepting HUD grant applications from Imelda last Saturday. Imelda happened 586 days ago.

Looking at the flood bond spreadsheet (Page 6 of 10) and the expected partnership share of Halls Bayou Projects, you can see that 90/10 ratio reflected in most of the projected funding for Halls.

It’s unclear whether voters would have approved a flood bond that was 9X higher, especially when everyone, rich and poor alike, expressed concerns about not getting their fair share.

Alternative Sources of Halls Funding More Risky

Had HCFCD tried for FEMA funding instead, the low home values in Halls neighborhoods may have yielded a poor Benefit/Cost Ratio. Commissioner Ellis constantly reminds people about the perils of FEMA funding when applied to LMI neighborhoods.

So really, HCFCD had no choice but to focus on HUD for Halls projects.

  • The neighborhoods qualified.
  • The HUD match was far higher.
  • That minimized a tax increase.
  • It also maximized the number of possible Halls projects.

This was not a “gamble” as the Chronicle headline implied; it was actually the least risky option that seemed to benefit the most people.

Map above taken from HUD CDBG-MIT Draft Grant Application from Halls Bayou Watershed shows that 144,000 people in the watershed qualify as LMI (low to moderate income). That’s 70.6% of the total residents. To see the complete draft, visit this page.

We all need to calm down and wait to see how much money HUD grants the Hall’s Bayou Watershed projects. Brittany Eck of the GLO told me that she expects decisions by the end of this month. That’s this Friday.

Posted by Bob Rehak on 4/27/2021

1337 Days since Hurricane Harvey and 586 since Imelda
The thoughts expressed in this post represent opinions on matters of public concern and safety. They are protected by the First Amendment of the US Constitution and the Anti-SLAPP Statute of the Great State of Texas.

HCFCD Issues Flood Bond Update as of March 30, 2021

In the March 30, 2021 Harris County Commissioner’s Court Meeting, Harris County Flood Control District (HCFCD) gave a Flood Bond update. Here’s where projects in the 2018 Flood Bond program stand.

Overview

In the 30 months since the bond was approved by Harris County voters, the Harris County Flood Control District has used bond funds to:

  • Accept 25 grants totaling approximately $960 million with Bond funds providing around $259 million in local matching funds
  • Execute 326 engineering agreements totaling $241 million
  • Award 39 construction agreements totaling $296 million
  • Procure 19 staff augmentation agreements providing 113 contract staff members
  • Acquire nearly 340 properties at a value over $208 million for construction projects, floodplain preservation, and wetland mitigation banks
  • Make $115 million available to the Office of the County Engineer to manage and construct drainage improvements in nearly 100 subdivisions across Harris County
  • Conduct 140 community engagement meetings with over 11,413 attendees
  • Complete nearly 630 home buyouts at a value over $130 million with over 680 additional in process for a buyout (since Hurricane Harvey)
  • Complete over $125 million repair program to address damages to District infrastructure caused by Hurricane Harvey

19 Projects Completed, 372 Underway

The flood bond update shows that of the 19 projects completed so far, investigations, analyses and studies comprised 15.

Altogether there are 372 individual HCFCD projects in progress related to the Bond Program. The table below shows the stages of those projects.

88% of all projects identified in the flood bond are currently underway and at some state of completion.

Only 21 Projects Not Yet Started

Only 21 Bond projects have not yet started. They are all in the fourth quartile of the bond prioritization framework and will begin between July 2021 and March 2022. Of those, two are in the San Jacinto watershed: CI-61 (East Fork, West Fork, and Lake Houston Dredging) and F-15 (General Drainage Improvements near Atascocita).

Dredging included a $10 million match with estimated partner funds of $40 million.

FEMA/Army Corps, TWDB and City of Houston funds have covered dredging in the river to date.

Status of Lake Houston Area Projects

Other projects in the Lake Houston Area at least partially underway.

Luce Bayou and Huffman

Project underway include right-of-way acquisition, design and construction of general drainage improvements in the Luce Bayou Watershed and near Huffman (total $20 million). Luce Bayou right-of-way acquisition and floodplain preservation ($10 million) has also started.

Gates on Lake Houston Dam

Design and construction of additional gates on Lake Houston ($20 million) is nearing completion of the design phase. The City of Houston has taken the lead on that project but has made no announcements on it recently.

Other Projects Lake Houston Area Partially Underway
  • The San Jacinto Watershed Study ($625,000)
  • Funding for future partnership projects based on the SJR watershed study ($18.75 million)
  • Investigation of potential detention sites around the Glendale Dredge site in Partnership with the City of Houston ($50,000)
  • Conveyance improvements along Panther Creek ($10 million)
  • General drainage improvements east of Lake Houston ($10 million)
  • General Drainage Improvements near Kingwood ($10 million)

One Third of Projects Now Past Design Phase

One third of all projects have already begin work outside.

Ellis Not Content with 40% of Construction Going into Two Bayous in His Precinct

40% of all projects under construction are in Greens and Halls Bayou Watersheds, the two Precinct One Commissioner Rodney Ellis cares most about. He wants to slow down projects in other areas to focus more on projects in his area.

For a discussion of how the meeting went, check back tomorrow.

For the full Flood Bond update, click here. For future reference, this link is also posted on the Reports page under the Harris County Flood Control District, tab.

Posted by Bob Rehak on 3/30/21

1309 Days after Hurricane Harvey

How to Find Active HCFCD District Capital and Maintenance Projects

If you’ve been wondering what Harris County Flood Control District (HCFCD) is up to, check out this interactive GIS Map on HCFCD.org. It shows all active capital and maintenance projects, their exact locations, and budgets. It’s one of several interactive GIS maps that can give you critical information about flood risks, flood maps, mowing schedules, and more.

Active Projects for January 2021

The map below shows active HCFCD projects for January 2021. HCFCD says it updates the maps in the first week of each month. Projects that start after that may not show up until the following month. Active projects include both capital (new construction) and maintenance projects.

Click on the map to launch the app. Click on any project listed on the left or corresponding number on the map to review project description, budget and location in all Harris County Commissioners Court Precincts.

You will find both the legend and filters in the upper right corner. Red circles represent capital projects and black circles represent maintenance projects. To focus only on one type, click the layer icon in the far upper right. Press one type of project or the other to deselect it.

Active project viewer on HCFCD site. Note: not all of these projects involve flood-bond dollars.

What Capital Projects Include

Capital projects include major projects that reduce flooding risks and damages by:

  • Increasing stormwater conveyance capacity in bayous and drainage channels
  • Excavating stormwater detention basins.

Stormwater detention basins reduce flooding risks and damages during heavy rain events by safely storing excess stormwater and slowly releasing it back to the bayou when the threat of flooding has passed. 

More About Maintenance Projects

Maintenance projects include repair projects aimed at returning flood damage reduction channels and other infrastructure to their original designed level of performance by: 

  • Repairing sinkholes, slope failures and other damage caused by erosion 
  • Removing sediment that can reduce stormwater conveyance capacity. 

Smaller maintenance projects grouped together under one construction contract are often given both individual Project Identification Numbers and an umbrella number that begins with the letter “Z,” since there is often more than one watershed involved in the group. “Z-packages” have numbers such as Z100-00-00-X223. 

What Map Does NOT Include

This map does not include flood damage reduction studies or projects in other preliminary phases; smaller maintenance projects performed by Flood Control District work crews; or completed construction projects.

Equity?

One of the first things that strikes me about the January map is the lack of projects in the northeastern portion of the county. To be fair, two small maintenance projects have started in Kingwood since the map above was compiled. But still, a glance at the map shows that projects are heavily skewed toward the south, central and western sides of the county.

Example: The construction projects now underway on Brays, White Oak, and Hunting Bayous total more than $100 million. But there are ZERO construction projects underway in Kingwood, Humble, Huffman, Atascocita, Spring, Tomball, and Crosby – all areas hard hit by Harvey.

Fairness to all?

Commissioner’s Court has pushed the Flood Control District to start projects in lower income areas first based. A majority of commissioners worry that low income residents are less able to recover from floods. They also worry that money in the flood bond won’t cover all projects identified in the 2018 flood bond. Some have even talked about floating another bond.

Good luck with that if they don’t adopt a more equitable definition of “equity” which the 2018 flood bond promised!

Posted by Bob Rehak on 1/25/2021 based on public information provided by HCFCD

1145 Days since Hurricane Harvey

HCFCD Data Shows Socially Vulnerable Zip Codes Receive 80% of Buyouts

Harris County Judge Lina Hidalgo, Precinct 1 Commissioner Rodney Ellis, and Precinct 2 Commissioner Adrian Garcia are pushing the idea of a Community Resilience Task Force focused on helping socially vulnerable neighborhoods receive a higher percentage of the $2.5 billion flood bond.

However, zip codes that rank in the top 50% of the CDC’s Social Vulnerability Index (SVI) already receive 80% of Harris County Flood Control District buyouts and 79% of the District’s active mitigation projects.

FOIA Request Reveals Emphasis on SVI Index

Data obtained from HCFCD via the Freedom of Information Act shows that in Harris County…

…the two most socially vulnerable quartiles are FOUR TIMES more likely to receive a buyout.

HCFCD Buyouts Favor Socially Vulnerable Population 4:1

As of 7/28/2020. Source: Data obtained from HCFCD via FOIA request. Quartiles 3 and 4 are the most vulnerable on the CDC’s Social Vulnerability Index.

Here’s how that looks as a pie chart.

HCFCD Buyouts by SVI Quartile. The two most socially vulnerable quartiles receive 80% of all buyouts.

This is not surprising. For months, Hidalgo, Ellis and Garcia have pushed the District to incorporate the Social Vulnerability Index into its priorities. It has worked.

Do We Need More Balance?

Socially vulnerable neighborhoods get 80% of HCFCD buyouts and 79% of flood bond projects. Do those seem like fair percentages to you?

Tell the County Judge Your Opinion

The County Judge’s office is inviting the public to share their thoughts and ideas on the proposed draft bylaws of the Community Resilience Task Force that encourages even more spending by social vulnerability guidelines. 

You can register your opinion from now until July 30th, 2020, via one of the following methods:

  • Email CRTF@cjo.hctx.net and submit comments digitally, beginning July 21
  • Join a virtual focus group via Zoom. After registering, participants will receive a confirmation email containing information about joining the meeting.

For More Information

For more information on the “equity bias,” see this series on “Where Flood Mitigation Dollars Have Really Gone.” It was developed a year ago so the focus is on historical spending.

Or this series:

Posted by Bob Rehak on 7/29/2020

1065 Days since Hurricane Harvey

Harris County Changing How It Will Choose Which Flood Projects to Support; Welcome to the “Equity Bias”

Imagine you pull up to a stoplight and two needy people approach you for a handout. You want to help, but have only $1 in your pocket.

Do you give the dollar to the person who has not eaten for the longest time? Or to the person from the zip code with the highest percentage of minorities and lowest average household income?

As you may have guessed, the people at the stoplight are a metaphor for flood victims.

More Needs than Dollars

Harris County doesn’t have enough dollars to build every flood mitigation project that everyone needs. Flood mitigation requires tough choices.

So the County is setting up a supposedly unbiased task force to decide whom to help. But its composition will be biased toward people who believe flood bond money should favor low income, minority neighborhoods, i.e., the constituents of the three politicians pushing the task force (Judge Lina Hidalgo, Precinct 1 Commissioner Rodney Ellis, and Precinct 2 Commissioner Adrian Garcia).

Stacking the Jury

Look at the proposed overview and bylaws for the Community Resilience Task Force. You will see that they embed the concepts of equity, social justice, and social vulnerability into every recommendation the task force will make. For flood mitigation. Housing. Health. Construction. Urban planning. And more. For the next 30 years!

Proposed bylaws for the task force explicitly state that the members MUST demonstrate:

  • An interest in “equitable” flood mitigation.
  • Interest in socioeconomic and demographic factors that affect resilience.

So they are baking “equitable” into the job descriptions.

Difference Between Equitable and Equal

“Equitable” treatment sounds like “equal” treatment. But it’s not.

Treating people equally means treating them identically. Treating people equitably means treating them differently, but fairly.

For instance, handicapped people get to park closer to the door. That’s fair…based on need.

But what happens when you start making flood mitigation decisions on the basis of race, income, and social vulnerability? Is that fair to more affluent communities destroyed by flooding?

Flood Spending Based on Race and Income?

Ms. Hidalgo, Mr. Ellis, and Mr. Garcia define “equitable” so preference goes to the “socially vulnerable.” Their argument goes like so.

Because poor people have a harder time recovering from floods, they should get more protection from flooding. They can’t afford to flood (…as if anyone can).

Hidalgo, Ellis and Garcia all advocate the use of a CDC social-vulnerability index and LMI (low-to-moderate-income) data to prioritize flood projects.

They argue in meeting after meeting that FEMA bases grant decisions on a benefit/cost ratio (BCR) that favors neighborhoods with more expensive homes. That’s true, but…

Socially Vulnerable Neighborhoods Already Receive Preferential Treatment

They never mention that Department of Housing and Urban Development (HUD) Community Development Block Grants for mitigation (CDBG-MIT) and disaster recovery (CDBG-DR) already favor poorer (LMI) neighborhoods.

Nor do they mention that the County has already received a BILLION dollars in CDBG-DR funds. Or that the Texas General Land Office is sitting on top of approximately $4.2 billion in CDBG-MIT funds that it’s trying to distribute. The vast majority of those funds must go toward LMI/socially vulnerable neighborhoods. (The exact percentages vary by storm and type of grant. But they often range up to 70%.)

Problems With Basing Flood-Mitigation Decisions on LMI Data

There are two more problems with basing flood-mitigation decisions on racial and LMI data.

  • First, it ignores need. Shouldn’t projects that help the largest numbers of people or the worst flooding be mitigated first?
  • Second, LMI data only comes by zip code. Zip codes can mask huge disparities in wealth. So even if you feel poor people deserve more flood protection than the middle class, it’s hard to ensure that result with zip code data. Elm Grove, for instance, is an LMI neighborhood embedded within an affluent zip code.

Mr. Ellis argued that his Precinct One constituents, who are 76% African-American and Hispanic, would not get their projects because money they deserved more was being spent in affluent Kingwood.

He did not mention Army Corps of Engineers grants to HCFCD for work on four bayous in his precinct. Nor did he mention that in the entire history of Harris County Flood Control (which dates back to 1937), not one federal dollar has ever been funneled through HCFCD by the Corps for work in the Lake Houston Area.

4 Out of 5 Flood Bond Projects in SVI Neighborhoods

How much have Ellis, Hidalgo and Garcia skewed flood bond spending to date?

During the Commissioners Court meeting on June 30, 2020, Harris County Flood Control was asked to prepare a report to document the status of flood bond risk reduction projects in socially vulnerable neighborhoods. See Item 2E on Tuesday’s Commissioners Court Agenda. It shows a startling fact.

Out of the 145 active bond projects, 79% are located in high or moderately high SVI areas.

Letter from HCFCD to Commissioners Court

The distribution looks like this.

79% of Flood Bond Projects are located in the most socially vulnerable neighborhoods; only 21% in the least socially vulnerable neighborhoods. Source: Memo to Commissioners Court from HCFCD.

If you live in a “socially vulnerable” neighborhood, you’re 4X more likely to have a flood bond project near you.

And those are just the projects based on Flood Bond money. The Flood Control District is also pursuing additional CDBG grants and Army Corps funding to help fund even more projects in socially vulnerable areas. Those projects are not reflected in these percentages.

Rushing Through Public Comment Period

One measure of how much Ellis, Hidalgo and Garcia want to institutionalize their own definitions of equity is that they’re giving only six more days for public comment with little public warning.

You can bet that the commissioners court meeting on the 28th will be packed with surrogate speakers for Ellis, Hidalgo and Garcia who favor the “equity bias.” They’ve shown up in Commissioners Court for months.

Why wouldn’t they? It’s worked. They now have 4 out of every 5 flood bond projects going into their neighborhoods and they could get even more if this task force goes through in its current form.

Meanwhile, the San Jacinto watershed, says the Greater Houston Flood Mitigation Consortium, received 0% of the mitigation budget prior to Harvey, yet had 14% of the region’s damages during Harvey. 

How Do We Decide What’s Fair?

So, should projects go to neighborhoods that:

  • Had the fewest flood mitigation projects?
  • Flooded the worst?
  • Help the greatest number of people for the dollars invested?
  • Are the poorest?

Or should the money be split equally or on some other basis?

Personally, I think decisions like these should be left in the hands of engineers, not partisan politicians.

Register Your Opinion

The County Judge’s office is inviting the public to share their thoughts and ideas on the proposed draft bylaws of the Task Force. You can register your opinion from now until July 30th, 2020, via one of the following methods:

  • Email CRTF@cjo.hctx.net and submit comments digitally, beginning July 21
  • Join a virtual focus group via Zoom. After registering, participants will receive a confirmation email containing information about joining the meeting.
  • Offer input during the July 28th Commissioner’s Court

Posted by Bob Rehak on July 24, 2020

1060 Days since Hurricane Harvey


For more information on the “equity bias,” see this series on “Where Flood Mitigation Dollars Have Really Gone”

Or this series on “The Equity Flap”

Where the Flood Mitigation Dollars Have Really Gone: Part 4

The last three posts on the equity flap have focused on how minority neighborhoods in Precinct 1 already receive more flood mitigation funding than affluent areas like Kingwood. Tonight, I focus on why that is likely to continue for the foreseeable future. But first, a recap for context.

Biggest Beneficiary of Funding Claims Discrimination

Last Tuesday, the equity flap erupted again in Harris County Commissioners Court. Precinct 1 Commissioner Rodney Ellis complained that because of historical discrimination (i.e., slavery, which was abolished more than 150 years ago), he needs to fight for “equity” in the distribution and implementation flood bond projects. Precinct 1 already receives the lion’s share of many types of funding.

What Mr. Ellis does not point out to the Commissioners Court is that Precinct One:

Exploiting Past Wrongs to Perpetuate Inequity

When talking about “historic discrimination,” Commissioner Ellis needs to shift his focus forward in time and look at other areas of the county that receive NO such joint projects and far fewer flood mitigation dollars. Take the San Jacinto Watershed, for instance. It contains Kingwood. Because of Kingwood’s affluence, it’s one of the favorite whipping boys for Commissioner Ellis and his surrogates who argue for equity. They keep bringing equity up every time a Kingwood-related item is on the Flood Control agenda at commissioners court. But the Kingwood/Lake Houston Area has NO such joint projects. Why?

Causes of Inequity

There are two reasons for this inequitable distribution: one obvious, one not so.

First, the obvious: The Houston region has grown from the downtown area outward. Precinct 1, which includes downtown, is older. Flood problems became apparent sooner. Precinct 1 documented problems, identified solutions, and rallied Federal support decades ago.

Commissioner Ellis’ predecessors also started this process decades ago and Precinct 1 enjoys the rewards today. As a consequence…

Buffalo Bayou and all of its tributaries are eligible for Corps support on non-emergency projects; the San Jacinto is not.

The Corps is working on Buffalo Bayou and all of its tributaries thanks to legislation passed years ago. The Cypress Creek watershed actually overflowed into the adjoining watershed during Harvey. For a complete Corps presentation on Buffalo Bayou and its tributaries, see this link.

Even though the problems in the Lake Houston Area have been building for decades, the danger didn’t become apparent until Harvey.

At this point, rallying the kind of Federal support that Precinct 1 has historically enjoyed will involve an act of Congress and Presidential approval. Literally. That’s an uphill battle compared to the battle that Mr. Ellis’ projects face.

Political Challenges for San Jacinto Watershed

A local sponsor, such as the City, would have to file an application for a project. Congressional representatives would have to get the President to build it into the annual budget, then include it in the Water Resources Development Act. Both houses of Congress would have to pass the act. The President would have to sign it. And then the government would have to distribute the money. The distribution usually happens in phases, after approval of each phase of a project, such as:

  • Feasibility study
  • Engineering and design
  • Construction, operation and maintenance
  • Changes after construction authorization
  • Changes after construction

It could easily take three to five years just to get the engineering and design phase on a project, such as additional flood gates for Lake Houston.

A second challenge: Mr. Ellis and his surrogates using unfounded “equity” arguments to further handicap and delay flood mitigation in the Lake Houston Area.

Damages in Lake Houston Area

Unfortunately, the sedimentation and conveyance problems on the San Jacinto only became apparent after decades of additional upstream development. That exacerbates flooding by funneling water to the river faster. In recent years, Conroe was the fastest growing city in America.

Then along came the Tax Day, Memorial Day and Hurricane Harvey floods. They deposited an estimated 5 to 10 million cubic yards of sediment in the East and West Forks. Much of that came from sand mines upstream of Lake Houston, which Lake Conroe inundated when it released 80,000 cubic feet per second at the peak of the storm. This further exacerbated flooding by backing water up in the river and drainage ditches.

As a result, the Lake Houston area suffered billions of dollars worth of damage to schools, bridges, roads, homes, churches and businesses during Hurricane Harvey. At least 13 people in the Kingwood Area died as a result of the flood, 12 in ONE senior living complex.

Two Wrongs Don’t Make a Right

Citing historical discrimination that goes back to pre-Civil-War days, Mr. Ellis argues for equity to increase his precinct’s share of flood mitigation dollars and to accelerate projects in his precinct.

As the data shows, his precinct already has far more than its fair share of mitigation dollars. Now, he threatens other areas, property and lives by delaying and usurping their aid.

If any area is underfunded and fighting discrimination now, it’s the Lake Houston Area. Ironically, the discrimination is coming from the Rodney Ellis’ of the world.

I don’t begrudge Precinct 1 a penny of the flood mitigation funds it has received to date. And I admire Mr. Ellis for fighting so hard for his constituents. However, I despise the way he does it.

Mr. Ellis represents one fourth of the people in the county. Yet he cries “equity” and ignores facts to usurp more than half of flood mitigation funding and put his Bond projects at the front of the construction line. I wish he would acknowledge:

  • The inequality that exists in current funding and that is likely to continue for years.
  • That a Kingwood, Humble, Atascocita or Huffman life is as valuable as a life in Precinct 1.
  • Facts.

Ironically, the Lake Houston Area argued for equity in the bond language to prevent the very kind of reverse discrimination that we are now seeing. We need to work together to mitigate flooding everywhere as quickly as we can. This equity flap is fanning racial flames that divide us, perpetuate distrust, delay mitigation, and threaten lives. It’s time to get on with the hard work at hand. Two wrongs don’t make a right.

Posted by Bob Rehak on 6/28/2019

668 Days since Hurricane Harvey

Where Flood Mitigation Money Really Goes: Part Three

Yesterday, the equity flap continued in Harris County Commissioners Court. Surrogates for Precinct 1 Commissioner Rodney Ellis again took the podium to talk about how affluent neighborhoods deprived low-to-moderate neighborhoods of flood mitigation dollars. The argument they use: FEMA prefers buying out high dollar homes to reduce repetitive flood insurance losses.

Commissioner Ellis describes his district as 78% African-American and Hispanic, with another 6% from other minorities. And according to HUD, Precinct One contains many low-to-moderate-income neighborhoods. See below.

Low-to-moderate-income neighborhoods by precinct in Harris County.

Harris County has four precincts; each has roughly the same number of people. In an equitable world, you would expect roughly 25% of the buyouts to be in each district. If there really is a “buyout bias” against low income neighborhoods, you would expect Precinct 1 to have less than 25%. But it doesn’t.

Precinct 1 Gets More Than Its Fair Share of Buyouts

Under the Freedom of Information Act, I requested the number of buyouts in Precinct 1 and other precincts since 2000. Once again, hard data contradicts the self-serving myth. Since 2000, when buyouts began in Precinct 1, HCFCD bought 955 homes in Precinct 1 and 2,413 homes in other precincts.

Precinct One has slightly more than its fair share of buyouts.

So where’s the discrimination in buyouts?

HCFCD is buying out homes faster than ever. To learn more about their process, visit this page. With FEMA funds from Harvey, HCFCD hopes to buy out 1,100 homes in the next few years. By comparison, the District bought out only 2,075 homes in the 32 years before Harvey.

Precinct 1 Gets More Than Its Fair Share of HCFCD Construction

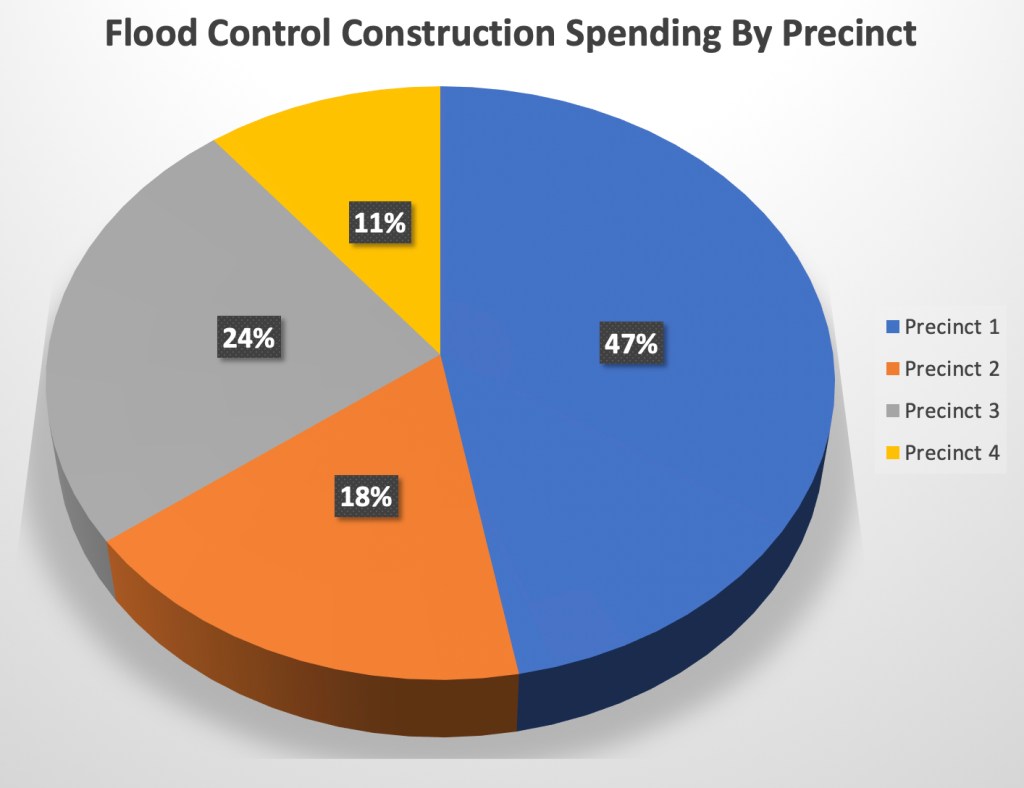
In part one of this series, we learned that Precinct One gets the lion’s share of Harris County Flood Control District construction spending for flood mitigation.

Precinct One receives almost half of all Flood Control District spending on construction, leaving the other three precincts to divvy up the other half.

Precinct 1 Gets More Than Its Fair Share of Federal Benefits

In part 2 of this series, we also learned that five of the six active federally-funded flood mitigation construction projects in Harris County are on bayous that flow through Precinct One. No other precinct comes close to receiving that kind of support. That means Precinct One receives more benefits from federally funded flood mitigation projects than any other Precinct in Harris County.

Based on total estimated contributions when completed. Data source: Harris County 2018 Federal Report.

If Commissioner Ellis or his surrogates have any data to back up their claims of discrimination in flood mitigation spending, they should share it. In every commissioners court meeting they spout the same half truths to bolster their share of flood mitigation dollars. So far, it appears to be working quite well for them. And not so well for residents in other precincts.

Posted by Bob Rehak on 6/26/2019

666 Days since Hurricane Harvey