Those few who attended a meeting at the Humble Civic Center on October 3, 2022, hoping to get more details about the proposed new Harris County bond offerings were sorely disappointed. County Judge Lina Hidalgo, and Commissioners Adrian Garcia and Rodney Ellis are asking voters to approve $1.2 billion in bonds before the three have identified projects totaling $1.2 billion. The lack of defined projects and the lack of language in the bond that would guarantee a fair distribution of money should have all voters on high alert.
Bait and Switch?
I got the distinct impression voters are being set up for a bait-and-switch.
Neither does the ballot language, the bond website, nor the promotional literature.
Promotional literature mentions a minimum $220 million per precinct. But the bond language does not. And that’s the only thing that’s legally binding. So there’s no guaranteed minimum per precinct, even though Hidalgo, Ellis and Garcia said there would be.
This reminds me of when Ellis bragged openly in Commissioners Court about how he tricked voters in the flood-bond election by redefining “equitable distribution of funds” after the vote. I just don’t trust these three.
Something Ain’t Right Here
My first tip-off that this meeting would be a bust was the nearly empty parking lot when my wife and I arrived five minutes before the start time. Clearly, the county had not advertised the meeting widely. Once inside, I noticed more strangeness.
Many of the displays sat behind tables – too far away to see any detail.
I found no one at the tables who would answer questions.
Staff outnumbered residents.
During most of the meeting, only three or four visitors at a time wandered through the cavernous space. I counted seven residents briefly at the high point.
Translators outnumbered residents most of the time.
I didn’t see one person entering suggestions at a table with a dozen laptops for that purpose during the hour I was there.
No one could produce a copy of the bond language. One staff member said it was “on the bond website.” I visited the site as we talked; it wasn’t. And still isn’t.
Equity, Lop-sided Spending, Minimum Distributions, Maintenance Not Disclosed in Bond Language
The bond language is, however, now posted on a sample ballot at HarrisVotes.org, the election administrator’s website.
See the jpeg below. It’s notable for what it doesn’t include. The bond language mentions nothing about “equity”, the lop-sided spending proposed by Hidalgo, or a minimum per precinct. Nor does it mention maintenance.
Three sentences of explanation contain no detail about where the $1.2 billion would be spent.
Nothing in the language would prevent Democrats from spending ALL the money in their own precincts.
If re-elected, they could change their minds about a minimum at any time, and blow it all on maintenance.
Compound Interest on Maintenance Expenses?
Let’s discuss maintenance. The official ballot language makes no mention of it. However, the bond website does.
That maintenance money would be paid back over 30 years WITH INTEREST. So fixing that pothole could easily cost 7X the out-of-pocket costs at today’s interest rates.
This is how $100 million worth of work turns into $700 million in debt.
And that’s why most bonds discourage spending money on maintenance.
Maintenance should be handled out of current income, not long-term debt. But Hidalgo, Ellis and Garcia propose borrowing to pay for it. And that’s just a bad idea. The potholes they fix now will need to be refilled a dozen more times before the bond is paid off. Who will pay for those repairs? And how?
Misleading Project Sheets
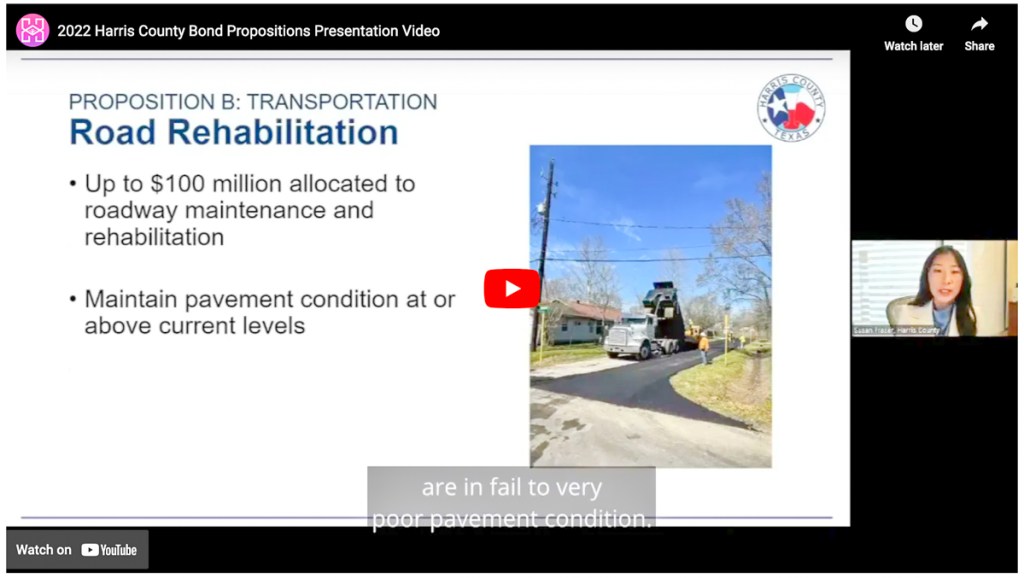
The meeting handouts, bond, and bond website discuss spending CATEGORIES. But they still do not mention one actual proposed project within any category – the main criticism of this bond package to date.
The County did have “project sheets” at the display tables. But staff wouldn’t let residents take them. I suspect I know why.
If you look closely, you can see that they were labeled “current” or “active” projects. That means the projects shown already had funding. They were NOT candidates for the PROPOSED bond. After lengthy, pointed questioning, a staff member admitted that to me.
Active projects masquerading as proposed projects.
Were such sheets simply displayed to create the appearance of a plan?
The visitors I talked to said they thought the lists contained proposed projects. They didn’t. They only contained examples of projects that could be covered – not those that will be.
Ellis, Garcia and Hidalgo haven’t yet made the effort to define one needed project, though they say the need is critical.
If it’s so critical, how come they can’t cite one example? This is such a contrast to the last bond election!
Free License to Spend Your Money
YES votes would give Hidalgo, Garcia (if both are re-elected) and Ellis a mandate to use your money when and where they want. And that would not include Republican-leaning precincts. One expert on Harris County government bond offerings told me that the lack of public input gives them license to do as they please. The language doesn’t even contain provisions that would force them to spend money within the categories they discuss.
As one finance expert told me today, “This is how Houston got into trouble. Once you get under that mountain of debt, it’s just about impossible to dig your way out,” he said.
Another bonding expert suggested, “A good slogan for this bond would be ‘Just Vote No. No Projects, No Transparency, No New Taxes – No Way!'”
Posted by Bob Rehak on October 7, 2022
1865 Days since hurricane Harvey
The thoughts expressed in this post represent opinions on matters of public concern and safety. They are protected by the First Amendment of the US Constitution and the Anti-SLAPP Statute of the Great State of Texas.
https://i0.wp.com/reduceflooding.com/wp-content/uploads/2022/10/20221007-Screen-Shot-2022-10-07-at-5.17.56-PM.jpg?fit=1200%2C677&ssl=16771200adminadmin2022-10-07 20:30:012022-10-08 12:09:39Backward, Bait-And-Switch Bond Meeting a Bust
Correction: since posting this, I have learned that Community Services has not even started compiling a list of projects that will comprise the Method of Distribution. The department has only defined a “process” for compiling the list and is waiting for “direction from leadership.”
On September 8th, the Harris County Community Services Department (CSD) distributed a schedule showing that it would complete the first draft of its Method of Distribution (MOD) for spending $750 million in mitigation funding by the end of the month.
The Texas General Land Office (GLO) and U.S. Department of Housing and Urban Development (HUD) allocated the money to Harris County earlier last year. The draft MOD will now hopefully go to the GLO for review and approval by the end of October.
What MOD Entails
Early last year, the GLO allocated the money to Harris County along with another $450 million to the Houston-Galveston Area Council.
A MOD lists projects and amounts. It shows how Harris County wants to distribute the money, i.e., who will get how much for what from the $750 million.
US 59 at Townsen Boulevard during Hurricane Harvey
The GLO must verify that all planned expenditures meet requirements of the funding allocated by HUD and Congress.
After a public planning meeting on September 8th, CSD spent the rest of September developing a draft Method of Distribution (MOD) for the $750 million. The department will now submit it to the GLO for review and preliminary approval. Steps after that include:
Publish Draft MOD by October 30
Nov 15-Dec 2 – 15-day public comment Period and hearing
Contract entities included in the MOD with funding level and gain confirmation of participation via Funding Acknowledgement Letter from entity
Dec 5-7 – Document Responses to Public Comment, add to Draft MOD document
December or January- Draft MOD document approved at Commissioners Court
January 2023 – Final MOD document submitted to GLO
GLO approval of final MOD and MOD allocated entities complete project information package process
March/April 2023 – MOD Entity project information packets submitted to GLO for review and approval
Kick-off contract development for projects.
So, the GLO has until the end of the month to review and approve the draft MOD. Once approved, CSD can publish it. Then CSD will hold more public meetings and submit any revisions to Commissioners Court and the GLO for final approval.
Pressure On to Develop Projects Quickly
Expect projects to begin sometime in the second quarter of 2023. But keep in mind that all dates are subject to change.
Starting to develop projects almost six years after Harvey will put some pressure on Harris County Flood Control and any other entities designated as recipients.
50% of the grant must be expended by Jan. 12, 2027.
100% must be expended by January 12, 2032 – 15 years after Harvey
Half of the $750 million must be spent within four years. To put that in perspective, Flood Control estimates it’s only 23.5% done with a 10-year flood-bond package four years after it was approved by voters.
Posted by Bob Rehak on 10/1/2022
1859 Days since Hurricane Harvey
https://i0.wp.com/reduceflooding.com/wp-content/uploads/2021/05/TS-Harvey-8-30-17-209.jpg?fit=1024%2C768&ssl=17681024adminadmin2022-10-01 13:48:452022-11-17 11:31:08$750 Million MOD Going to GLO
The Harris County Flood Control District (HCFCD) August update to County Commissioners on the progress of the 2018 flood bond shows a continued lopsided distribution of funds in favor of low-to-moderate income (LMI) watersheds. It also showed slowing activity overall.
Separately, the County has posted a new website and scheduled input sessions for Adrian Garcia’s proposed new $1.2 billion bond proposition(s). The dates of input sessions relative to the legislative deadline for bond language make it clear that the bond language will not reflect much voter input.
Lopsided Distribution of Funds Continues for Flood Bond
Five watersheds with a majority of LMI residents have received 39% of all the flood bond spending. LMI is defined as “below median income for the region.” Brays, Greens, White Oak, Halls and Hunting watersheds received a total of $430.4 million – an average of $86 million each. Together, the other 18 watersheds received $443.5 million – an average of $24.6 million each. Countywide projects received the rest – $217 million.
Awarded only one new construction contract valued at $1 million.
Awarded three new agreements with other contractors but spent $0 with them.
Completed 19 buyouts compared to 21 the previous month.
Spent $2.4 million on buyouts compared to $6.6 million the previous month.
The total value of active capital improvement construction projects fell to $225.8 million from $231.9 million in July and $235.6 million in June. Out of that, the Lake Houston Area still only has $2,000 or 0.0009% of the total. Although that should improve in the future, it could also worsen, depending on election outcomes in November.
Total reported bond spending increased to $1.1 billion, up from $1.06 billion the previous month, an increase (with rounding) of slightly more than $40 million.
Overall progress of the bond program? 23.5% complete – four years into a 10-year program.
However, HCFCD believes it is only slightly behind schedule. The District’s key performance indicators stayed steady at .97 percent.
Major-Maintenance Flood-Bond Spending Holds Steady, but Still Lopsided
Major maintenance projects held fairly steady. HCFCD spent $78.4 million in August compared to $78.8 million in July. But there’s only one maintenance project in the entire northeastern section of the county – some drainage system repairs in the Jackson Bayou watershed with an unspecified value. It’s unspecified because the report lumps it together with two projects in the Halls Bayou watershed. The total for all three is about $1 million. Assuming each project got one third of that million, the entire northeastern section of the county received 0.42% of all the maintenance spending from the bond last month.
The largest group of maintenance projects is along Cypress Creek and its tributaries. There are 14 projects valued at $48.1 million. That’s 61.4% of the major-maintenance total.
That’s right. Garcia wants to spend twice as much on hike-and-bike trails as public safety.
The county will hold four open houses in each of the four precincts during the next five weeks. It will also hold four virtual open houses. For a complete schedule, see HarrisCounty2022Bond.org.
The one input session in the northeastern section of Precinct 3 will be at the Humble Civic Center at 6PM on October 4th. Neither Kingwood, Huffman, Atascocita, nor Crosby will have its own input session.
Bond Language Will Not Reflect Voter Input
The county must post bond language by September 30 at the latest. But the input sessions run until October 20th. Early voting starts on October 24. And Election Day is November 8. So the bond language will not reflect much voter input. Neither the county, nor media, will have much time to digest voter input. It’s pure political theater.
The bond website simply says that “Input will be shared with Harris County Precinct staff as they make decisions regarding future projects.”
The bond website provides absolutely no detail about SPECIFIC PROJECTS or WHERE projects would be – despitepromises made by the County Administrator to Commissioners Court.
Equity and Political Leaning Will Guide Distribution of Garcia-Bond Funds
Commissioners Ramsey and Cagle argued for months to delay the bond referendum until details could be nailed down, but Hidalgo, Garcia and Ellis refused.
During debate in Commissioners Court, it became clear that Hidalgo, Garcia and Ellis intend to use “equity principles” to divvy up the money, not just to prioritize the start date of projects as they did with the 2018 flood bond. Hidalgo, Garcia and Ellis even passed a motion that would give Democratic-leaning Precincts about 40% more money than Republican-leaning Precincts. For instance, Precinct 3 would be guaranteed only $220 million. That’s 18% of the total even though P3 has 47% of the county’s unincorporated area to maintain, improve and patrol.
Why Trust in Government is Eroding
During debate, Rodney Ellis even bragged about how he redefined “equitable distribution of funds” in the 2018 Flood Bond text after the election.
My takeaway: Hidalgo, Garcia and Ellis don’t want to be held accountable. They talk transparency, but this is nothing more than a slush fund. And this is why trust in government is eroding in my humble opinion.
Posted by Bob Rehak on 9/20/22
1848 Days since Hurricane Harvey
The thoughts expressed in this post represent opinions on matters of public concern and safety. They are protected by the First Amendment of the US Constitution and the Anti-SLAPP Statute of the Great State of Texas.
https://i0.wp.com/reduceflooding.com/wp-content/uploads/2022/09/20220920-Screen-Shot-2022-09-20-at-2.22.40-PM.jpg?fit=1200%2C923&ssl=19231200adminadmin2022-09-20 20:03:512022-10-01 12:54:45Flood- and Garcia-Bond Updates
Late in the afternoon on 9/13/22, my phone started blowing up. Frantic callers asked, “Are you watching Commissioners Court?” I wasn’t unfortunately. I was working on a post about the completion of a flood-mitigation project. But my priorities quickly changed when I learned that the three Democrats (Garcia, Ellis and Hidalgo) voted – as a block – to take take “no action” on 32 separate projects. Each will deprive residents of Precincts 3 and 4 of services.
Adrian Garcia, Rodney Ellis and Lina Hidalgo removed 32 items from the 8/13/22 Harris County Commissioners Court Agenda that would have helped residents of Precincts 3 and 4.
The brazen no-action votes, led by Precinct 2 Commissioner Adrian Garcia, were in retaliation for Republican commissioners walking out of a vote that would have allowed Democrats to increase taxes at a time when rising inflation makes larger tax bills doubly difficult.
A quarter of the no-action votes directly targeted residents. The other three-quarters target companies that provide services that benefit residents, such as engineering companies that improve drainage.
Targeted items included residents’ community center wellness classes, maintenance, flood-rescue equipment, roadway improvements and drainage projects.
Violating Historical Norms
By agreement and tradition, historically, Harris County Commissioners do not interfere with each others’ business. So this sets a dangerous precedent in which one party weaponizes its majority to punish the opposition’s constituents. Here’s what happened.
Ramsey and Precinct 4 Commissioner Jack Cagle boycotted the meeting so that the Court would not have sufficient votes to raise taxes. In retaliation, Commissioner Adrian Garcia, aided by Commissioner Rodney Ellis and County Judge Lina Hidalgo, pulled dozens of Precinct 3 and 4 items from the agenda.
Commissioner Ramsey said in a press release that, “This is retaliation against Harris County residents at its lowest level. It punishes residents because they disagree about having a responsible fiscal budget. It’s childish and embarrassing for the Court and Harris County.”
Ramsey and Cagle have tried for several months to engage their Democratic counterparts in substantive budget discussions with little luck. The Democrats even rammed through a $1.2 billion bond proposal with no details except for a lopsided allocation plan that gave about 40% more to Democratic precincts.
Previously, Commissioners have agreed to respect the boundaries of one another’s precincts. “Today’s action is the latest example of Precinct 3 residents being stripped of services by the current Court,” said Ramsey.
Ramsey’s allusion to “latest” referred to a redistricting plan that left Ramsey with 47% of the county’s unincorporated area to maintain with only 25% of the budget.
Said Ramsey, “Judge Hidalgo and others would have you believe that since there was not a quorum at today’s Commissioners Court, the budget will fail. In reality, the lack of a quorum simply means that the maximum tax rate allowed by law – without voter consent – cannot be implemented. Instead, a smaller budget will be adopted.”
The difference between the two budgets is $100 million. Out of a $2.2 billion budget, that’s 4.5%.
Hidalgo counters that the extra money is needed for more “officers.” According to Ramsey, she referenced investigators and detention officers, “yet didn’t mention adding one patrol officer” who could combat street crime.
Hidalgo also threatened that if the maximum budget and tax rate aren’t passed, 180 flood projects that “…affect the lives of every single resident in Harris County” will be jeopardized. But the bond pays for those projects, and the difference between the two budgets for flood control is only $14 million. That’s .6% of the HCFCD’s budget. And Commissioners Ramsey and Cagle volunteered $7 million each from their precinct budgets to make up the difference.
Finally, Judge Hidalgo asserted that not passing the Voter-Approved-Rate budget instead of the No-New-Revenue budget would dramatically affect the Harris Health System. The difference between the two budgets is less than 2%. And Ramsey points out that many of the Health System’s requests are for capital investments which are not even a part of these budgets at all.
On-Call Engineering Contracts Delayed by Dems
So which projects did Dems pull from the agenda? Let’s start with retainer fees for on-call engineering in Precincts 3 and 4. The numbers below refer to agenda items. See full descriptions here.
#43 Pape-Dawson Consulting Engineers, Inc. for Precinct 3
#44 Volkert, Inc. for Precinct 3
#45 Cascade Civil Services, LLC for Precinct 3
#49 HVJ Associates, Inc. for Precinct 4
#52 Eneval, LLC for Precinct 4
#53 Volkert, Inc. for Precinct 4
Engineering Contracts for Specific Projects Also Delayed
In addition, the Dems agreed to delay approval of engineering contracts or contract amendments for specific projects in Precincts 3 and 4..
#51 Request to amend a contract Isani Consultants, L.P. for Professional Engineering Services relating to Stuebner Airline Road Segment C in Precinct 3.
#55 Approval of a contract with Edminster, Hinshaw, Russ and Associates, Inc. d/b/a EHRA to develop a Master Plan for improvements to Burnett Bayland Park in Precinct 4.
#67 Approval of an amendment to a contract with Huitt-Zollars, Inc. for improvements to Atascocita Area Trails Phase 2 in Precinct 3.
#76 Approval of Interlocal Agreement with City of Tomball to construct improvements to Nabors Parkway between Highway 249 and Holderrieth Road in Precinct 4.
#114 Approval of a contract with HNTB Corporation for engineering and landscape architecture services for a Road and Drainage Master Plan, Precinct 4.
Bizarre Delay
For unknown reasons, the Dems also voted to pull the following from the agenda:
#119 Request for approval to change the names of several projects in Precinct 3.
Delaying Release or Retention of Financial Surety
The following motions relating to approval of the release or retention of financial surety from developers were also taken off the agenda.
#123 Grand Oaks Section 9 in Precinct 4.
#124 Breckenridge West Section 7 in Precinct 3.
#125 Breckenridge West Section 10 in Precinct 3.
#126 Bridge Creek Section 2 in Precinct 3.
#127 Bridgeland Creek Parkway in Precinct 4.
#128 Bridgeland Sec 44 in Precinct 3.
#129 Bridgeland streets in Precinct 4.
#131 Groves Section 35 in Precinct 3.
#132 Groves Section 36 in Precinct 3.
#133 Newport Section 7 Partial Replat #3 in Precinct 3.
#134 Newport Section 7 Partial Replat #4 in Precinct 3.
#135 Windrow Section 3 in Precinct 4.
Delaying/Denying Services Directly Affecting Public
The items that most directly and immediately affect residents include the following. Garcia, Hidalgo and Ellis took each off the agenda.
#155 Approval to negotiate an agreement for surveying as needed in Precinct 3.
#160 Approval to convert Sam Houston Tollway Segment #3 in Precincts 3 and 4 to an all-electronic roadway.
#278 Approval to construct pedestrian trails along a drainage ditch of Brays Bayou under Addicks Clodine Road Bridge in Precinct 3.
#291 Renewal of 1-year contract for exercise classes in Precinct 3.
#342 Approval to bid reinforced concrete pipe, saddle inlets and related items for Precinct 4.
#343 Approval to bid asphalt roadway rehabilitation for the Western Trails Subdivision in Precinct 3.
#351 Approval to bid airboat and trailer purchases for Precinct 3.
#352 Approval to bid passenger buses for Precinct 3.
Most Troubling Item Cancelled, Not Just Delayed
#351 is especially concerning because the airboats would presumably be used for rescue operations during flooding…something the Lake Houston Area remembers all too well. The Dems outright cancelled that; they didn’t just delay it.
Watch the meeting and form your own opinions. Apocalyptic predictions take up the first three hours and fifty minutes. Garcia then starts listing the agenda items he wants to kill or take off the agenda.
Posted by Bob Rehak on 9/14/22
1842 Days since Hurricane Harvey
https://i0.wp.com/reduceflooding.com/wp-content/uploads/2022/09/20220913-Screen-Shot-2022-09-13-at-11.48.04-PM.jpg?fit=1200%2C629&ssl=16291200adminadmin2022-09-14 01:10:112022-09-14 19:26:54Dems Deprive Republican Precincts of Services
At the end of August, I checked with Harris County Flood Control District (HCFCD) to see how excavation of the new Woodridge Village detention pond was coming and what the next steps are.
Before and After Photos
The two photos below show the extent of excavation at the end of July and today.
The far end of the pond reached slightly past the second cluster of storm sewers at the end of July.By the end of August, excavation had reached the far end of the second pile of storm sewers.
Eventually, the new detention basin could reach to or past the cluster of trees in the background.
Rough layout showing the excavation limits for Sprint. Right now, they’re in the lower left of the green area.
Progress by the Numbers
From February through August, 2022, Sprint Sand and Clay has removed 55,167 Cubic Yards of dirt from the area where a new detention pond will eventually be built.
Eventually, they could double the amount of detention on the site. Sprint’s contract lets them remove up to 500,000 cubic yards and sell the dirt at market rates. In exchange, HCFCD will pay them only $1,000. The minimum amount to be removed under the contract is 5,000 cubic yards per month.
Since January, Sprint has managed to beat the minimum each month. But regular reports show the rate of excavation slowing with the housing market.
At 6,000 cubic yards per month, Sprint exceeds the contract minimum. But it would take the company another six years to reach 500,000 cubic yards. Flood-weary Elm Grove and North Kingwood Forest residents pray it doesn’t take that long.
Slowing Rates Reflect Slowdown in Housing
The slowing rates of removal reflect a slowdown in the housing market. The Census Bureau reports that privately‐owned housing starts in July were 9.6 percent below June and 8.1 percent below July 2021. TradingEconomics.com reports that the housing sector has been cooling down amid soaring prices of materials and rising mortgage rates. The Census Bureau has not yet released August rates.
Luckily, this project and others in the Kingwood Area could potentially accelerate soon.
Status of Preliminary Engineering Review on Taylor Gully
According to Black, HCFCD can’t just extend the Idcus contract. HCFCD will have to start over with a request for qualifications (RFQ) for final design of the Woodridge Village detention basin and other improvements along Taylor Gully.
“That’s because the money that we’re going to use is coming from this year’s earmark from Congressman Crenshaw,” said Black. “Because federal funds are involved, we have to issue a new RFQ. We can’t use the consultant we already have just by default. So it will take us a little bit longer. By the end of this year or the beginning of next, we need to get a consultant selected, based on qualifications, once those grants come to fruition. In this case, they will be through the EPA.”
https://i0.wp.com/reduceflooding.com/wp-content/uploads/2022/09/20220902-DJI_0362.jpg?fit=1200%2C799&ssl=17991200adminadmin2022-09-02 22:01:402022-09-03 11:08:20Update on new Woodridge Village Detention Pond
Harris County Flood Control District (HCFCD) spending data on right-of-way acquisition and construction for the first half of 2022 shows that, once again, the San Jacinto watershed has been ignored. Thus, the largest watershed in the county received virtually no help in terms of flood-mitigation funding.
Brays, where Precinct One Commissioner Rodney Ellis lives, received $89.4 million for the completion of Project Brays. But the San Jacinto watershed and Kingwood, which he constantly berates for getting “all the money,” received only $200 thousand. Cedar Bayou, also in the northeastern part of the county, received only $160 thousand. Buffalo Bayou received only $230 thousand.
Thus, Ellis’s Brays received 389X more than Buffalo Bayou. 447X more than San Jacinto. And 559X more than Cedar. All in the name of equity.
Here’s the right-of-way and construction data from my FOIA Request in a bar graph. Do those blips on the right below make you feel ignored?
Harris County ROW and Construction dpending data obtained via a FOIA Requestfor Q1 and Q2 2022
Here’s the same data in a table, again arranged from highest to lowest.
If it weren’t for money contributed by Federal, State and City sources, virtually nothing would get done in this part of the county. So far, Harris County has mostly paid for studies. But the studies do no good without construction to back them up. They’re just yellowing paper on a bookshelf somewhere.
It looks like the Democrats are hoarding money hoping for a larger majority in November so they can move around – at will – the remaining money in the bond.
Hypocrisy of “Worst First”
Since 1979, floods have ravaged the northeastern part of the county more than most.
Historical flood-loss map of Harris County since 1979. From MAAPnext.
And during Harvey, we had the highest water above flood stage in the county – 20+ feet! Compare that to representative locations in watersheds getting the lion’s share of funding.
Chart showing feet above flood stage of 33 gages of misc. bayous in Harris County during Harvey.
It’s much more difficult to survive a 20′ flood than a flood that’s two or three feet.
When Will This Political Torture End?
The Democratic majority on Commissioners Court has proven that it won’t play fair. It’s up to voters to create a new majority in November and right this wrong. People’s lives are at risk.
Imagine being trapped in one of these as water rose during Harvey. Parts of other townhomes were swept away and now lie at the bottom of Lake Houston somewhere.
If you lump historical spending on top of first-half spending, the disparities become even more exaggerated. Get mad, people. Your silence only emboldens them. Demand fairness. Demand change.
Posted by Bob Rehak on 9/1/22
1829 Days since Hurricane Harvey
https://i0.wp.com/reduceflooding.com/wp-content/uploads/2022/09/Jan-June-22-Spending-by-Watershed.png?fit=1490%2C968&ssl=19681490adminadmin2022-09-01 17:24:032022-09-01 22:34:02San Jacinto Watershed Still Virtually Ignored
Those who watched Harris County Commissioners Court on Tuesday, 8/2/22, soon realized they were in for some gripping political theater. The meeting started with a parade of 60 people making public comments. They took up more than three hours. It felt like the vast majority spoke in favor of Adrian Garcia’s proposed new $1.2 billion bond. And of those, the vast majority were Sheriff’s Deputies from a department Garcia once headed. Not one constable appeared.
File photo of Adrian Garcia, Precinct 2 Commissioner.
The speakers may have been describing real needs. But if the needs were really that critical, why did the deputies never complain before? I find so many sudden and simultaneous complaints highly suspicious, as if someone orchestrated them.
But it wasn’t just the orchestration that raised questions about Garcia’s $1.2 billion bond proposal.
Conflicting Cues
Conflicting cues throughout the day left me doubting and distrustful. The pieces just didn’t add up. The performers in this melodrama stumbled all over each other – for more than five hours in total if you include the debate time on Garcia’s bond motion.
Neither Hidalgo, Ellis, Garcia, the County Administrator, nor Budget Director could actually name one project where the money would go, despite previous promises to at least compile a list of flagship projects.
If needs are so glaring, compiling a list should be quick and easy.
During the debate, it came out that much of the money from the 2015 bond program still has not been spent. That raised the question, “Why do we need another bond?”
The County Administrator and Budget Director claimed the bond would not increase property tax rates. But they did not calculate the impact of skyrocketing valuations and their impact on the total cost of tax payments – at a time when personal income can’t keep pace with inflation and food banks can’t keep pace with demand.
As if on cue, Hidalgo, Ellis and Garcia repeatedly said the money would go to the “worst areas first.” But they refused to define “worst.”
Neither Ellis nor Garcia mentioned the $1.25 billion collected by the City of Houston in drainage fees during the last decade or how their Precincts largely overlap with the City and other municipalities. The cities are supposed to foot the bill for drainage and street repairs within their boundaries. The County focuses on unincorporated areas.
Red “Equity” Flags
Ellis also spoke of the need to apply “equity” guidelines to Garcia’s new $1.2 billion bond proposal.
Ellis openly bragged that he had a behind-the-scenes agreement to define “equity” in the 2018 flood bond in a way that the flood-bond language did not disclose. That made one wonder whether the three Democrats would play similar word tricks with voters in this bond.
In the middle of all this, a consultant presented a compensation survey of county employees. Ellis and others suggested that “equity” guidelines should apply to low salaries and that the county should cap high salaries. No one ever addressed “pay for performance.”
The Court voted 3-2 to allocate $220 million from the bond to the two Republican-leaning precincts, leaving $380 million each for Garcia and Ellis.
Connecting a lot of dots in this rambling meeting, I started to feel that the $1.2 billion was Garcia’s attempt to secure a slush fund for political patronage workers, vendors, and pet projects that would shore up his re-election chances. Could that be why he pushed so hard to put this on the ballot this year rather than next?
Many Unanswered Questions
In a previous meeting, Garcia threatened to withhold money from Republican-leaning precincts if their commissioners did not support his bond.
Why use such threats if you plan to distribute money fairly?
And if you plan to distribute the money fairly, why not disclose the methodology?
Why spring this on people two months before the election?
What’s the resistance to identifying projects?
How could you even determine the “worst” without a list of competing projects?
It would only take a few more months to put together a plan based on a list of needed projects. Then we could see what the actual costs were and vote on an appropriate amount of money.
Show Me the Costs and Benefits
In marketing, you always try to create a perception of value against which you sell. It appears Garcia, Ellis and Hidalgo have decided to bypass that step when selling this bond proposal.
I personally don’t plan to vote FOR another bond until I start seeing some benefit from the last two. Especially when there’s no guarantee how, where, or on what the money will be spent.
The cost of this political drama could average $1000 just in principle – PLUS interest – for every homeowner in Harris County.
That’s the high price of admission to political theater.
Before I shell out that kind of money, I at least want to know what the play is about. Let’s slow this down and figure that out.
Posted by Bob Rehak on 8/7/22
1804 Days since Hurricane Harvey
https://i0.wp.com/reduceflooding.com/wp-content/uploads/2020/11/Garcia.jpg?fit=764%2C586&ssl=1586764adminadmin2022-08-07 18:56:322022-08-11 15:33:47The High Price of Admission for Political Theater
A popular misperception says Halls Bayou has received no flood-mitigation funding. Yet it has received $175 million since 2000. $65 million of that happened since Harvey.
Channel widening, stormwater-detention basins and neighborhood drainage improvements have reduced flood risk somewhat, but several factors – including the need for more funding – make mitigation difficult. HCFCD has many projects still seeking federal assistance.
The Bond Program approved by voters in 2018 includes more than $110 million for the Halls Bayou watershed. That money could help attract another $236 million in federal matching grants for a total of $346 million. But many projects have yet to receive grants and start construction.
Halls cuts diagonally across the northern part of Harris County between Beltway 8 and Loop 610 North. It joins Greens Bayou before the Ship Channel.
From HCFCD.org on 7/24/2022.Halls, a tributary of Greens Bayou, is the darker shaded area.
Background: Halls Ahead
Halls received an extraordinary amount of damage during Tropical Storm Allison in 2001. Among all 23 Harris County watersheds, it ranked second only behind Greens Bayou during that storm. But Greens has four times the area and three times the population. (Greens had 15,590 damaged structures; Halls had 12,820.)
As a result, HCFCD launched many studies of Halls drainage after Allison. They culminated in the 2013 Halls Ahead Plan. But HCFCD lacked money to fully implement it and still does. All unfunded Halls Ahead projects carried forward into the 2018 Bond Program and many were able to start as you will see in the pictures below. Several have even finished. However…
A Phasing Study designated 58 flood risk reduction projects in 12 phases, with estimated costs between $100 million and $150 million per phase.
Flood Control executives recently traveled to Washington to plead for more help from the Army Corps of Engineers. The Corps now has a pilot program to help economically disadvantaged areas and Halls certainly qualifies. Halls has the highest percentage of vulnerable, Low-to-Moderate Income (LMI) residents of any watershed in Harris County (71%).
Complicating Factors
Blocked roadside ditches trap floodwater in neighborhoods. City of Houston and Harris County Precincts are responsible for roadside ditches, not HCFCD.
Halls is plagued by a combination of factors that make flood mitigation difficult:
Silted-in roadside ditches
Aging stormwater infrastructure
Developments built to older standards
Homes frequently built at street level
Dense population that leaves little room for mitigation projects
Structures built in floodplains that have to be bought out before many mitigation can begin (see below).
Flood History in Halls Watershed
Much of the Halls Bayou watershed developed during or after the 1950s. Take this area immediately east of what became I-45. It was farmland before then.
Google Earth image from 1953.Same area in 1978.Floodplains today. Cross hatched = Floodway. Aqua = 100-year floodplain. Brown = 500-year.Based on data developed after Allison. Floodplains will expand even farther after new updates.
Homes and businesses built in Halls Bayou floodplains created the flood risk. They also make widening channels or building detention basins difficult because of time-consuming, expensive buyouts.
Vital Stats
These statistics help put Halls Bayou flood problems in perspective. Here’s how Halls ranks among 23 Harris County watersheds on:
Watershed size – #16 (42.3 square miles)
Population – #10 (152,358 in 2020 census, down 5% from 2010)
Population density – #6 (3,602 people/square mile)
Dollars per capitain flood mitigation spending – #5 ($1151 per resident)
Dollars per square mile – #4 ($3.9 million dollars per square mile between 2000 and the end of last year).
Damaged structures – #4 (25,691 structures during five major storms since 2000 [Allison, Tax Day, Memorial Day, Harvey and Imelda])
Damage per square mile – #1 (607.4 structures/sq. mi.)
That last point makes recovery difficult for communities, especially less affluent ones. It may help explain the decrease in population.
Allison, Harvey Dramatize Need for Mitigation
HCFCD has documented flooding along Halls 14 times since 1989. But the two worst storms were Allison (2001) and Harvey (2017). Allison damaged 12,820 structures in the watershed. But Harvey damaged fewer – 11,831.
It’s fairly safe to say that without many mitigation improvements made prior to Harvey, Harvey damage would have been worse. However, rainfall distribution patterns make comparisons between the storms difficult.
The following table from HCFCD’s final Harvey report compares rainfall associated with severe, recent storms for various time periods. Tropical Storm Allison exceeds Harvey’s rainfall in the 6, 12 and 24-hr periods. But in the 2-day period, Harvey produced 6.0 inches more than Allison and 8.9 inches more over 4 days.
Photos of Stormwater Detention Projects from 7/19/22 Flyover
Last Tuesday, I flew most of the length of Halls Bayou with two fellow members of the Harris County Community Flood Resilience Task Force, Ken Williams and Bill Callegari. Let’s take a look at several Halls projects already completed or under construction – starting upstream and working east.
Helms Street Basins
East Helms runs between these two small basins just south of Aldine Mail Route Road. HCFCD completed these last year. They hold 119 acre-feet. That’s a little less than 3″ of stormwater falling over a square mile.
The basin will hold 180 acre-feet of stormwater. That’s about 3.5 inches of rain falling across a square mile. It will be a wet-bottom basin with a vegetated shelf.
Looking S at new detention basin. Between Halls Bayou at far end and Isom Street in foreground. Aldine Mail Route Road is under the camera position.
This basin is part of a larger mitigation project that will also extend and enlarge a channel north to the Western Homes subdivision along Aldine Mail Route Road.
Keith Weiss Park
One of the hidden gems of Houston is Keith Weiss Park east of Aldine-Westfield Road. The area is really a series of large connected detention basins disguised as a nature park with hike and bike trails, soccer fields, piers and boardwalks. City of Houston owns the park.
The Keith Weiss project removed 1,770,000 cubic yards of soil to create detention basins that hold approximately 963 acre feet of stormwater storage. That’s enough to hold a foot of stormwater falling across 1.5 square miles.
Google Earth shows that excavation started around 2006 and was substantially completed by 2010.
Wide shot looking east from over Aldine-Westfield Road. Halls Bayou flows away from camera.See close-ups of the three detention ponds below.Western-most basin. Halls Bayou in bottom center.Center pond. Still looking east toward US 59.Eastern-most pond.
Channel Improvements
HCFCD is making channel improvements along Halls in many locations. See project C-41. The area below lies between Keith Weiss Park and US59.
Looking SE along Halls toward US59. According to the HCFCD website, channel conveyance improvements and an additional detention basin are still in preliminary engineering.
Bretshire Stormwater Detention Basin
The Bretshire Stormwater Detention Basin on Halls Bayou added approximately 635 acre feet of additional stormwater storage upstream of Jensen Drive at US 59. It holds a foot of stormwater falling across one square mile.
Looking East across Bretshire Stormwater Detention Basin toward US59. The Fiesta store is by 59, left of center. Downtown is out of frame to the right.
HCFCD also had to buy out a large part of a subdivision to build the Hall Park basin on the opposite side of US 59. Flood Control substantially completed this project in 2018.
Looking NE across US 59 toward the Hall Park basin and Halls Bayou.
Hall Park holds 835 acre-feet. That’s enough to hold a foot of water falling across 1.3 square miles.
This project involved relocating a City of Houston sanitary sewer line and removing approximately 1.2 million cubic yards of soil.
This project required many buyouts that took almost a decade to complete.Roads shown inside the basin have been removed.
As part of its Bayou Greenways 2020 project, the nonprofit Houston Parks Board is designing and constructing the Halls Bayou Greenway – which includes a hike and bike trail, landscaping and neighborhood connections – along the southern edge of the stormwater detention basin. The full Halls Bayou Greenway will provide nine miles of publicly accessible open space from Brock Park to Keith Wiess Park.
In many cases, such stormwater detention basins are disguised as parks. So, many people don’t even recognize them as basins.
Hopper and Little York Basins
Slightly east of 59 at Hopper and Little York, HCFCD constructed two smaller basins in 2021 along a tributary of Halls. Together they hold approximately 200 acre feet. That’s about a foot of rain falling over a third of a square mile. Or four inches across a whole square mile.
Looking west toward 59 at Hopper Basin. Halls tributary cuts diagonally through pond in foreground.Looking S along the same tributary (in shade at left) at Little York basin. Little York runs along the bottom of the frame.
Such projects hold water back during storms until it can be slowly and safely released later when water in the bayou has receded.
Holding Back A Foot of Rain Falling Across Almost 5 Square Miles
Altogether, the detention basins in this post will hold almost a foot of stormwater falling across 5-square miles.
https://i0.wp.com/reduceflooding.com/wp-content/uploads/2022/07/20220719-RJR_9716.jpg?fit=1200%2C800&ssl=18001200adminadmin2022-07-24 08:23:182022-07-24 21:02:55Halls Bayou Has Come a Long Way, But Still Has Long Way to Go
When Harris County Flood Control District (HCFCD) and the Army Corps began Project Hunting (the Hunting Bayou Federal Flood Risk Management Project) in 2014, they estimated it would cost $100 million and take until late this year.
A flyover of the construction along Hunting Bayou looks like it is nearing completion…right on schedule. It will soon be done, except for the backslapping. Compare the shots below to those I took last year.
Hunting Bayou runs just inside North Loop 610 most of the way from US59 to Wayside. However, starting at Wayside, it dips outside the Loop, then goes back inside again, and finally outside a second time. Eventually, the Bayou works its way to the Houston Ship Channel near the City of Galena Park.
Scope of Project
Project elements include:
Excavating a stormwater detention basin on a 75-acre site near the northeast corner of Homestead Road and Loop 610
Widening and deepening about 4 miles of Hunting Bayou
9 bridge replacements / 8 modifications and channel conveyance improvements under bridges
Project Benefits
HCFCD says that most neighborhoods near the bayou will see water surface elevation reductions of 3-4 feet for the 1 percent annual chance (100-year) flooding event. The number of homes and businesses subject to the 1 percent (100-year) flooding event would drop from 5,100 to 650. And all homes and businesses will benefit from the reduced frequency and depth of flooding.
Need for Project
The Hunting Bayou watershed has Harris County’s second highest percentage of Low-to-Moderate Income (LMI) residents – 69%. That means more than two out of every three people earn less than the average income for the region.
Hunting is a small watershed. It comprises only 31 square miles. Its size ranks 19th out of 23 watersheds in the county.
Population grew only by 2,323 residents between 2010 and 2020. It went from 75,908 to 78,231. That now ranks it 14th in population among all watersheds, and 8th highest in people per square mile.
In five major storms between 2000 and today (Allison, Tax Day, Memorial Day, Harvey and Imelda), floods damaged 15,763 structures in the watershed. But virtually all of that damage came from Allison (8,270) and Harvey (7,419). The other three storms combined damaged only 74 structures, according to statistics compiled from HCFCD Federal Reports.
Thus, Hunting ranked 7th in total damage out of 23 watersheds, but because of its small size and high density, it had 508.5 structures per square mile damaged by floods since 2000. That means…
Hunting ranked #2 out of 23 watersheds in damage per square mile.
Data Obtained from HCFCD Via foia request
The watershed is highly urbanized with a mixture of residential, commercial and industrial developments. It’s home to one of the largest rail yards in the Houston area.
Union Pacific Englewood Yard in NE Houston along Liberty Road (right). HCFCD had to replace three railroad bridges over Hunting Bayou as part of the project.
Aerial Survey Shows Mitigation Construction Almost Complete
On Tuesday this week, I flew over Hunting Bayou with Ken Williams and Bill Callegari. Both are fellow members of the Harris County Community Flood Resilience Task Force. The pictures below show highlights of the construction.
Looking west at Hunting Bayou while hovering over US59 North. The widening of Hunting stretches downstream for about 4 miles to where Loop 610 North (on the left) turns right and heads south.Same area. Looking SW toward 59 and downtown. Notice the rip rap (irregular chunks of broken concrete or rock) below storm sewer outlets. It disperses the force of rushing water and slows it down to reduce erosion.Work continues around two neighborhood bridges at Falls St. and Leffingwell St.Likewise, widening continues at Hirsch Road.Looking back upstream at all three bridges, plus a pedestrian bridge over a small tributary in the distance.Wider shot, looking upstream over Wayne Street.Previously finished section around Wipprecht bridge.Note how bayou narrows under Lockwood Bridge due to commercial development on either side.Looking back upstream (west) from over Kelly St. at linear park that parallels another large detention basin.Note the new pedestrian bridges.They have been widened to accommodate the wider bayou.Rotating 180 degrees from shot above, we can see downstream to rest of park and where the Bayou threads its way under Loop 610N. Also note large detention basin in distance.Looking back SW from over Kelley Street. Note concrete lining that now protects narrow section under 610 bridge.Looking SW toward Homestead Road (with the bridge) across the new 75 acre stormwater detention basin.
The Curtis M. Graves Detention Basin shown above provides approximately 1,000 acre-feet of stormwater storage capacity. That’s almost 10 inches of rain falling over a square mile. Construction of the basin began in 2020.
Looking west along 610 N at the section of Hunting that briefly dips outside of the Loop.Looking NW. Note again the new concrete lining where the channel narrows to go under the Loop 610 N bridge. Water flows toward the camera.
Compare Bayou Downstream From Project
Where the bayou narrows to go under a bridge, the increased water pressure during a flood can cause a “jetting” phenomenon that rapidly erodes banks and undermines bridge supports. Hence, the need for concrete reinforcement.
Looking S along East Loop 610 beyond the eastern end of the project. The Bayou loops around storage tanks (lower right) and heads south toward Wallisville Road, before heading east again. This shows what the bayou looked like before widening.Compare width to previous shots.
The tank farm is the approximate eastern limit of Project Hunting.
Project History
This project began on December 16, 2014, long before Harris County’s Flood Bond in 2018. It was a key project of County Commissioner El Franco Lee (who lived in the area) and Congressman Gene Green. Despite a low benefit/cost ratio, they called in favors and got the project started.
The agreement between the Army Corps and HCFCD lets HCFCD qualify for reimbursement from the Federal government for work completed.
Between the channel widening and detention basin, HCFCD has removed almost a million cubic yards of soil to create more room for floodwaters. Width of the Bayou now varies from about 30 to more than 500 feet between the project limits.
According to data obtained via a FOIA Request, HCFCD and its partners spent $96 million on Hunting Bayou between 2000 and the end of last year. Some of that money has been spent on other projects. To see a complete list of HCFCD projects in Hunting Bayou, visit the District’s Hunting page.
In the last few weeks, Michael Bloom, a fellow member of the Harris County Community Flood Resilience Task Force, and I have debated the inherent bias and limitations of a Flood-Mitigation Benefit Index (FMBI) proposed by a majority of the Task Force to Harris County Commissioners Court.
According to Mr. Bloom, the index will:
Reveal and document patterns of historical discrimination.
Help plan where additional flood-risk reduction investments should be made.
Population-Based, Not Damage-Based Mitigation
The formula is:
Benefit = Total Cost/(Population X Risk)
…where:
Cost = total flood-mitigation construction spending (and only construction spending) that benefits a census tract.
Population = the number of people who live in census tracts.
Risk = the annual chance of flooding (applied to census tract(s)) expressed as a whole number. For instance, a 1% annual chance equals 1. And a 10% annual chance equals 10, etc.
The Task Force hopes to calculate and compare the results for each census tract in the county.
The formula measures the historical per capita flood-mitigation costs supposedly associated with the “current” level of risk in a census tract – NOT historical flood damage.
According to proponents, “a high benefit score means no more mitigation spending is needed. And a low score means more spending is needed.”
But consider these two examples:
4,000 people live with a 1% annual chance of flooding and have received $200 in prior investment. Their FMBI would be 0.05. That’s extremely low. And scores that low indicate such areas need help “regardless of prior investment.”
8000 people live in the 10-year flood plain and have received $10 million in prior investment. Their FMBI equals 125. That’s 2,500 times higher.
According to a spokesperson for the FMBI, “A high FMBI means we don’t need to make more investments in that location.” Yet twice as many people live with ten times the risk in the area with the higher index.
So, who deserves the most help? Residents with the lowest FMBI? The formulaSAYS they need help the most. But they actually have the lowest risk.
The Value of Market Testing
None of the hypothetical examples used to “sell” the formula hint at the possibility of such an upside-down result.
The example above proves several things:
The formula can produce inconsistent and misleading results.
Adjusting for population doesn’t prove historical discrimination. The most densely populated area has 50,000 times more investment.
The formula needs rigorous testing and ground-truthing before going any further. This is a best practice for any new scientific formula – especially one intended to guide future investment.
In addition to producing unintended results, the formula has several other problems that require discussion.
No Right-Of-Way Acquisition Costs Included
The FMBI formula includes only construction costs. It excludes right-of-way acquisition costs by assuming that they are “uniform throughout the county.” Therefore, “…costs included or excluded will not adversely impact results.”
In fact, Right-of-Way (ROW) Acquisition costs are huge and NOT UNIFORM throughout the county. I have documented that ROW costs typically comprise the second most expensive part of flood-control projects.
All Flood Control and partner spending on all capital improvement projects from 1/1/2000 through the end of Q3 2021.Data obtained via FOIA Request from HCFCD.
A quick glance at the Appraisal District website will tell you that land costs vary widely throughout Harris County and change over time.
The cost of buying floodplain land or wetlands for preservation in rural parts of Harris County pales in comparison to land acquisition costs in densely populated parts of the county.
In fact, acquiring land in densely populated areas for flood mitigation often costs more than construction, according to several engineers I consulted.
Compounding Problems?
I worry that other methodological issues may compound each other, not cancel each other out.
Map of Census tracts in Harris County, Texas.
Consider that:
Census tract population typically varies by up to 4X (2,000 to 8,000), according to the Census Bureau. This will produce deceptive spatial comparisons.
Some Census tracts may comprise dozens of square miles while others comprise a few city blocks. Typically, flood mitigation projects are not considered at the Census-tract level. According to three engineers I consulted, that’s too small in most cases to be workable.
Larger Census tracts may contain multiple watersheds, each with independent levels of risk – or individual watersheds with varying levels of risk. In such cases, the formula would average risk. But averaging can mask a serious problem in one area with a non-problem in another. Thus, the formula has a bias in favor of spatially smaller Census tracts. Smaller tracts tend to be more uniform in risk, so problems will likely stand out rather than get lost in an average. But in larger watersheds, flood risk will feather out with increased elevation and distance from a river. That will make it extremely difficult to calculate the number of people exposed to varying degrees of risk. Averaging takes the simple way out. But averaging risk is like comparing saints and sinners, then declaring “No problem.”
The data collection effort for the index omitsmany sources of funding. So the formula will calculate investment dollars from some entities and areas, but not others. For instance, the formula will NOT measure drainage funding from Harris County Commissioner Precincts, dozens of cities, and 389 municipal utility districts in unincorporated areas. The difficulty of data collection in these areas will produce another spatial bias. Likewise, the FMBI formula will omit the considerable drainage-improvement contributions of reputable private developers.
No one has tested how these inconsistencies will affect each other. But there’s an even bigger data integrity issue.
Partially Updated Data
HCFCD and its partners invested more than $1.5 billion in flood mitigation between Harvey and the end of 2021. Since 2000, they’ve invested more than $3.5 billion. But as of this writing, new MAAPnext flood maps only reflect the POST-mitigation risk associated with projects in FIVE bayous: Brays, Greens, White Oak, Sims, and Hunting. The Army Corps partnered with HCFCD in those.
Unfortunately, according to a knowledgeable source, HCFCD has not yet updated the risk maps for its own Capital Improvement Projects in other watersheds. So if you ran the allocation formula now, it would compare PRE-mitigation risk in 18 watersheds with POST-mitigation risk in 5.
Mitigation in those five watersheds totals $439 million out of $1.5 billion since Harvey. So true, current risk is reflected in only 29% of spending since Harvey and 13% in this century. Those percentages will no doubt increase in the future. But if you ran the numbers today, you would compare numbers with PRE- and POST-mitigation risk.
And consider this. With HCFCD spending at the current rate of about $80 million per quarter, “current risk” is a constantly changing target. So we’ll never be able to compare apples to apples in all watersheds anytime soon.
And we want to use this formula to guide future mitigation spending? Using it could send more money back to fix areas we already fixed!
Difficulty of Assigning Investments to Census Tracts
Another challenge: How do you determine which census tract(s) to apportion project benefits among? Example: Addicks and Barker Reservoirs. The Army Corps developed those back in the 1930s to protect downtown Houston…15-20 miles away!
Do you credit the investment to:
All of downtown?
People living inside the reservoirs (who have their own census tract)?
The current population of the entire Addicks and Barker Watersheds?
All census tracts along Buffalo Bayou and parts of White Oak Bayou, our second and third most populous watersheds?
And virtually all residents of the Addicks and Barker watersheds live upstream from the Corps’ investment, so they will not benefit from the investment either.
Downtown has immense commercial and economic value but relatively few permanent residents.
So, who gets the benefit? Again, lots of room for interpretation and misplaced assumptions here that numbers can easily mask! Now, multiply this problem times thousands of Census tracts.
Anti-Commercial Bias
The population-based FMBI has a built-in bias against commercial areas that have little to no residential population. For example, consider the cases of Downtown, the Texas Medical Center, and the Port of Houston. Such areas support employment throughout the region, but the formula discriminates against them by giving huge weight to population and omitting actual damage.
No Thresholds Defined
To my knowledge, the task force has never discussed threshhold “benefit” levels that correlate to “needs help” or “doesn’t need help.” The extremes may sometimes be easy to determine. But what about outcomes in the middle?
Offsetting Variables
Variables in the formula can offset each other as we saw above. In tight races for funding, who gets the next flood-mitigation investment? The area with the lowest investment, highest risk, or largest population? Such quandaries have not yet been addressed.
No Agreement on Weights of Other Factors
To help make future flood-mitigation decisions, proponents of the formula also suggest weighing (separately) other factors, such as the CDC’s Social Vulnerability Index. It includes the percentage of Low-to-Moderate residents in an area. However, no one has yet discussed the weight given the Benefit Index relative to other factors.
No Consideration of Actual Flood Damage
In deciding where to put flood mitigation projects, engineers traditionally look for damage clusters. It’s that simple. Dollars flow to damage.
Reducing flood damage is a tried and true, measurable way to evaluate projects. So why all the complexity?
What’s The Point?
What is this formula trying to prove? Is it attempting to develop a new approach to mitigation funding that eliminates a perceived bias in Benefit/Cost Ratios?
Commissioner Rodney Ellis often talks about how calculating the value of avoided damages in higher value homes disadvantages projects in poorer neighborhoods. That can be true in some instances. Expensive homes can ratchet up benefits (measured in dollars) faster than lower value homes can. And that can result in higher Benefit/Cost Ratios for projects in affluent neighborhoods – assuming density is held constant. But…
One high-value home on an acre would likely appraise less than an apartment building, also on an acre. In Kingwood, I compared the valuations of an expensive single-family home with a large apartment complex one block away. The appraised cost per acre (including structures) of the apartment complex is 4X higher.
Now consider that apartments accommodate almost half of Harris County’s population.
According to the latest census data, 54.9% of Harris County residents live in owner-occupied homes. The rest, 45.1 percent, live in apartments.
Most Americans aspire to and encourage home ownership, in part, because of the stability it fosters in communities. But this formula – because of its emphasis on population density – favors apartment areas over areas with owner-occupied homes. There’s nothing inherently wrong with that. You just need to understand what the formula does.
Difference Between Vertical and Horizontal Density
The Benefit Index favors all areas with dense population. Proponents argue that helping more people is better. I don’t argue with that. However, the generalization masks the financial pain inflicted by a flood on owners vs. renters, and on the people who live at ground level compared to those who live above it.
Ground floor renters may lose contents in a flood, but they won’t be responsible for making structural repairs. The owner will.
And many living above the ground floor may find themselves more inconvenienced by flooding than financially devastated. So, is it fair to count all people on all floors when determining who suffers the most pain?
Five-story apartment buildings crowding Brays Bayou with ground-level parking underneath. HCFCD has no way of knowing how many people live in apartments like this, yet HCFCD will be responsible for compiling the data.
In the proposed formula, higher population will lower the benefit index, making it look as though all renters (almost half the county’s population) suffered more than owners of single-family homes.
The premise underlying such “equity” arguments is that poor people can least afford floods. But most people in apartments like those shown above won’t make structural repairs as a homeowner would.
No Perfect Formula
No perfect formula exists that’s equally fair to all in all circumstances. That’s why FEMA, HUD and the Army Corps allow consideration of multiple factors when determining which projects to fund.
The Flood Mitigation Benefit Index focuses totally on population, risk, and past investment. It ignores actual flood damage.
If we use ANY formula to HELP allocate future flood-mitigation funds, we should all strive to:
Understand its built-in biases
Maintain high standards for data integrity.
If we want to test a hypothesis of historical discrimination in flood-mitigation funding, there’s a much simpler way. It’s called direct measurement. Simply locate damage centers from past storms and compare funding in the following decade designed to mitigate those areas.
For More Information
For more background on issues with the formula, see my earlier posts:
https://i0.wp.com/reduceflooding.com/wp-content/uploads/2022/07/20210520-RJR_6978.jpg?fit=1200%2C800&ssl=18001200adminadmin2022-07-14 17:54:142022-07-14 21:58:06Inherent Bias and Limitations of Flood-Mitigation Benefit Index