On 4/13/23 at 8 A.M. sharp, Northpark Drive expansion started after 10 years of planning. Dignitaries gathered in the parking lot of a local business for the groundbreaking ceremony even as surveyors were already working father east and Harper Brothers Construction started prepositioning equipment.
This project will make Kingwood safer in the next big flood. It will also make the Livable Forest more livable by reducing traffic congestion.
Ceremonial Kickoff
Houston Mayor Sylvester Turner, Mayor Pro Tem Dave Martin, Council Member-at-Large Sally Alcorn, the board of the Lake Houston Area Redevelopment Authority, and Montgomery County Precinct 4 Commissioner Matt Gray all grabbed shovels for the ceremonial kickoff.
Gray will coordinate with the City on this project. Even though it is within the City, Phase One falls entirely in Montgomery County.
Martin acted as master of ceremonies and reminded everyone of the work the late TIRZ Chairman Stan Sarman did to keep this project moving through the years.
How Project Began
Martin called this the first major infrastructure project in Kingwood since the West Lake Houston Parkway Bridge was built between 1990 and 1992. He also provided a brief history of the project. More than a decade ago, the City considered expanding Kingwood Drive.
Traffic studies showed that Kingwood Drive ranked as the most congested thoroughfare in the City and was among the most dangerous. However, the community’s desire to preserve the trees along Kingwood Drive – one of the signature attractions of the community – put that project on indefinite hold.
The City then began looking at Northpark Drive as an alternative. It was ranked the fifth most congested thoroughfare in the City and also one of the most dangerous.
Benefits of Project
Martin emphasized the benefits of the project during emergencies, such as Hurricane Harvey, which virtually turned Kingwood into an island. He also talked about the increasing length of trains and how they could block Kingwood Drive, Northpark and Ford Road simultaneously.
Martin said that the Northpark Drive expansion will provide a bridge over the railroad tracks and Loop 494 that lets citizens, firetrucks and ambulances enter and exit Kingwood 24/7/365 without delay. The City will also raise Northpark in places that frequently flood, i.e., at the diversion ditch and over Bens Branch.
Culverts will replace the ditch now down the center of Northpark Drive so the thoroughfare can expand to six lanes.
Mayor Pro Tem Dave Martin
The first phase of the project from 59 to the Kingwood Diversion Ditch should take about two years to complete. Traffic frequently backs up most of this distance, especially when trains pass through the area.
Pictures of Groundbreaking
Below are pictures that show today’s ceremony and scope of the project.
Martin (left) and Turner (right) kicked off the ceremony by talking about the need for the project and thanking all those present for their support.Houston Mayor Sylvester Turner, who has only eight and a half months left in office, drew a laugh from the crowd when he quipped that residents could complain to someone else about traffic delays during construction.First shovels in a two year project. Gray, Martin and Turner are fourth, fifth and sixth from left respectively.Traffic backed up in backgroundunderscores need for project.Looking SW.Drone shot taken as event (bottom middle) was breaking up also shows where bridge will go over UP railroad tracks and Loop 494 in upper right.Looking west. Another drone shot taken on previous afternoon at 3PM shows inbound traffic backed up all the way to 59 in background .Looking east toward Kingwood. First phase of project will go to end of ditch at top of frame.
Construction always entails some pain. But the benefits will far outweigh any inconvenience. I can’t wait to be one of the first to drive over the bridge that will alleviate the perpetual congestion at the intersection above.
Currently in Austin, there are five pieces of pending legislation that could reduce flooding in the Lake Houston Area, Harris County and the entire region. Here’s a rundown on each.
The net impact could be a fairer distribution of funds to the areas hardest hit by flooding and a regional focus that reduces flooding for all, not just those in Democratic precincts.
Of the 18 active capital improvement construction projects currently underway by HCFCD, not one is in the last remaining precinct led by a Republican commissioners in Harris County. See below.
The yellow precinct on the west side of the county (P4) used to be Republican-led until this January. It has only one capital improvement construction project.
The other 17 active capital improvement construction projects are split between the two precincts led by Democratic Commissioners Rodney Ellis and Adrian Garcia.
HB1093
After Harvey, both the East and West Forks of the San Jacinto River became clogged with sand. Sand mines along the banks of rivers were large contributors.
House Bill 1093 would ensure that when sand mines are played out, the operators have enough financial reserves to clean up the property and replant vegetation before walking away.
Some miners simply abandon property, leaving rusting dredges, excavators, bulldozers, processing equipment, and more to litter the landscape. Likewise, they are supposed to regrade property to eliminate stockpiles that could be swept away in floods. And they are supposed to replant vegetation that could reduce the rates of erosion. But not all do.
HB1093 would force miners to provide financial surety that guarantees cleanup won’t fall on the shoulders of taxpayers. Surety is a common practice in the construction trades. Think of it as a form of insurance. If the miner can’t afford reclamation, the surety company is on the hook, not ordinary citizens.
Without this bill, some irresponsible miners will continue littering the shores of our rivers – the rivers that provide drinking water to 2 million people.
Dredge left at abandoned West Fork sand mine on North Houston Avenue in Humble.
HB5341
House Bill 5341 would create a Lake Houston Dredging and Maintenance District. Its purpose would be to remove sediment, debris, sand, and gravel from Lake Houston and its tributaries to restore, maintain, and expand the Lake to mitigate storm flows.
The District would have a board appointed by Harris County Commissioners, the Houston City Council, the Houston Mayor and the Harris County Judge.
The District would remove debris under and on the water of Lake Houston and its tributaries, but would be prohibited from doing so in such a way that it would impact water quality or water treatment costs. Dredgers would have to obtain approval from Houston Public Works before conducting any operations.
They could take sand and gravel from Lake Houston and its tributaries without paying a fee or tax.
Before beginning operations, the District would also conduct a funding study. Presumably at a minimum, that would estimate how much money it could make by selling dirt removed from the lake. Such dirt could be used as fill to raise homes and roads.
The District would also have authority to issue revenue bonds and could receive up to $25 million per year for the next two years from the state during that start-up period. It could not impose any taxes or fees.
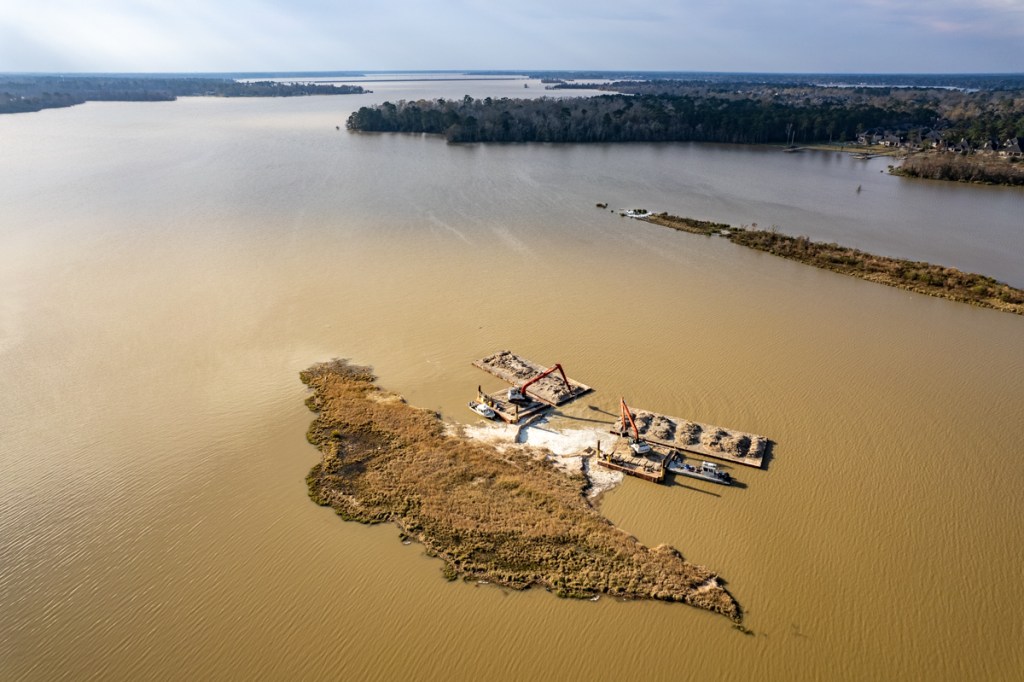
Removing part of the East Fork Mouth Bar during dredging operations in 2022.
SB1366
Senate Bill 1366 redirects surplus revenue from the economic stabilization fund to the Flood Infrastructure Fund. The State’s Flood Infrastructure Fund (FIF) has turned into one of the main sources of funding for Texas Water Development Board grants and one of the main ways that smaller counties and cities can fund flood projects.
Because both revenue estimates and budgets are still in flux, it’s unclear at this point exactly how much would be transferred, according to Senator Brandon Creighton’s office. Creighton sponsored this bill.
Check back often for more about legislation that could reduce flooding.
Posted by Bob Rehak on 4/12/2023
2053 Days since Hurricane Harvey
The thoughts expressed in this post represent opinions on matters of public concern and safety. They are protected by the First Amendment of the US Constitution and the Anti-SLAPP Statute of the Great State of Texas.
https://i0.wp.com/reduceflooding.com/wp-content/uploads/2022/01/20210817-DJI_0349.jpg?fit=1200%2C799&ssl=17991200adminadmin2023-04-12 12:55:222023-04-13 18:51:08Five Pieces of Legislation That Could Reduce Flooding
Two days ago, I wrote about San Jacinto East Fork Flooding at FM2090 in Plum Grove. Yesterday, floodwaters were peaking downstream at FM1485/SH99. No homes were threatened that I saw, but at least one vehicle stalled and was abandoned.
Pictures Taken on 4/10/23 Just After Peak
See the pictures below that I took Monday afternoon when the river was at 63 feet.
Looking west along SH99 at the San Jacinto East Fork where FM1485 parallels the Grand Parkway.
Note the difference in the width of the spans in these bridges. The newer bridge is at least 5X wider. Because water flows right to left, this creates a bottleneck that causes the roads in this area to go underwater frequently. TxDoT probably needs to widen the 1485 bridge or elevate the roadway or both.
Looking east. Upstream (left) of the 1485 bridge, the East Fork remained placid. But downstream, you can actually see the currents in the rushing water.Looking east from over eastbound FM1485 as vehicles attempted to plough through water. Note the black car stalled at the side of the road farther up. That one didn’t make it.Looking west at same location. Despite the dangers, vehicles persisted through the water. There was no room for them to turn around.
As of this writing (noon on 4/11/23), SJRA has scaled back its releases from Lake Conroe to about 1000 cubic feet per second (CFS).
Caution to Swimmers and Waders
Swimming or wading in floodwater can endanger your life. A cubic foot of freshwater weighs about 62 pounds. Rapidly moving water that rises above knee level has enough force to easily knock adults over and sweep them downstream.
The East Fork at FM1485 is still moving at more than 4000 CFS!
So swimmers and waders beware. This morning a reader wrote me about a woman and her daughter who were killed in the East Fork after Harvey. The woman could not battle the current. Her daughter tried to save her and both died.
Understand also that floodwaters can easily scour the riverbed to create drop-offs in unexpected places. Even if you could safely wade in areas before the flood, after the flood, you could easily step into holes over your head.
If you find yourself swept up in a strong current, don’t try to swim against it. Swim perpendicular to it or with it to reach shore.
Bills proposed in both the Texas House and Senate could transform the Harris County Flood Control District (HCFCD) into the Gulf Coast Resiliency District (GCRD). The proposed legislation would make the management of the GCRD a board appointed by the Governor instead of Harris County Commissioners Court.
Senator Paul Bettencourt introduced SB2431 and Representative Dennis Paul introduced its companion bill, HB5338, in the House. Both go back to the enabling legislation for HCFCD in 1937 and change the original language in key places. For example:
“Gulf Coast Resiliency” replaces “Harris County Flood Control.”
“The bounds of the district” replaces “Harris County.”
“The Board” replaces “Commissioners Court.”
“Presiding officer” replaces “County Judge.”
Check out the bill language yourself by clicking on the links above. Virtually all HCFCD capabilities and functions remain the same. GCRD can issue bonds, build projects, partner with other entities, and acquire property as it always has.
The big change: the governor-appointed board would manage GCRD instead of Harris County Commissioners.
Why These Bills Would Benefit Harris County
While local control is normally a good thing, excessive political interference can also hinder professionals in the performance of their duties. And in fact, that has happened in Harris County. Below, I discuss eight distinct performance-sapping issues I have observed under the current administration.
1. Limited Purview of Some Harris County Commissioners
Language in both the 1937 enabling legislation for HCFCD and the 2018 flood bond let HCFCD acquire land and build projects in neighboring counties. This is necessary because floodwaters do not respect political boundaries. We need a regional approach to solve watershed-wide problems.
However, Commissioner Rodney Ellis has blocked virtually all such efforts and his Democratic colleagues have gone along with him.
Ellis rarely misses an opportunity to express his regret over letting HCFCD purchase the Woodridge Village property on the Montgomery County line. It contributed to flooding up to 600 homes in Kingwood/Harris County twice in 2019. Since acquiring the property in 2021, the county has spent less than $1,000 to build a flood-mitigation project on it.
Meanwhile, hundreds of millions of dollars have gone to projects inside the Beltway where most of Ellis’, Garcia’s and Hidalgo’s constituents live.
2. Undermining Regional Cooperation
Ellis’ stonewalling of projects across county lines also cut the legs out from under an HCFCD/Engineering Department program called Fix Flooding First.
The program proposed five “minimum drainage standards” for adjoining counties draining into Harris County. The only inducement Harris County could offer neighboring areas to cooperate was flood-bond money for partnership projects.
Democrats Ellis, Garcia, and Hidalgo have consistently steered 2018 flood-bond money away from areas on the periphery of the county. This has punished political opponents.
For instance, not one capital-improvement construction project is currently underway anywhere in Precinct 3. P3 is the last remaining precinct led by a Republican in Harris County.
Having spent billions of dollars since 2000 to mitigate flood risk in Low-to-Moderate-Income areas, Harris County’s Democratic majority now seeks to de-emphasize flood risk in its funding formula.
They have also eliminated common-sense metrics such as flood damage, deaths, depth of flooding, and protection of infrastructure such as schools and hospitals when scoring projects.
Using this system, projects in areas with 50-year flooding could get funded before those with 2-year flooding. But that seems to be the way the Democratic majority wants it.
5. Exhausting Local Dollars to Avoid Waiting on Federal Dollars
Roughly $2.5 billion – half the money for 2018 Flood Bond Projects – originated locally. And about a third of that was designated to attract matching funds. For instance, the US Department of Housing and Urban Development often pays up to 90% of projects, but it requires a 10% local match.
This leverage could have doubled the funds available for Harris County flood-mitigation projects. But two catches existed:
HUD prioritizes projects in low-to-moderate-income areas.
HUD money takes longer to work its way down from Washington to Austin to Harris County.
Instead of waiting on HUD, Democrats started using local money in LMI neighborhoods. Now there may not be enough money to cover projects in predominantly Republican neighborhoods like Kingwood, Spring, Cypress and Huffman.
6. Falloff in Partner Funding
When Commissioners voted to plow ahead with local dollars instead of waiting on Federal dollars, they said they would continue to seek partner funding wherever possible.
But almost two years after the GLO announced Harris County would get $750 million in funding, the County still hasn’t submitted a complete plan for how it would spend the money. In fact, it changed its plan twice in the last month.
Problems like these do not inspire partner confidence. And it shows.
Grants by month since approval of flood bond in August 2018. Data obtained via FOIA request from HCFCD.
7. Slowing Progress on Flood-Mitigation Projects
Political interference in HCFCD has led to 100% turnover in the executive ranks of HCFCD under County Judge Lina Hidalgo.
Data obtained from HCFCD via FOIA request.Decline coincides with departures of key executives.
The flood bond passed in the third quarter of 2018 when Russ Poppe, Matt Zeve and Alan Black led HCFCD.
Then in 2021, Poppe, the executive director, resigned after relentless backbiting in Commissioners Court over made-up equity issues. Zeve, the deputy executive director, resigned in January 2022 under similar circumstances. And Alan Black, operations manager (and later acting director), left later that year.
This slowed down HCFCD performance and placed the entire county at higher risk.
Preliminary data for the first quarter of 2023 indicate that spending could decline even more radically this year.
Commissioners had criticized the executives for not spending enough money in minority and low-income areas. In fact, HCFCD was already spending as much in eight watersheds with LMI-majority populations as they were in all 15 others combined. See below.
Spending compiled from HCFCD December 2022 Flood-Bond Update. HCFCD has released no additional updates since then.
Still unhappy, Democrats have had to think up new ways to send even more projects to their constituents inside the Beltway.
Hence, the constant revisions to the equity scoring matrix. According to several former employees, the revisions have led to starts, stops, wasted work, frustrations and delays. These contribute to slowdowns and keep flood risk high.
Benefits to Citizens
An article by Holly Hansen in the Texan quotes Rep. Paul on why he introduced the companion bill to Bettencourt’s in the House. He cites Harris County’s mismanagement, lack of progress, and the politicization of infrastructure planning.
Solving these problems will reduce flood risk, increase productivity, and save taxpayer dollars.
Those don’t seem important under the current leadership in Harris County. Can we afford to wait another four years for a change in administration?
Normally, I favor local control. The more, the better. But with HCFCD, that local control has failed us. That’s why I wholeheartedly support these bills.
If you agree, please consider showing your support. Email Senator Bettencourt and Representative Paul. The more they hear from people, the more motivated they will be to pass the bill.
Posted by Bob Rehak on April 10, 2023
2050 Days since Hurricane Harvey
The thoughts expressed in this post represent opinions on matters of public concern and safety. They are protected by the First Amendment of the US Constitution and the Anti-SLAPP Statute of the Great State of Texas.
https://i0.wp.com/reduceflooding.com/wp-content/uploads/2023/04/Screenshot-2023-04-08-at-7.17.12-PM.png?fit=1764%2C1058&ssl=110581764adminadmin2023-04-10 10:35:212023-04-10 10:58:25Lawmakers Propose Transforming HCFCD and Its Management
As floodwaters worked their way down the East and West Forks of the San Jacinto from last week’s heavy rains, they invaded sand mines on both rivers on Easter Sunday, 2023.
Up to 9 inches of rain fell in the headwaters of both rivers during 3 days from 4/5 to 4/7. Atlas-14 rainfall probability statistics indicate that equals a 5-year rain.
The Lake Conroe Dam intercepted much of the West Fork rain and is now releasing it at about 6400 cubic feet per second. There are no dams on the East Fork and the flooding there appears much worse.
West Fork Near Northpark South Development
Near the Northpark South Development on Sorters Road, the West Fork snakes its way through four square miles of sand mines. In the image below, the Hallett Mine on the right seemed secure. But the abandoned sand mines on the left and top center both opened to the river.
Photo taken 4/9/2023 two days after rain stopped.
East Fork Near FM2090 on 4/9/2023
Normally, the East Fork at 2090 is about 30-40 feet wide – the size of the opening in the woods circled in red below. But today, the river swelled to about 2000 feet wide.
Looking south from over East Fork San Jacinto toward FM2090.Looking East along FM2090 across the East Fork.
As the East Fork rose, it invaded the abandoned Texas Concrete Sand and Gravel Mine in Plum Grove.
Abandoned Texas Concrete Sand and Gravel Plum Grove Mine north of FM2090 between East Fork and FM1010
Water entered the northern end, swept through the mine, and punched through the dikes on the southern end, carrying silt and sand with it. See sequence of pictures below.
Looking N toward northern end of mine.Water entered mine in upper left and cut off house.Water then swept under and around house moving south.Looking S.The water then exited back into the river through several breaches in dikes.Rushing water carrying silt and sand found two more breaches close to 2090. Left unchecked, the force of this water will eventually erode the banks of FM2090.Baptist Church Loop Road south of FM2090 was also underwater.
Mine Fails to Meet Guidelines for Abandonment
This mine does not meet TCEQ guidelines for abandonment. The miners left equipment, including a dredge. They also failed to grade stockpiles, remove buildings, and plant grass. Yet somehow, the TCEQ gave them a pass.
This is the second time in less than two years that this mine has been inundated. The public will bear the cost of dredging all the sand carried downriver.
I guess the miners need the money more than you do.
Posted by Bob Rehak on 4/9/2023
2049 Days since Hurricane Harvey
The thoughts expressed in this post represent opinions on matters of public concern and safety. They are protected by the First Amendment of the US Constitution and the Anti-SLAPP Statute of the Great State of Texas.
https://i0.wp.com/reduceflooding.com/wp-content/uploads/2023/04/20230409-DJI_0542.jpg?fit=1200%2C799&ssl=17991200adminadmin2023-04-09 19:10:132023-04-10 17:15:03Swollen San Jacinto East and West Forks Sweep Through Sand Mines
While no flooding in the Lake Houston Area is predicted at this time, the East and West Forks of the San Jacinto are swelling because of 5-9 inches of upstream rainfall–mostly to the north and northwest. As that stormwater works its way downstream, residents should be prepared to take action.
Cumulative rainfall totals including last three days. Note band of heavy rainfall up to almost 9 inches that will funnel down into the East and West Forks of the San Jacinto.
Meteorologists warned us that rainfall totals for Wednesday through Friday could creep upwards of 8-inches where cells started to train. And that is exactly what happened.
Since Wednesday, 7-9 inches of rain fell across southeast Grimes County and western Montgomery County into central Walker County. This caused significant rises on the upper and middle Spring Creek tributaries in northern Waller and southeast Montgomery Counties and Lake Creek. Rises are also ongoing along the West/East Forks of the San Jacinto River (see below).
The threat for additional heavy rainfall will shift south and east today.
Overall the trend in the Lake Houston Area for this afternoon, tonight, and Saturday will be for slowly decreasing rain chances and amounts.
Mainly San Jacinto Watershed Impacted
Because of frequent breaks and manageable rates in the rain, most watersheds have responded well. Getting 8 inches in three days is not as bad as getting 8 inches in three hours…especially when the grounds were so dry.
However totals have eventually piled up across northern Waller, western Montgomery, and central Walker Counties impacting mainly the San Jacinto River watershed.
Spring Creek:
Rises are ongoing along Spring Creek and its tributaries such as Mill, Walnut and Threemile Creeks. They are all producing high flows into Spring Creek from northern Waller, SE Grimes, and SW Montgomery Counties. While Spring Creek will rise today with these inflows, no significant flooding is expected. The channel capacity of the main creek is much larger and should be able to handle incoming inflows.
West Fork of the San Jacinto River:
Inflows will be moving down Lake Creek which has recorded 7-9 inches of rainfall across the upper headwaters of the basin in western Montgomery County as well as local inflow below Lake Conroe Dam and ongoing minor releases from Lake Conroe (around 6,000 cfs this morning). The river is expected to rise to near 48.0 ft over the weekend as upstream run-off moves downstream. This is currently about 1 ft below flood stage at Humble (US 59).
Upstream run-off from Walker and San Jacinto Counites will move downstream toward New Caney (FM 1485) and Plum Grove over the next few days. The river is currently forecasted to rise above flood stage late this weekend and potentially approach moderate flood levels late Sunday into Monday.
The upstream rainfall could impact FM 1485 and low lying areas near the river downstream of the SH 99/FM 1485 bridge crossing.
Jeff Lindner, Harris County Meteorologist
Lake Conroe Report
Lake Conroe released water all day yesterday at more than 6000 cubic feet per second (CFS). Today, the rate has slowed slightly to just under 6000 CFS. The lake level is holding steady at 202.54 feet as of 4/7/23 at 10:40 AM. That’s about a foot and a half above its normal level.
The San Jacinto River Authority adopted a compromise lake lowering policy. In April, May, September and October, they are lowering Lake Conroe a half foot WHEN the City of Houston requests it. The releases are not as great, nor are they automatic as in previous years.
Lake Houston
Lake Houston opened all its floodgates on Tuesday and has released water steadily throughout this event. The lake level was at 41.7 feet at 9:30 AM. Normal is 42.4. So the precautions seem to have paid off. But a test still lies ahead.
Posted by Bob Rehak on 4/7/23
2047 Days since Hurricane Harvey
https://i0.wp.com/reduceflooding.com/wp-content/uploads/2023/04/Rainfall-April-copy.jpg?fit=1894%2C1230&ssl=112301894adminadmin2023-04-07 11:09:502023-04-07 12:05:28Heavy Upstream Rainfall Now Working Its Way Down
Today, Houston Mayor Pro Tem Dave Martin announced the groundbreaking for the Northpark Drive Overpass Project. Weather permitting, it will happen Thursday, April 13.
It took months to acquire right-of-way for the project. Northpark Drive will expand from four lanes to six. And it will include a bridge over Loop 494 and the Union Pacific Railroad Tracks.
The ceremonial groundbreaking will actually happen during the mobilization phase. In coming weeks, residents can expect to see the contractor pre-positioning equipment, supplies, and materials for construction.
Finally, an Elevated Evac Route over Railroad
The Northpark Drive Overpass Project will alleviate congestion, enhance accessibility, and increase safety in the Kingwood area. The 2015 Kingwood Area Mobility Study, commissioned by TIRZ 10, concluded this project is critical to ensuring public safety.
Local leaders have worried for years about evacuating Kingwood in the event of a natural disaster or chemical spill during a derailment, similar to those that have made headlines around the country lately.
The first phase of this project will go from I-69 to the Kingwood Diversion Ditch
Project extent map provided by City.
A second phase, not yet approved, will extend to Woodland Hills Drive and include elevated bridges over the Diversion Ditch and Bens Branch.
Improved drainage that meets new post-Harvey Atlas-14 requirements.
Wider pedestrian walkways.
Enhanced lighting and landscaping.
Elimination of center ditch.
TIRZ Meetings Open to Public
Safety Considerations during Construction
Once construction commences, please be aware of flagmen and orange traffic cones that will be put in place on-site to help with traffic flow through the construction zone as the project may require a one-lane closure. Two-way traffic will be maintained at all times. Businesses and residents will have access to driveways and sidewalks at all times and may experience an increase in noise levels due to trucks and equipment in the area.
For a detailed traffic plan during construction, residents can view the plans here (pages 43-163).
As a reminder, TIRZ Board meetings are open to the public and held on the second Thursday of each month at 8:00 a.m. Visit the LHRA website for more information on the Northpark Drive Overpass Project and view the 2023 Board of Directors Calendar.
Please contact the District E office by phone at (832) 393-3008 or by email at districte@houstontx.gov with any questions or comments.
Posted by Bob Rehak on 4/6/2023
2046 Days since Hurricane Harvey
https://i0.wp.com/reduceflooding.com/wp-content/uploads/2023/04/Screenshot-2023-04-06-at-4.35.38-PM.png?fit=1672%2C880&ssl=18801672adminadmin2023-04-06 17:30:132023-04-06 18:40:37Northpark Overpass Groundbreaking Announced
All week long, meteorologists have predicted heavy rains starting on Wednesday, 4/5/23, through Friday, 4/7/23. This morning, guidance from Harris County Meteorologist Jeff Lindner indicated that the rainfall could be even heavier than previously predicted. Instead of widespread 2-4 inches, Lindner now predicts widespread 3-6 inches. Last night, ABC13 predicted up to a foot of rain in isolated places, especially north and west of US59, i.e., the San Jacinto Watershed.
Three day totals predicted by the National Weather Service on 4/5/23
Lake Lowering Began at Noon
As a result, the City of Houston began lowering Lake Houston today at noon.
According to Mayor Pro Tem Dave Martin, Houston Public Works, Coastal Water Authority, and San Jacinto River Authority have worked together closely over the last 24 hours to monitor local forecasts. Based on this morning’s forecast within the San Jacinto Watershed, the City decided to open the floodgates on the Lake Houston Spillway Dam.
Property owners should make arrangements to secure boats and other items along the shoreline.
City of Houston
Houston Public Works will keep the flashboard and tainter gates open throughout the inclement weather and Coastal Water Authority will continue storm operations allowing the inflow to pass through Lake Houston until the weather threat concludes.
SJRA NOT Lowering Lake Conroe Level
SJRA has confirmed they will NOT lower Lake Conroe. This will maximize the City of Houston’s lake-lowering efforts.
Atmospheric Squeeze
An approaching low-pressure system from the northwest will stall when it encounters a high-pressure system over the Gulf.
The two fronts will funnel moisture from both the Pacific and Gulf between them. That’s because in the Northern Hemisphere, high-pressure systems rotate clockwise and low-pressure systems rotate counterclockwise. So atmospheric moisture will be squeezed between them along a steady line for days. Think of meshed gears.
Because of dry grounds, moisture that falls during the first day will likely soak in. But after that, runoff rates will increase.
The areas receiving the most rainfall will likely be north and west of Houston, because that’s where the frontal boundary will likely linger longest.
Flooding Outlook
Street flooding will be a concern through Friday.
Says Lindner, “Smaller creeks, rural watersheds, and San Jacinto River system will be the most vulnerable to higher run-off flows. While widespread creek and bayou flooding is currently not expected, some watersheds may experience significant rises and a few locations potentially to flood levels. Any sustained training of heavy rainfall over any certain watershed for an extended period of time could result in flooding. It will be important to monitor rainfall amounts and locations through the period for any significant watershed responses.
Watch the following watersheds closely: Willow Creek, Little Cypress Creek, Cypress Creek (and Waller County tributaries), Spring Creek (and Montgomery/Waller County tributaries), Bear Creek, South Mayde Creek, Cedar Bayou, East/West Forks of the San Jacinto River, Keegans Bayou, Clear Creek, Halls Bayou.
For Current Information 24/7
Bookmark these links to monitor weather and lake conditions, especially if you live in low-lying areas with a history of flooding:
Harris County Flood Control District’s Flood Warning System tracks rainfall and monitors water levels in bayous and major streams on a real-time basis: https://www.harriscountyfws.org/
https://i0.wp.com/reduceflooding.com/wp-content/uploads/2023/04/image001-1.png?fit=801%2C561&ssl=1561801adminadmin2023-04-05 12:09:312023-04-05 12:09:35Rainfall Predictions Increasing, City Lowering Lake Houston
In the four weeks since my last update, Harris County Flood Control District’s (HCFCD) contractor has excavated another 11,000 cubic yards of dirt from Woodridge Village. That means Sprint Sand and Clay has removed a total of 104,000 cubic yards since it started work under its Excavation and Removal Contract a little more than a year ago.
Sprint is removing the dirt from what will become a sixth stormwater detention basin on the former Perry Homes site. The lack of adequate detention capacity on the site contributed to flooding hundreds of homes in Kingwood twice back in 2019, before HCFCD purchased the property.
New Excavation Already Second Largest on Site
Already, at 62 acre feet, the new basin ranks as the second largest stormwater detention basin on the 268-acre site. Woodridge Village’s five original basins had the following capacities:
N1 = 13.2 acre feet
N2 = 154.7 acre feet
N3 = 42 acre feet
S1 = 18.6 acre feet
S2 = 42.5 acre feet
The new detention basin could more than double capacity on the site. Ultimately, it will exceed Atlas 14 requirements.
Here’s where the original five are located.
Locations and sizes of first five stormwater detention basins shown in blue.
The new basin will go between N2 and S1.
Location of new basin outlined in red.
Progress by the Numbers
The 11,000 cubic yards excavated in the last 28 days averages 2,750 cubic yards per week. That’s an increase of 220 cubic yards per week compared to the previous month. It’s also 1,000 cubic yards per week more than the weekly average since the start of the contract.
The current monthly rate more than doubles the minimum required under Sprint’s contract.
The excavation of 100,000 cubic yards marks yet another milestone. Sprint has now removed more than 20% of the 500,000 cubic yards allowed under the contract.
February vs. March Photos
To get a feeling for just how much 11,000 cubic yards is, compare these photos taken at the ends of February and March.
End of FebruaryEnd of March: excavation stretches much farther into the distance.
A Head Start on Construction
In December 2022, HCFCD revealed the results of its analysis of alternatives to reduce flooding adjacent to Woodridge and Taylor Gully. HCFCD is now working on finalizing those plans.
Excavation and removal contracts give HCFCD a head start on construction while engineers finish plans. This compresses the timetable.
The contract also saves taxpayers money. It gives Sprint the right to remove up to 500,000 cubic yards for a grand total of only $1000. Sprint makes its money by selling the dirt at market rates to home- and road builders. The only restriction: the dirt can’t be placed in the floodplain.
Posted by Bob Rehak on 4/4/2023
2044 Days since Hurricane Harvey
The thoughts expressed in this post represent opinions on matters of public concern and safety. They are protected by the First Amendment of the US Constitution and the Anti-SLAPP Statute of the Great State of Texas.
https://i0.wp.com/reduceflooding.com/wp-content/uploads/2023/04/20230401-DJI_0375.jpg?fit=1200%2C799&ssl=17991200adminadmin2023-04-04 10:05:432023-04-04 10:05:45Woodridge Village Excavation Surpasses 100,000 Cubic Yards
The second half of this week will likely be very wet. The National Weather Service’s (NWS) Weather Prediction Center forecasts widespread rain totaling 4″ with isolated areas getting 5- 6″ between Wednesday and Sunday.
Seven-day forecasted rain totals, predicted as of Monday morning 4/3/2023.
However, the rain will come in several waves and be spread out. The sporadic nature of the rainfall plus dry ground will minimize the risk of flash flooding. But some forecasters are already warning of possible street flooding, especially where storms cluster or train.
Timing of Rainfall
An upper level storm system will slow and eventually stall over the Houston area from Wednesday-Saturday. Scattered showers and thunderstorms will accompany the frontal passage on Wednesday.
As the front slows and lingers just off the upper Texas coast, both the Gulf and Pacific will feed moisture into our area along the boundary. Moisture values will approach the maximum levels for early April by Thursday and Friday.
As the cold front transforms into a coastal trough along the coast or just inland, periods of widespread showers and thunderstorms will be possible Thursday and Friday.
Given the stalled system, repeat cell training will be possible which may quickly produce areas of heavy rainfall.
Jeff Lindner, Harris County Meteorologist
Runoff Will Increase As Ground Becomes Saturated
While it will not rain the entire period, several rounds of showers and thunderstorms will be likely. Expect 1-2 inches per day. And remain alert for cell clustering or training which could trigger street flooding.
Grounds are now very dry over the region and much of the rainfall should soak in. However, grounds will eventually become saturated and when they do, run-off will increase and so will the risk of street flooding.
Severe Weather Threat Low
At this time, the risk of severe weather remains low. The Weather Prediction Center rates our chances of flash flooding from excessive rainfall at less than 15% for both Wednesday/Thursday and Thursday/Friday. But monitor forecasts closely this week.
Posted by Bob Rehak on 4/3/2023
2043 Days since Hurricane Harvey
https://i0.wp.com/reduceflooding.com/wp-content/uploads/2023/04/image001.png?fit=796%2C558&ssl=1558796adminadmin2023-04-03 11:03:562023-04-03 11:05:18Up to 6″ of Rain Possible by Weekend