Tropical Forecast Suddenly More Active

Still three weeks from the peak of hurricane season (September 10), the tropical forecast has suddenly become more active. The latest seven-day outlook from the National Hurricane Center (NHC) shows four areas of concern. Two will not affect the Texas Gulf Coast. Eventually, the other two could get close.

Chances of Tropical Formation

According to the NHC 8 a.m. update:

  • The red area at the right currently has a 70% chance of tropical formation in the next seven days.
  • The orange area has a 40% chance. Environmental conditions are only marginally conducive for further development of this system, but a tropical depression could still form during the next couple of days while it moves west-northwestward at 10 to 15 mph across the central tropical Atlantic.
  • Neither of those systems poses a threat to Texas.
  • The yellow area in the middle approaching the Lesser Antilles has a 30% chance of formation.
  • The yellow area on the left will move toward the Gulf of Mexico by early next week. It also has a 30% chance of tropical formation.

The NHC updates its website several times a day during hurricane season. So bookmark it and check back often for the latest forecasts.

Local Impact Felt by Next Tuesday

Jeff Lindner, Harris County’s meteorologist, has been sending out updates all week long on the last system. Here’s what he had to say on Friday morning, 8/18/23. “A low chance of tropical cyclone formation remains possible over the western Gulf early to mid next week.”

“A tropical wave will reach the eastern Gulf of Mexico late this weekend. As high pressure over Texas lifts northward and centers over the Midwest early next week, this wave will continue westward and approach the Texas coast by Tuesday or Wednesday,” said Lindner.

Possibilities include a tropical wave, tropical depression, or weak tropical storm moving inland along the lower or middle Texas coast. Conditions appear to be generally favorable for some slow development, but dry air is lurking along the U.S. Gulf coast that could wrap into any developing system. Also any developing system could encounter wind shear over the western Gulf from the outflow of powerful Hurricane Hilary in the eastern Pacific Ocean.

Any Development Most Likely Near Coast

“With that said, the system will be moving over warm sea surface temperatures and systems, especially in the NW Gulf under the right conditions can tighten up just prior to landfall. This may be a situation where whatever is going to happen with any development occurs very near the coast,” said Lindner. 

Most Moisture Near Coast and West of Houston

Lindner concludes, “Regardless of development, tropical moisture will surge into the Texas coast as early as late Monday, but more likely Tuesday or Wednesday. For now, the greatest moisture looks to remain along and south of the I-10 corridor with areas north of I-10 still under the influence of the high pressure ridge over the Midwest. There will likely be a strong gradient in rain chances from south to north over the area next week with the potential for some desperately needed rainfall across the coastal locations.”

Subsiding air from the high to the north will determine how far inland the moisture and rain/bands reach. This map from the National Weather Service (NWS) helps visualize what the situation will look like by Monday, August 21.

Flood Risk Less than 5%

The risk of excessive rainfall that could cause flash flooding is less than 5% according to the NWS.

It’s pretty sad when you start wishing for a tropical storm. But we sure could use something to break the drought and cool us off. Yesterday’s high of 105 was the highest temp recorded in Houston since 1909, according to ABC13. And it could get close to that again today.

Posted by Bob Rehak on 8/18/23

2180 Days since Hurricane Harvey

More Drainage for Northpark Drive Expansion Project

The drainage project currently underway down the median of Northpark Drive represents only part of the drainage improvements for the expansion project. Another parallel drainage system about 250 yards north of Northpark will carry additional stormwater all the way from U.S. 59 to the Kingwood Diversion Ditch and Bens Branch. Project engineers call it “Ditch One.”

Additional Parallel Drainage Route North of Northpark

In the satellite image below, the two triangles at 59 surround the wooded areas at the Northpark entrance to Kingwood. Detention ponds similar to those at the Kingwood Drive entry will replace those wooded areas.

Northpark Drive cuts left to right through the frame just above the center. Red line shows route for supplementary drainage and where flow splits in two at Diversion Ditch.

The water surface elevation of the Northpark ponds will be several feet below grade, as you can see in this video.

The difference between the surface of the ponds and ground level will provide storage capacity to offset the increase in impervious cover created by the expansion of the roadway.

When the south pond fills up, it will overflow to the north pond. And when the north pond fills up, it will drain to the east via an eight-foot culvert. The eight-foot culvert by itself provides additional underground water storage before it reaches the eastbound ditch.

That culvert will go under Loop 494 and the UnionPacific railroad tracks, then turn left (north) until it gets past the businesses on the north side of Northpark. From there, it will empty into a ditch that heads back east again. See below.

Looking East from over 494 toward St. Martha Catholic Church. Arrows in distance show where Diversion Ditch splits off from Bens Branch. Note part of Northpark Drive in upper right.

Ditch One is barely visible in the photo above for two reasons.

  • The tree canopy is dense this time of year.
  • Due to lack of maintenance over the years, trees have grown up in the ditch. Contractors will have to clear them out to restore conveyance before completion of the project.

The Big Split

Once water in the ditch reaches the detention basins south of St. Martha Catholic Church, part of the water will enter the Kingwood Diversion Ditch and head south along the western edge of Woodland Hills. The rest will continue east and go down Bens Branch which angles diagonally toward Town Center and eventually empties into Lake Houston near Kings Harbor.

Looking N toward St. Martha in upper left at where flow in Ditch One splits into Diversion Ditch (foreground) and Bens Branch (right)

Why Diversion Ditch is Called Diversion Ditch

The split you see in the red line below is why the Diversion Ditch is called the Diversion Ditch. It is a man-made channel designed to take stormwater out of the natural channel (Bens Branch) to reduce flood risk for homes in the center of Kingwood.

Reverse angle looking S toward Diversion Ditch.

In the photo above, Bens Branch flows R to L. The Diversion Ditch flows south toward Kingwood Drive and Lake Houston. The blue water towers in background are near the firehouse on Kingwood Drive and Deer Ridge Park.

The City just finished cleaning out under the Northpark bridges at the Diversion Ditch. See results below.

Looking north at recent CoH excavation under North Park at Diversion Ditch.

Eventually, the Diversion Ditch itself will expand to match the increased conveyance you see under the bridges. Some engineers feel that constrictions like you see above contributed more to flooding than lack of capacity in the ditch itself.

Kingwood Drainage Priorities

Regardless, expansion of the Diversion Ditch was one of the top two priorities of the Kingwood Area Drainage Analysis. That project has not yet started.

Bens Branch has already gone through four phases of de-silting and de-snagging to help restore its conveyance. That was part of a major maintenance program by HCFCD after Harvey.

The route that Bens Branch will take to get under Northpark Drive east of the diversion ditch has yet to be determined. However, that phase of the project is still at least three years away. TxDoT is currently evaluating multiple alternatives suggested by engineers for the Lake Houston Redevelopment Authority. For more videos of the project, drainage studies and construction plans, see the LHRA website.

To see how ALL the ditches and streams in Kingwood connect, visit the Harris County Flood Education Mapping Tool. If you see a blockage in a Harris County Ditch, you can request service at HCFCD.

Posted by Bob Rehak on 8/17/2023

2189 Days since Hurricane Harvey

Colony Ridge Stormwater Detention Basins, Ditches Fail to Meet Liberty County Standards

Colony Ridge, the world’s largest trailer park, fails to meet Liberty County regulations for the construction of stormwater detention basins and ditches. The development’s basins and ditches routinely lack erosion controls such as grass and backslope interceptor swales. The resulting erosion can reduce the conveyance of streams, increase flood risk and threaten property both inside the development and downstream. The failure to follow those regulations imposes a hidden tax on residents of Liberty and surrounding counties.

No Bare, Earthen Slopes Allowed

Page 100 of the Liberty County Subdivision and Development Regulations updated in 2019 states that, “All drainage facilities must be designed and maintained in a manner which minimizes the potential for damage due to erosion. No bare earthen slopes will be allowed.“

Backslope Drain Systems Required

Pages 152 and 153 of the regulations also require backslope drain systems to “intercept sheet flow which otherwise would flow over the banks of drainage channels leading to erosion of the side slopes.” Swales behind the edges of basins and channels trap stormwater. Pipes then carry it to the bottom of the ditch or basin so that it won’t erode side slopes.

What Ditches/Detention Basins Should Look Like

The photo below shows a Harris County ditch with grass on the side slopes and pipes that lead from backslope swales to the bottom of the channel. Note how they reduce erosion and sedimentation.

Harris County ditch which follows regulations similar to Liberty County’s. Compare the Colony Ridge ditches below.

Compare Requirements to Photos

I took the pictures below on 8/12/23 from a helicopter while flying over Colony Ridge in Liberty County. Note the lack of grass and interceptor inlets/outlets. Also note the severe erosion that results.

Note severe erosion on banks of pond. Also note lack of backslope swales, inlets, and outlets in base of pond.
No backslope interceptor system. No grass.
No backslope interceptor system. No grass on sides of ditch.
Ditto.
Ditto

In some cases, the ditches and detention basins don’t even have perimeter maintenance roads and the erosion is cutting into people’s back yards.

Colony Ridge Household slipping into drainage ditch

Colony Ridge resident losing back of property due to ditch erosion.

The Largest Development Few Know About

Colony Ridge is large and growing rapidly. The satellite image below shows how it has virtually doubled in size within the last two years as it has grown from left to right and bottom to top. The large area in the lower left began developing around 2011. Those lines that look like hashmarks are thousands of mobile homes.

Colony Ridge Expansion
This satellite image taken in July 2023 does not even show the development’s current extent. Much of the area in the upper right below the clouds was cleared since then. See below.
Portion of Colony Ridge in upper right of satellite photo has now been cleared.

Colony Ridge already comprises more than 30 square miles. That makes it approximately one third the size of the area inside Houston’s 610 loop.

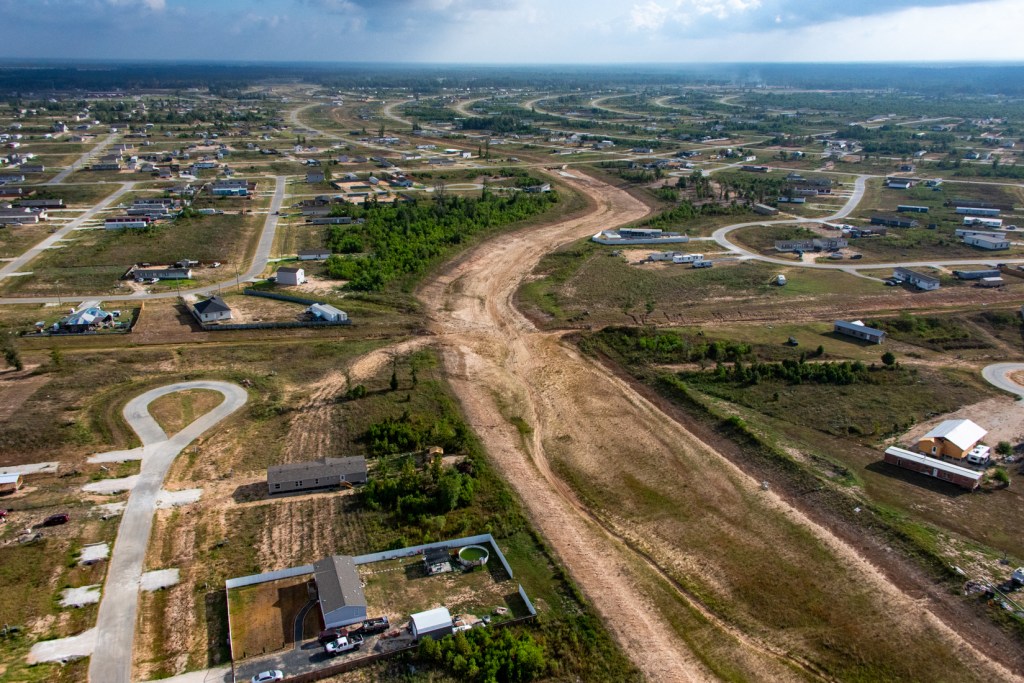
Mostly mobile homes and rivers of mud as far as the eye can see.

Erosion a Major Issue

Colony Ridge drains into three watersheds: the East Fork San Jacinto, Luce Bayou and Tarkington Bayou. And all of them drain into Lake Houston. That will make erosion from Colony Ridge Harris and Liberty County’s problem forever.

During floods, erosion will reduce the conveyance of downstream channels and rivers. Page 148 of the Liberty County Subdivision and Development Regulations has this to say about the effects of erosion and sedimentation.

  • “Erosion and sedimentation can have very serious effects on storm water drainage.”
  • “Erosion can cause slope failures, increase roughness coefficients, and generally reduce the efficiency of drainage channels. However, sediment deposition can clog drainage culverts and reduce the available conveyance in open channels.”
  • “Erosion can significantly reduce the maintainability of drainage facilities and increase the cost of maintenance by increasing the frequency with which repairs are required.”

LJA engineering wrote a letter to the Liberty County Engineer that underscores the need to plan ahead as the county transitions from rural to urban. “While limited regulation of development in a rural area may not significantly impact drainage issues, Liberty County is now challenged with explosive population growth and a particularly high percentage of socially vulnerable residents…” said the letter.

Hidden Cost to Downstream Residents

Most people in Harris County don’t even know that Colony Ridge exists. Yet the drainage practices there affect dredging costs downstream. The City of Houston, Harris County and Army Corps spent almost a quarter billion dollars dredging the headwaters of Lake Houston between Harvey and mid-2021.

Clearly, not all of that sediment came from Colony Ridge. However, the development practices in Colony Ridge and other developments like it will set the pattern for the future.

Developments are virtually impossible to change after people start building next to undersized basins and ditches that erode more with every substantial rain.

What You See Makes You Question What You Don’t See

Substandard construction practices make you wonder about engineering practices. Did Colony Ridge engineers produce reliable, accurate estimates of drainage needs? Are those ditches and detention basins sized properly? Will they hold enough runoff to protect residents?

Probably not. Even assuming engineers and contractors did their jobs properly (a big assumption), Liberty County still defines a 100 year/24 hour rainfall as 13.5 inches (see page 108), a rate associated with pre-Atlas 14 days.

Atlas 14 catalogs the current national precipitation frequency standards for every community in the U.S.

However, the phrase “Atlas 14” appears nowhere in the 2019 Liberty County Subdivision and Development Regulations.

But NOAA now defines a 100 year/24 hour rainfall for nearby Cleveland, TX, as 17.1 inches – a 27% increase above the current Liberty County standard. So in a hundred-year rainfall, everything you see in Colony Ridge will be 27% short of capacity. Few people likely understand this.

Consider also that NOAA is already working on replacing Atlas 14 with Atlas 15!

Posted by Bob Rehak on 8/16/23

2178 Days since Hurricane Harvey

The thoughts expressed in this post represent opinions on matters of public concern and safety. They are protected by the First Amendment of the US Constitution and the Anti-SLAPP Statute of the Great State of Texas.

HCFCD Spending Shows Slight Rebound

After a sharp decline in the first quarter of 2023, Harris County Flood Control District (HCFCD) spending rebounded slightly in the second quarter. Second quarter spending did not recover to recent peaks, but at least exceeded pre-2018 Flood Bond levels.

Data obtained via FOIA Request from HCFCD on 8/14/23

One Third of Bond Money Spent in Half the Projected Time

However, HCFCD is still behind schedule with mitigation related to the 2018 flood bond. HCFCD has not issued a flood-bond update since last December. But you can calculate progress yourself by looking at the charts in this post.

Six years after Harvey and five years after the flood bond, HCFCD and its partners have spent approximately $1.6 billion to improve Harris County drainage.

Taxpayers approved $2.5 billion in the 2018 flood bond. Approximately a third of that was designated for matching funds to attract another $2.5 billion from Federal, State and local sources.

That means five years after the bond (and six years after Harvey) we are are roughly one third of the way through the bond, which was intended to be a ten-year program. And that one third is likely overstated due to inflation.

Spending Inequities

The County has not spent the money to benefit all people equally, thanks to the so-called Equity Plan approved by Commissioners Ellis, Garcia, and Judge Hidalgo. They argue that people with low incomes should enjoy a higher level of flood protection because they are less able to fix their homes after disasters.

Harris County tracks spending by watershed. Eight watersheds have a populations where Low-to-Moderate Income (LMI) residents comprise a majority of the population. Those same watersheds also tend to have high social vulnerability indexes based on the CDC’s ranking criteria.

The eight LMI watersheds include:

  • Halls (72.5% LMI)
  • Hunting (67.8%)
  • Vince (64.9%)
  • Sims (60.8%)
  • Greens (59.8%)
  • Goose Creek (56.9%)
  • White Oak (51.9%)
  • Brays (51%).

HCFCD updated those LMI percentages at the end of 2022 to reflect the latest census data.

Actual Flood Damage No Longer Considered

Harris County no longer weighs damage in ranking flood-mitigation priorities.

Here’s how LMI-majority watersheds line up versus the county’s 15 other watersheds in terms of the money received since Hurricane Harvey.

Data obtained via FOIA Request from HCFCD on 8/14/23

Here’s how all watersheds ranked last quarter.

Data obtained via FOIA Request from HCFCD on 8/14/23

The San Jacinto declined a place in spending among the watersheds last quarter compared to “Since Harvey” (14th vs 13th). For the exact amounts each watershed received last quarter, see the table below.

Data obtained via FOIA Request from HCFCD on 8/14/23

Some readers might notice slight changes in the totals from past time periods. That has to do with ongoing transition of project and invoice coding in the county’s accounting systems. But they affect only about $2 million out of $1.6 billion. And most of those have to do with first quarter invoices received after my first quarter FOIA Request.

For those unfamiliar with the locations of various watersheds, see the map below.

watershed map of Harris County
From HCFCD 2019 Federal Briefing

Now compare spending to the actual flood damage during the last 44 years.

This map from MAAPnext, totals damage since 1979. Dark areas represent more damage. Compare the spending priorities above with actual damage in your watershed.

Flood control money used to flow to damage. But that’s no longer always the case.

Come back soon for more analysis of the latest data.

Posted by Bob Rehak on 8/15/23

2177 Days since Hurricane Harvey

This Disaster Preparedness Video Will Make You Smile

The Texas General Land Office (GLO) has produced a disaster preparedness video guaranteed to make you smile. It features GLO Commissioner Dawn Buckingham, MD, unpacking a disaster preparedness kit with several very young and very cute Texans. The 3-minute video is both informative and fun. Make sure you watch it with your children or grandchildren.

Every Texan, regardless of age should know how to pack a go-bag.  Said Buckingham, “Including your children in your planning and preparations helps ensure the next generation will be ready for potential severe weather events. Plus, you just never know what they’ll say!”

Click here to watch the video on YouTube.

Importance of Disaster Preparedness

Whether excessive heat waves, powerful tornadoes or damaging hurricanes, it is important to be prepared to evacuate. Texas has had 372 declared disasters since 1953. That’s more than five per year!

Of Texas’ total declarations, more than 30% happened in August or later. Evacuations are more common than most may think, and few disasters come with a lot of warning time.

Important Steps

As we approach the peak of hurricane season in the next month, the GLO encourages all Texans to prepare by doing the following:

  • Know Your Risk – Sign up for your community’s emergency warning system. The Harris County Flood Warning System lets you customize flood alerts by the watershed you live in, the gages nearest you, the amount of rainfall, and the water level in the nearest stream/river. The Emergency Alert System (EAS) and National Oceanic and Atmospheric Administration (NOAA) Weather Radio also provide emergency alerts.
  • Make Your Evacuation Plan – Check with local officials about updated evacuation shelters for this year. Know where your family will meet up if you are separated and where you will stay. Pack a “go bag” including items you need to take with you if you evacuate. A “go bag” should be easy to carry and kept in a place where you can grab it quickly. Check with drivetexas.org to find routes near you. To find a shelter near you, download the FEMA app at fema.gov/mobile-app.
  • Gather Supplies – Plan for your entire household including children, people with disabilities or access/functional needs, and pets.
  • Secure Documents – Remember to secure copies of important personal documents. Filing for government assistance requires documentation. Be sure to keep documents in a secure location and take them with you if you need to evacuate. Place these documents in a waterproof bag and back them up on cloud storage or a thumb drive.
  • Photograph the condition of your home and the items in it. That may prove valuable when making insurance claims.

For More Disaster Preparedness Information

Download the GLO’s Disaster Evacuation Checklist for more information. Find resources for family and pet preparedness at www.recovery.texas.gov/preparedness.

Posted by Bob Rehak on 8/14/2023

2176 Days since Hurricane Harvey

Six Years After Harvey, Bridge Still Blown Out at Colony Ridge

Two weeks short of Harvey’s sixth anniversary, FM1010, the main north/south artery between Huffman and Cleveland is still blown out due to excessive, uncontrolled runoff from Colony Ridge. Colony Ridge is the world’s largest trailer park and it’s just upstream near the East Fork San Jacinto in Liberty County. The productivity loss of local residents could easily have added up to half of a billion dollars by now.

Photos taken 8/12/23

I took all the photos below from a helicopter on Saturday, 8/12/23.

Blown out portion of FM1010, aka the Huffman-Cleveland Road and Plum Grove Road
The washout forces tens of thousands of nearby residents to take detour.

During rush hours, the backups on FM2090 from traffic trying to get to US59 can stretch miles because of failure to repair this bridge.

The washed out bridge lies at the end of this 2-mile Colony Ridge water cannon.
This Colony Ridge drainage ditch, like most others, does not have backslope interceptor swales to help control erosion or runoff.

Neither does this part of Colony Ridge have detention basins to help reduce the amount of runoff flowing into the East Fork San Jacinto.

Estimated Cost of Delays

I wonder if it’s even possible to accurately calculate the number of “people hours” lost to the senseless washout of the FM1010 bridge. But I will try.

For the sake of argument:

  • Assume 10,000 commuters are inconvenienced for an hour a day (half hour each way).
  • Multiply that times 365 days and then again by 6 years. You come close to 22 million hours.
  • Now multiply that times $25/hour.

Assuming these numbers are even in the ballpark, the washout could have cost local residents more than half of a billion dollars. Geez! How much can a twin culvert bridge and some blacktop cost?!

Expansion Accelerates Despite Access Issue

But that hasn’t stopped the Colony Ridge developer from expanding.

Colony Ridge now comprises more than 30 square miles. It has virtually doubled in size in the last two years. Landsat photo from 7/18/23 courtesy of Google Earth.

The development started around 2010. It now occupies 50% more land than Kingwood, which is now more than 50 years old.

The developer must be banking on a rapid increase in demand. He reportedly advertises in Mexico and Central America. The pitch: “Own your piece of America.”

Here’s what that looks like:

Note how the back yard is eroding into the drainage ditch. Photo courtesy of Chris Russo.

Long-Time Plum Grove Resident Worries about Evacuation During Storms

The long ditch above drains into Rocky Branch. According to a long-time Plum Grove resident, the stream was completely invisible from FM1010 “back in 2008 and 2011 even.” Then, he says, “Colony Ridge excavators and dozers showed up.” They widened and deepened the stream, but on the Colony Ridge side of the culverts only! 

According to the resident, FEMA engineers have told Plum Grove that an actual bridge is now required to convey all the water and survive any length of time. 

The resident vividly recalls Hurricane Rita approaching the Texas coastline in 2005 – before Colony Ridge. He said, “There was complete gridlock thru the City of Plum Grove as people from the Crosby and Beaumont areas were trying to evacuate inland. Plum Grove Road was bumper to bumper for 3 full days. Residents could not leave or get back home due to the gridlock thru our little city. How will THAT play out when the next Cat IV or V storm approaches us now that all the dense forests have been cleared?”

Good question!

Posted by Bob Rehak on 8/13/23

2175 Days since Hurricane Harvey
The thoughts expressed in this post represent opinions on matters of public concern and safety. They are protected by the First Amendment of the US Constitution and the Anti-SLAPP Statute of the Great State of Texas.

Why Lake Houston Is So Full in a Drought

I flew over Lake Houston this morning in a helicopter. I expected to see the barren lake bed in places like you could during the 2011 drought. However, much to my surprise, the lake was virtually full.

Coastal Water Authority Shows Lake Down Only 6 Inches

The Coastal Water Authority, which manages the lake for the City of Houston, shows Lake Houston is only down a half foot.

Coastal Water Authority dashboard as of 8/12/23 at 6PM

Water was lapping at the edge of the the spillway.

Lake Houston Dam spillway. Photo take 8/12/23 at approximately 10am.

SJRA Shows Lake Conroe Down About 15 Inches

Lake Conroe is down about 15 inches from its normal conservation pool (the target level). And it hasn’t released any water downstream toward Lake Houston in months. The SJRA’s dashboard shows

SJRA Dashboard on 8/12/23 at 6PM.

Luce Bayou InterBasin Transfer Canal Bringing the Water

So what’s keeping Lake Houston full? What is offsetting drought and evaporation?

A quick check of the gages on the Harris County flood warning system shows areas far upstream have gotten small amounts of rain. But the most water we saw moving all day was coming from the Trinity River via the Luce Bayou InterBasin transfer project.

Luce Bayou Inter-Basin transfer canal bringing water to Lake Houston from the Trinity River on 8/12/23 at 9 am.

Gages upstream from Lake Livingston, which captures water coming down the Trinity River from Dallas/Fort Worth, recorded approximately 11 inches of rain in June, July and August (to date).

Lake Conroe got enough rain to offset some evaporation but not enough to supply Montgomery and Harris Counties.

It’s nice to have backups for Lake Houston in a drought, especially widely scattered backups that can capture rain moving through different parts of the region.

Posted by Bob Rehak on 8/12/23

2174 Days since Hurricane Harvey

NOAA Increases 2023 Atlantic Hurricane Season Forecast

Reprinted from the National Hurricane Center website with some additions.

Scientists at NOAA’s Climate Prediction Center — a division of the National Weather Service — have increased their prediction for the ongoing 2023 Atlantic hurricane season from a near-normal level of activity to an above-normal level of activity.

Forecasters believe that current ocean and atmospheric conditions, such as record-warm Atlantic sea surface temperatures, are likely to counterbalance the usually limiting atmospheric conditions associated with the ongoing El Nino event.

Chances of Above Normal Season Increase from 30% to 60%

NOAA forecasters have increased the likelihood of an above-normal Atlantic hurricane season to 60% (increased from the outlook issued in May, which predicted a 30% chance). The likelihood of near-normal activity has decreased to 25%, down from the 40% chances outlined in May’s outlook. This new update gives the Atlantic a 15% chance of seeing a below-normal season. 

Prediction for Named Storms Increase from 12-17 to 14-21

In May 2023, NOAA predicted 12-17 named storms. NOAA’s update calls for 14-21 named storms (winds of 39 mph or greater). Of those, 6-11 could become hurricanes (winds of 74 mph or greater). And of those, 2-5 could become major hurricanes (winds of 111 mph or greater).

NOAA provides these ranges with a 70% confidence. These updated ranges include storms that have already formed this season.

2023 Atlantic Hurricane Season Forecast
The updated 2023 Atlantic hurricane season probability and number of named storms. (Image credit: NOAA)

The Atlantic basin experienced an active start to the hurricane season with five storms that have reached at least tropical storm strength, including one hurricane already. An average hurricane season produces 14 named storms, of which seven become hurricanes, including three major hurricanes.

Climate Factors Influencing Predictions

“The main climate factors expected to influence the 2023 Atlantic hurricane activity are the ongoing El Nino and the warm phase of the Atlantic Multi-Decadal Oscillation, including record-warm Atlantic sea surface temperatures,” said Matthew Rosencrans, lead hurricane season forecaster with NOAA’s Climate Prediction Center.

Sea surface temperature departures from normal for August 10, 2023. Source: NOAA

Considering those factors, the updated outlook calls for more activity, so NOAA urges everyone to prepare now for the continuing season.

Activity should ramp up quickly in August and September, if this season follows the pattern for the last 100 years.

El Nino conditions are currently being observed and there is a greater than 95% chance that El Nino will continue through the Northern Hemisphere winter, according to the latest ENSO discussion from the Climate Prediction Center.

El Nino usually results in atmospheric conditions that help to lessen tropical activity during the Atlantic hurricane season. So far, those limiting conditions have been slow to develop.

Climate scientists forecast that the El-Nino associated impacts that limit tropical cyclone activity may not be in place for much of the remaining hurricane season.

NOAA’s Climate Prediction Center

A below-normal wind shear forecast, slightly below-normal Atlantic trade winds and a near- or above-normal West African Monsoon were also key factors in shaping this updated seasonal forecast.

Five Storms Already

The Atlantic basin experienced a tropical storm in January which was unnamed. Since the start of the season, we have already experienced four other storms.

2023 Atlantic Hurricane Season Names
The 2023 Atlantic tropical cyclone names selected by the World Meteorological Organization. (Image credit: NOAA)

More About Hurricane Season Outlooks

NOAA’s hurricane outlooks are forecasts of overall season activity, not landfalls. A storm’s landfall is usually the result of mesoscale weather patterns and are typically predictable within roughly one week of a storm approaching a landmass. 

In June, NOAA deployed a new model to help produce hurricane forecasts. The Hurricane Analysis and Forecast System was put into operations on June 27 and will run alongside existing models for the 2023 season before replacing them as NOAA’s premier hurricane forecasting model.

NOAA urges everyone in vulnerable areas to have a well-thought-out hurricane plan and stay informed through official channels as this season progresses. 

I bookmark the National Hurricane Center landing page and check it first thing every morning during the season. NHC expects no tropical activity in the Atlantic during the next seven days.

Reposted by Bob Rehak on 8/11/2023 from the National Hurricane Center

2073 Days since Hurricane Harvey

Kingwood Drive Construction Bottlenecks Evacuation Route One Month Before Peak of Hurricane Season

Exactly one month before the peak of hurricane season, Kingwood Drive construction has kicked into high gear. Kingwood Drive is one of the area’s primary evacuation routes and experiencing construction bottlenecks.

peak of hurricane season
Source: National Hurricane Center. Data applies to Atlantic Basin.

Luckily, the National Hurricane Center expects no tropical activity in the next seven days. NHC does not forecast beyond seven days.

Aerial Photos Show Traffic Constrictions

Reconstruction of Kingwood Drive between Loop 494 and US59 has begun in earnest. TxDoT has narrowed traffic to one lane in each direction. And according to the City of Houston, TxDoT now estimates that construction may last until October. Previously, TxDoT estimated September.

Dave Martin, City of Houston Mayor Pro Tem, told a board meeting of the Lake Houston Redevelopment Authority this morning that he has asked the City, County and Humble ISD to supply traffic-control officers for the duration of Kingwood Drive construction to help reduce traffic snarls. But just before noon today, inbound traffic was backed up from all the way from 494 to 59.

I took the photos below on Thursday 8/10/2023. They show traffic constrictions in all directions.

Looking N from over Loop 494. Note 494 is still under construction. Number of lanes varies by area.
Still looking N. Kingwood Drive bisects the frame L to R and is down to one lane in each direction.
At noon, inbound traffic from 59 was backed up to freeway.
Outbound traffic on left was less congested. But that part quickly opened up to four lanes at this point today. Note how sidewalk and shoulder on left are being demolished. Focus of construction is on right side.
Looking eastbound toward 494. Note fresh concrete in lane on left.
Looking SW toward Insperity.
Workers are laying rebar in preparation for a concrete pour in upper right corner. Note recent pours in lower right.

The last shot above captures the confusing traffic in this area. Despite the addition of officers, I plan to avoid this area as much as possible until construction is complete.

At the moment, Northpark Drive makes a decent alternative despite construction there, too. Northpark traffic is still two lanes in each direction. And the project manager says it will remain that way throughout construction.

Grand Parkway Construction Went Much Faster

I sure hope that if a hurricane heads this way, TxDoT hustles up. Loop 494 construction started at Kingwood Drive in 2019, four years ago – exactly when TxDot started extending the Grand Parkway east from 59 to Baytown. Grand Parkway crews finished the 33-mile extension to Baytown 15 months ago. The project above covers 3 miles. Reportedly, TxDoT has switched contractors after problems with the first one.

Posted by Bob Rehak on 8/10/23

2172 Days since Hurricane Harvey

CoH Removing Sediment under Northpark Bridges, More Good News on Northpark Expansion

To help accommodate the expansion of Northpark Drive and the Kingwood Diversion Ditch, City of Houston (CoH) contractors are cleaning sediment from under the Northpark Bridges. This effort will eliminate a constriction in the Diversion Ditch that backed stormwater up, forcing it into Bens Branch, flooding people, businesses and schools downstream.

Separately, Week 2 of Northpark Drive expansion has seen other breakthroughs farther west.

  • Cleaning and expansion of the median ditch have reached almost to the UnionPacific (UP) railroad tracks that parallel Loop 494.
  • CoH and UP are also reaching agreements – at long last – that will let contractors move forward with construction at a much faster rate.

See more details and photos below.

Photos of Bridge Clean-out Taken 8/8/23

Looking east toward Woodland Hills at sediment removal project under Northpark bridges.
Side view looking SE toward North Woodland Hills shows more of work under bridge.
Looking west across Diversion Ditch and sediment removal project toward Russell Palmer. Photo by Father TJ Dolce of St. Martha Catholic Church.

8/8/23 Photos of Northpark Ditch Clean-out

Looking East from Northpark median at Public Storage. Note Duncan Donuts on left.
Reverse angle looking West shows remaining distance to UP tracks and Loop 494 at intersection.

The ditch clean-out will make room for 5′ x 7′ box culverts like those you see below. Workers have now buried all of the round concrete pipe stockpiled last week. They have also cut through concrete in the crossover between the fireworks stand and Flowers of Kingwood.

Steel cofferdam prevents wall collapse, protects workers in ditch.

The “step-down” from the box culverts to the round concrete pipe (now buried) will provide in-line stormwater detention during heavy rains that helps reduce flood potential in the receiving ditch, i.e., the Diversion Ditch.

UP and CoH Near Agreement on Access Rights

According to Ralph De Leon, project manager for the Lake Houston Redevelopment Authority and TIRZ 10, CoH and UP have come to terms on one agreement and are close to finalizing a second.

The first covers covers maintenance and construction. It will let contractors drill under the railroad tracks to address utility issues. Cost: $2.2 million.

The second agreement covers vertical and horizontal easements. Cost: under $200 thousand. The easements will let contractors build a bridge and access roads over the tracks.

However, it will also require the TIRZ to purchase two additional tracts of land north and south of Northpark at the railroad tracks.

Resident Reacts to Sediment Removal in Diversion Ditch

Flood activist and Kingwood resident Chris Bloch lauded the CoH sediment removal under the Northpark Bridge. He called it, “Great news for Kingwood!” 

“Removal of the sediment under the Northpark bridges will substantially recover conveyance capacity of the Diversion Ditch,” he added. “When the water level in the Diversion Ditch touches the bottom of the Northpark bridges, the bridge acts as a dam and water levels upstream rise rapidly.”  That forces water into Bens Branch, threatening homes and businesses on either side of it.

Remembering Stan Sarman

Bloch worked with former TIRZ president Stan Sarman, who was also an engineer, to approach Mayor Pro Tem Dave Martin and CoH about the need for this project. They agreed that sediment removal from the Diversion Ditch under the Northpark Bridges would help reduce flood risk in Woodland Hills, Hunters Ridge, Bear Branch and Kings Forest.  

Martin’s office arranged for the purchase order to get this project done.

Bloch took video during Imelda and shared it with Sarman, who had the original drawings of the bridge and channel from 1972. He is quick to give credit to Sarman who has since passed away. “I am not sure most Kingwood residents appreciate all Sarman did for Kingwood,” said Bloch.

This project and the repair of the channel under the Tree Lane Bridge are valued at nearly $1 million dollars.

Up Next

The LHRA/TIRZ are now providing weekly updates of construction activity so you can see what’s coming next.

Come back soon for more updates. The Lake Houston Redevelopment Authority will hold a public board meeting Thursday at 8 a.m. at the Kingwood Community Center to discuss this and other business.

Posted by Bob Rehak on 8/9/2023

2171 Days since Hurricane Harvey