Five Watersheds Lose Population While Harris County Gains Slightly
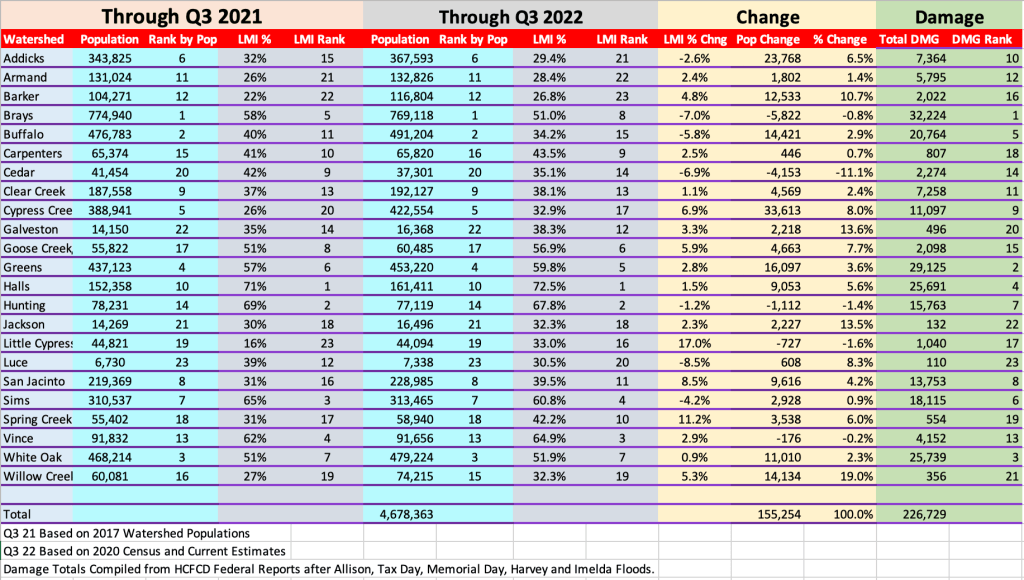
Like damage, population is one of the “weighting factors” considered in the distribution of flood-mitigation dollars. Compared to 2017 estimates of watershed populations in Harris County, 2022 estimates show that five watersheds have lost population. But overall, the county has gained 155,254 people.
The map below shows the location of each of these watersheds.

Reasons for Shifts Unclear
I had wondered whether the five major floods in Harris County between 2000 and 2020 (Allison, Tax Day, Memorial Day, Harvey and Imelda) would cause the most heavily flood-damaged areas to lose population. But that seems not to be the case.
The most heavily damaged watershed (Brays) lost the most population (in raw numbers). But the second most heavily damaged watershed (Greens) gained more than 16,000 people, the second largest gain.
I found no meaningful correlation between flood damage and population loss or growth. Nor do data suggest that flood-mitigation spending has much influence either. Contradictory examples abound. And statistical correlations rate as negligible to weak.
Five Watersheds Lost Population
Compared to the previous Census estimates from 2017:
- Brays lost 5,822 people (0.8%)
- Cedar lost 4,153 people (11.1%)
- Hunting lost 1,112 people (1.4%)
- Little Cypress lost 727 people (1.6%)
- Vince lost 176 people (0.2%).
In percentages, Cedar Bayou lost the most population. Cedar was the sight of the Arkema disaster which blocked evacuation routes along Highway 90 during Harvey. The watershed currently has only about 37,000 people, ranking it 20th among the 23 watersheds in Harris County.
In five major storms between 2000 and today (Allison, Tax Day, Memorial Day, Harvey and Imelda), flood damage varied widely within those five watersheds:
- Brays flooded 32,240 structures, the most of any watershed.
- Cedar flooded 2,274.
- Hunting flooded 15,763.
- Little Cypress flooded 1,040.
- Vince flooded 4,152.
18 Watersheds Gained Population
Eighteen other watersheds gained population and also had widely varying degrees of flood damage. These, too, showed little correlation.
Altogether, the county’s watersheds gained 155,254 people, despite 226,729 damaged structures during the five major storms.
Negligible Correlation of Flooding and Population Gain/Loss
The “population flees flooding” hypothesis didn’t hold much water.
Flood damage and “number of residents lost” correlated at only a 0.16 level – insignificant. Flood damage and “percent of residents lost” correlated at only 0.28, extremely weak.
A perfect correlation is 1.0. It indicates that for every unit of change in one variable, there is a corresponding unit of change in another variable. However, that was far from the case here. Variations seemed random.
If long-time Harris County residents are moving to higher ground, they may be replaced by newcomers unaware of flood risks.
The County has a strong draw: jobs. Also, family, friends, neighbors and support networks remain powerful attractions that keep most people anchored.
The new HCFCD data do not suggest why gains and losses occurred.
Top reasons for relocation typically include: greater safety, better schools, better housing, new jobs, and upgrading from apartments to homes.
LMI Population Trends
HCFCD also measures “LMI population.” LMI stands for Low-to-Moderate Income. The Census Bureau defines LMI as “families making less than the average for the region.”
Harris County has 42.6 % LMI residents. So 57.4% of residents make above the average for the region.
This is important because the LMI percentage plays a huge role in partnership grants from the US Department of Housing and Urban Development (HUD). Most, but not all, HUD grants go to areas with LMI populations higher than 70%. A notable exception is the pending $750 million HUD Harvey flood-mitigation grant. It only requires that 50% of the money benefits LMI households.
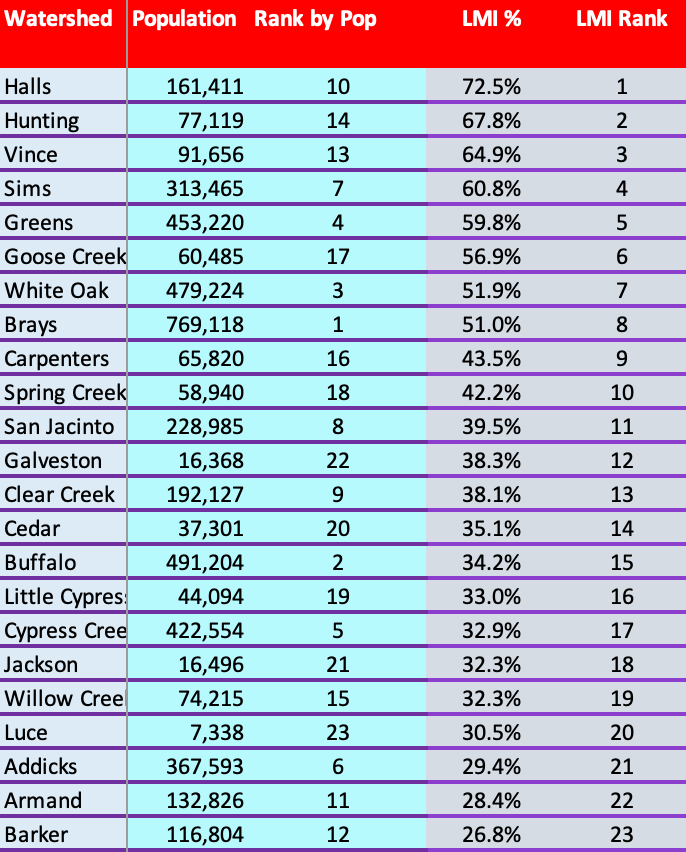
The latest HCFCD data shows that watersheds at both ends of the income spectrum lost LMI population. We still have the same eight LMI-majority watersheds we had in 2017. However, one deserves special mention.
Brays’ LMI population declined so significantly that it almost flipped from the “majority LMI” category to “majority upper income.” It went from 58% to 51% LMI.
Sixteen other watersheds gained LMI population. Some had huge flood losses; others had few.
The correlation between total flood damage and LMI Population Gain/Loss is .34, slightly higher than for the entire population but still considered “weak.”
Here are Harris County’s watersheds ranked in order of LMI population percentage.
My next post will discuss how the distribution of flood-mitigation funds relates to population changes and other factors. I will also discuss what the prospects for flood mitigation in the Lake Houston Area are during Lina Hidalgo’s second administration. Don’t miss it.
Posted by Bob Rehak on 11/21/22, based on data provided by HCFCD in response to a FOIA Request
1910 Days since Hurricane Harvey
The thoughts expressed in this post represent opinions on matters of public concern and safety. They are protected by the First Amendment of the US Constitution and the Anti-SLAPP Statute of the Great State of Texas.


