All Floodwaters Receding, But Flood Warnings Remain in Effect
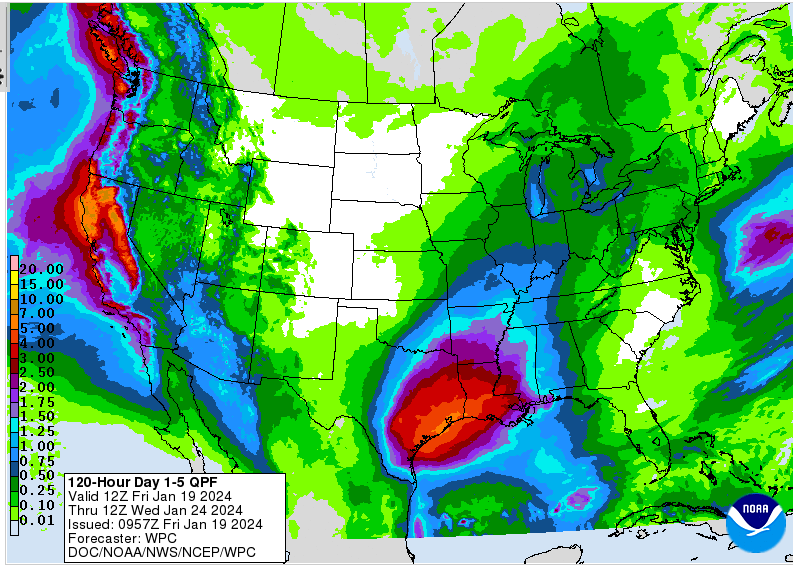
1/28/24, 2PM – After a week of near-constant rain and flooding, all river and lake gauges in the area show floodwaters receding, even if they aren’t below flood stage yet.
Whew! If you didn’t flood, you can stop worrying.
Nevertheless, the National Weather Service (NWS) still has flood warnings in effect for the areas:
- Near the San Jacinto East Fork at FM1485 in New Caney. The warning affects people in Montgomery, Harris and Liberty Counties. Expect moderate flooding, primarily in low lying areas through Tuesday. The river is currently at 62′; flood stage is 58′ at that location.
- West Fork around US59 until Monday afternoon. The river was at 51.4 feet, but bankfull is 45.3 feet.
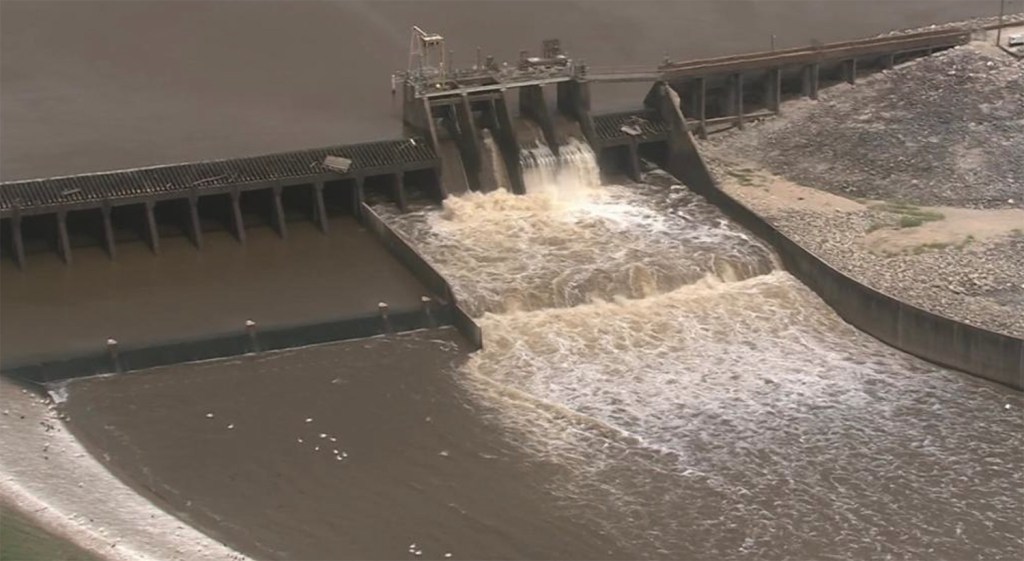
- Around Sheldon, below the Lake Houston Dam until tomorrow morning.
Photos Before, During, After Flood Crests
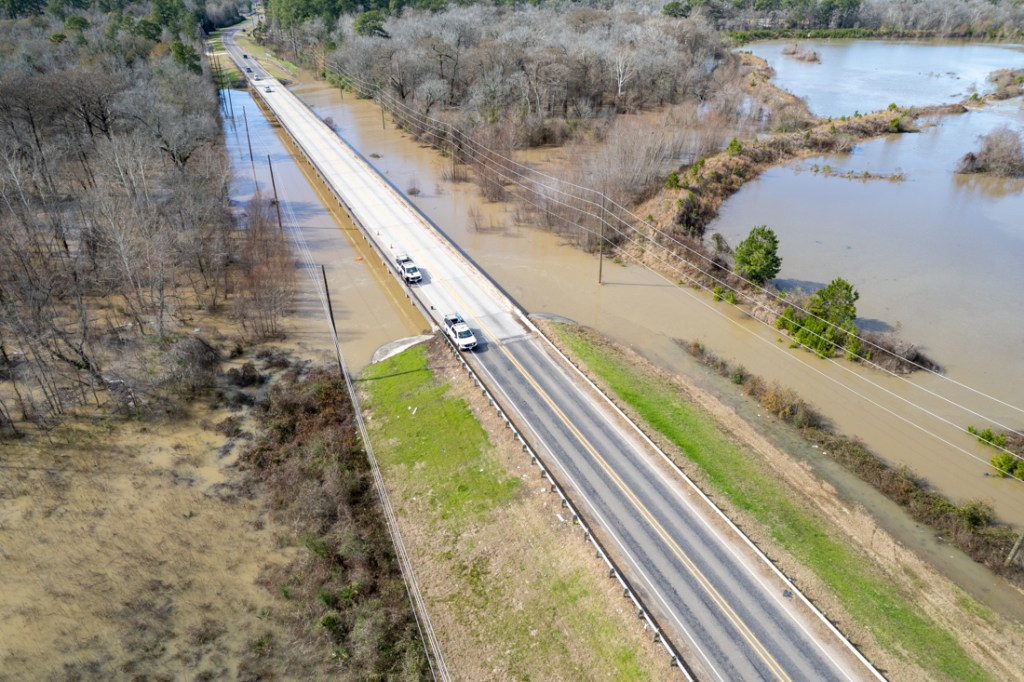
Below are 18 pictures I and a reader (who prefers to remain anonymous) took this week shortly before and after flood crests arrived. Each is dated and appears in chronological order. Together, they give you an idea of the extent of flooding. People who live in low-lying areas near major rivers were most affected.
But others, still suffering PTSD from previous floods, watched and waited with a sense of impending doom, wondering whether the water would claim their homes. It was a week of high anxiety and sleepless nights for many.
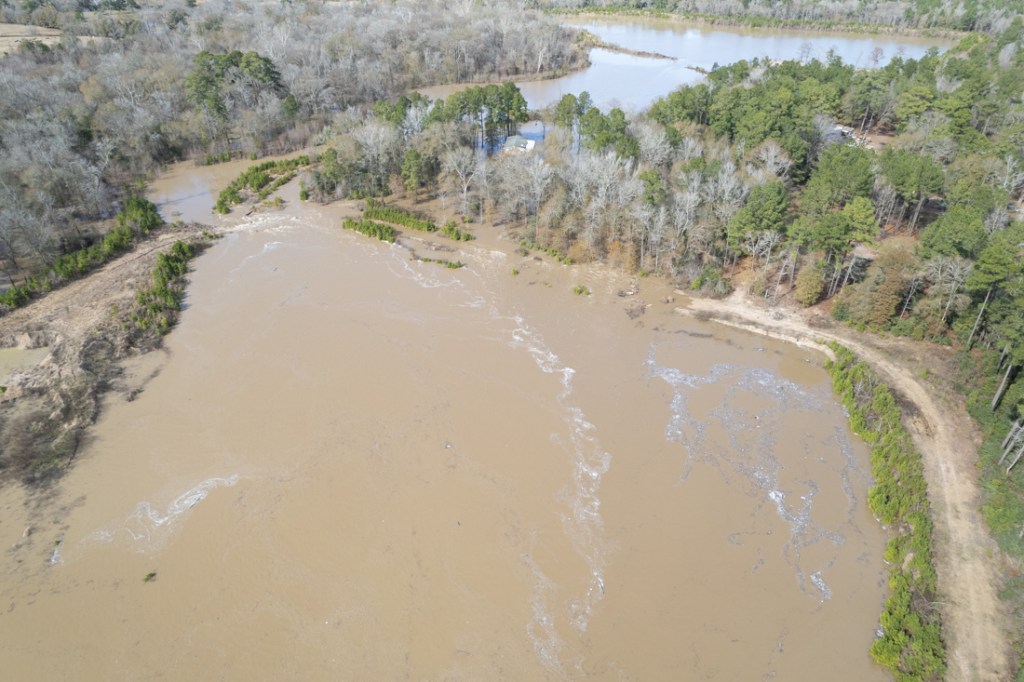
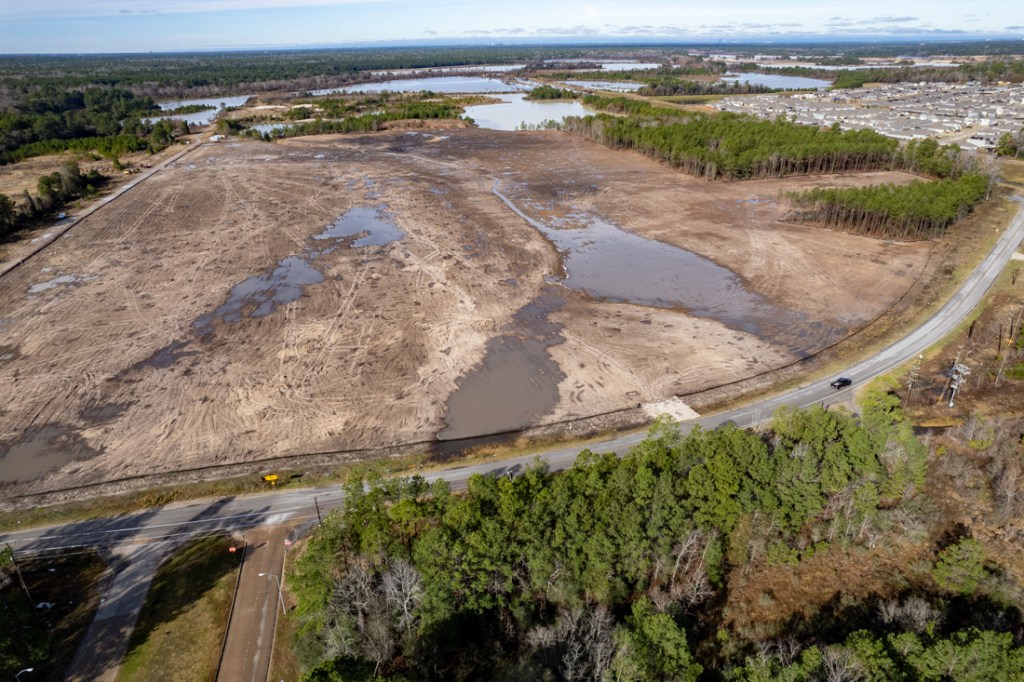
East Fork at Plum Grove
It was hard to tell where the East Fork was at times. The river had penetrated an adjacent sand mine in multiple places and was flowing through it.

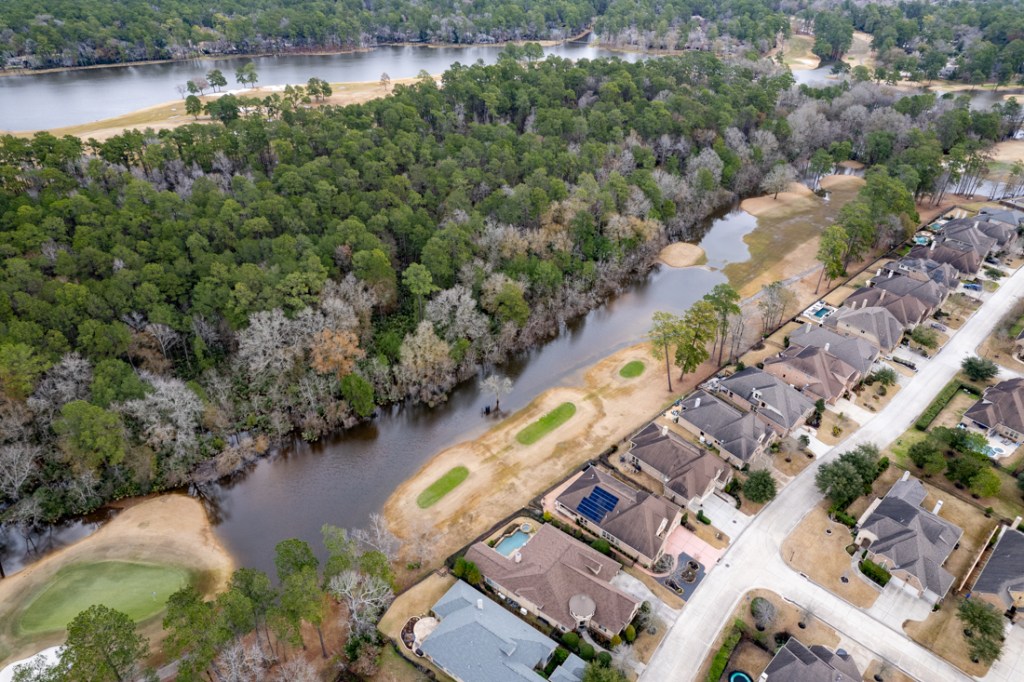
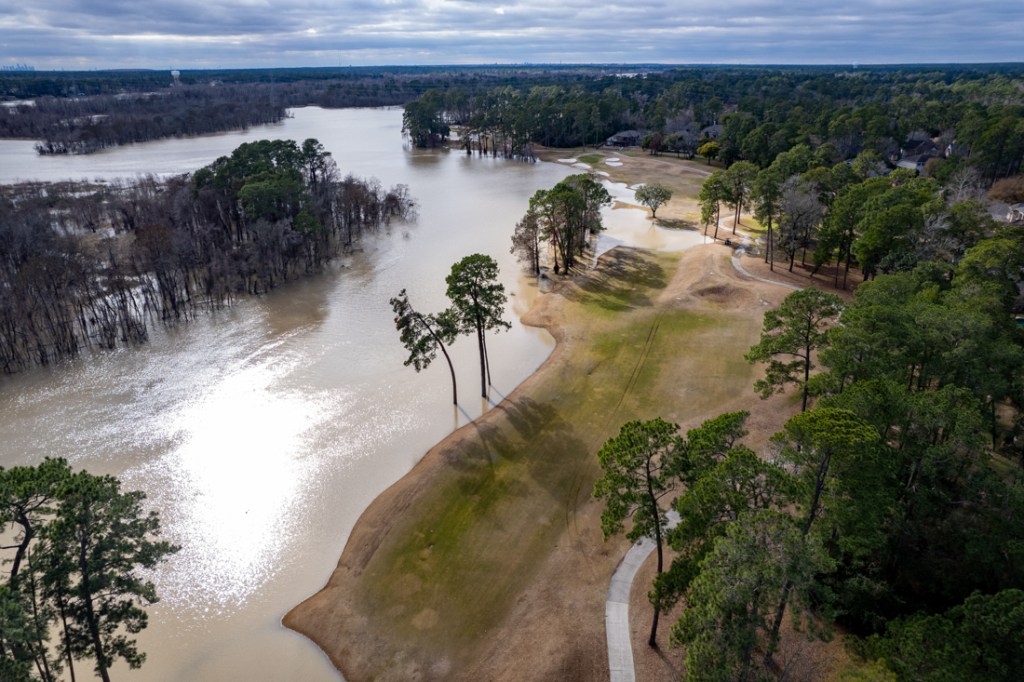
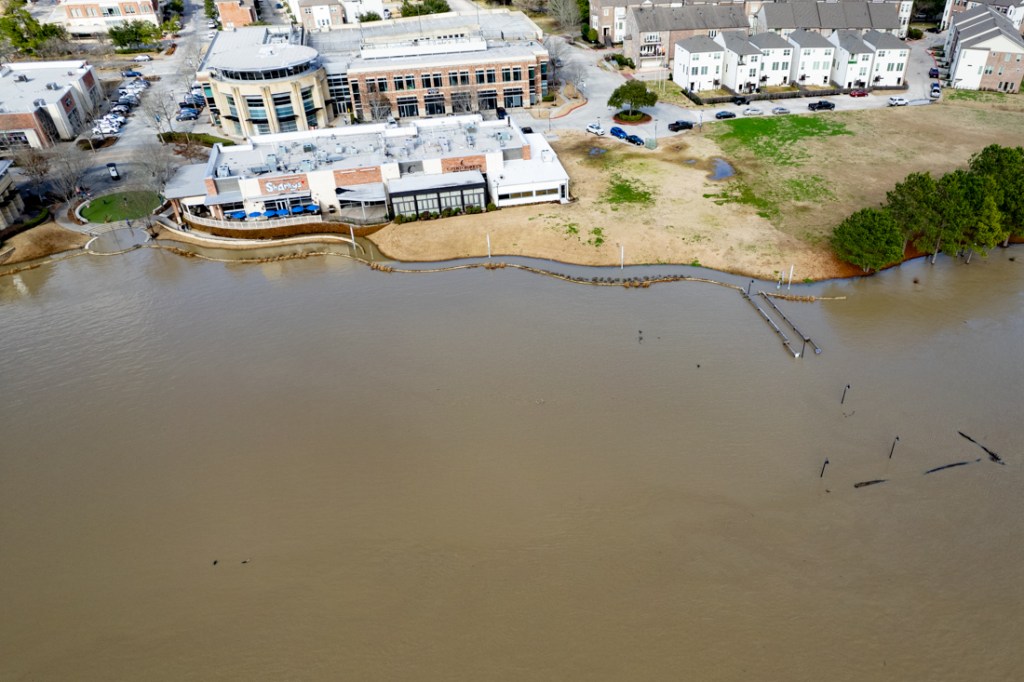
West Fork in Humble/Kingwood Area


Takeaways from Flood
I took several things away from this experience.
- Sediment mainly moves during floods. It’s too early to tell how much moved and whether it will be enough to impair the conveyance of rivers, bayous, creeks and ditches. But this flood represents a major opportunity for the engineers conducting the SJRA’s sedimentation study.
- Even relatively small amounts of rain (a couple inches per day) caused some major heartburn.
- The SJRA’s modeling nailed the flood peak on the West Fork. Even when the National Weather Service was predicting a peak in the 52′ range at US59, the SJRA said it would be 53.5′. The actual peak was 53.71, within tens of an inch.
- SJRA claimed the rainfall in the Lake Creek watershed was a major contributor. They don’t control that. It joins the West Fork downstream from the Lake Conroe Dam. A gage on Lake Creek showed 9.8 inches fell there in five days – among the highest totals for the region.
- The recent freeze killed a lot of vegetation that would normally have slowed runoff. That contributed to faster, higher peaks, according to testimony given during the SJRA board meeting last week.
- The SJRA did a much better job of communicating its gate operations to the public during this storm than ever before. It sent out a stream of press releases explaining what it was doing and why. I even received a personal call from an SJRA board member at 9pm before they increased their release rate to 19,500 cfs.
- The timing of the calls to news media got the news of the release on the 10 o’clock news before people went to bed. During Harvey, that didn’t happen. Many people were caught sleeping in bed by rising flood waters and had to evacuate by boat. Lesson learned.
- We need to do a damage assessment both upstream and downstream from the Lake Conroe dam to see where damage was concentrated. Did the SJRA do a good job of balancing upstream and downstream interests? Could gate operations have been improved?
- The SJRA says it waited to release water until it got within 6 inches of the top of its tainter gates. Had the water gone over the top of the tainter gates, they could have lost control. The gates would have become inoperable and the dam could have been placed in jeopardy.
- One leading hydrologist told me, “Understanding watershed hydrology is difficult. It rained quite a bit over a very large area. Watersheds all respond differently. The timing of the runoff reaching channels is crucial. How it combines with all of the other runoff from different places is key.”
- We need more floodgates on Lake Houston.
The worst of this event is behind us. Now comes the hard part. Cleaning up.
I wasn’t able to cover every area that flooded during this event. So, if you have photos of the flood or its impact that you would like to share, please submit them through the contact page of this website. Understand that all photos used here are in the public domain and may be shared by others. Finally, please indicate whether you would like a picture credit, and if so, how it should read.
Posted by Bob Rehak on 1/28/2024
2343 Days since Hurricane Harvey