Looking NW at Woodridge Village days before Imelda. During the storm, water flowed toward the circle, bottom right, with little to slow it down. Overflow went into surrounding streets.See video below taken from ground level.September 19, 2019. Sheet flow from the Woodridge Village development flows down Village Springs in Elm Grove.Family evacuating through North Kingwood Forest. Car submerged during Imelda at the end of Village Springs adjacent to Woodridge. People living in campers while restoring their homes from the May 7, 2019 flood were flooded again.
Security cam time lapse footage in Elm Grove on east side of Taylor Gully.Depth of flood in Elm Grove was about two feet at this house.Elm Grove debris pile after Imelda flood.Abel Versa had to grab his car to avoid slipping in ankle-deep muck on Village Springs.The bridge over Taylor Gully at Rustling Elms in Elm Grove caught debris flowing downstream.
Before the clearcutting, these areas had not flooded – even during Hurricane Harvey.
Lessons Lost
Lawsuits against the Woodridge Village developer and its contractors quickly followed. And flood victims won a major settlement. But the clearcutting lessons learned in court seem to be lost on other developers.
Lately, it seems that developers all around northern Harris, southern Montgomery, and Liberty Counties have employed clearcutting.
Mavera is clearing 2,015 acres at FM1314 and SH242.
Preserve at Woodridge is building 13-homes to the acre on 17 clearcut acres adjacent to a tributary of Bens Branch.
These represent just a few of the clearcutting stories I’ve covered in the last few months. So far, they’ve been lucky. We haven’t had any tropical storms like Imelda.
But still, risk remains. You’d think developers would hedge that risk by leaving some trees. They reduce erosion. Suck up rainwater. Slow down runoff. And filter water that may overflow detention basins.
But it’s their property. And your problem if we get another Imelda.
Posted by Bob Rehak on September 19, 2022
1847 Days since Hurricane Harvey and 3 years since Imelda
https://i0.wp.com/reduceflooding.com/wp-content/uploads/2019/09/Elm-Grove-9.19_68.jpg?fit=1500%2C1000&ssl=110001500adminadmin2022-09-19 20:49:442022-09-19 23:52:38Imelda’s Third Anniversary Brings Clearcutting into Focus
Developers of the new Royal Pines subdivision at the north end of West Lake Houston Parkway have made a clean sweep. They appear to have finished clearing and grubbing more than 200 acres. See the pictures below taken on 9/17/22.
Looking east toward the Triple-PG mine in the background. The current terminus of West Lake Houston Parkway is in upper right.Clearing began in April. Still looking east. Country Colony is in upper right.Piles of dead trees being turned into mulch. Looking S toward West Lake Houston Parkway, top center.Looking W. Not a tree left standing on where homes will be built. Nor a tree left standing between Royal Pines and Country Colony on left.
Trees As “Nuisance”
For most developers, including this one, trees are a nuisance. You have to work around them. They make it difficult to work the earth. And they often die later because of compaction of their roots by heavy machinery. Also, for smaller lots, there may not be enough room to leave trees and build a home at the same time.
But wholesale destruction like this can also contribute to flooding. We saw that a half mile southwest of Royal Pines at Woodridge Village when contractors cleared almost 700 acres before installing stormwater detention basins.
But beyond flood risk, marketing suffers. Marketers often try to build awareness by building a mystique around brands. Their goal: turn buyers into brand ambassadors. By preserving trees, Kingwood turned tens of thousands of families into brand ambassadors.
Missing Magic
It’s the most effective form of advertising possible. But Royal Pines won’t have it. Let me retell a true story that dramatizes the principle.
I’ll never forget one Christmas Eve when our kids were young. At dusk, snow started falling gently. I called the family together to witness the magic moment as Christmas music played in the background.
As we huddled at the front door, two deer strolled in front of us. You should have seen the kids’ eyes light up. They wanted to know which of Santa’s deer they were. It was our best Christmas ever.
You can’t buy publicity like that. More than 30 years later, I still tell that story.
Sadly, the kids who live in Royal Pines will likely never know a magic moment like that.
Oh, someone will eventually buy each home … even the ones in the flood plain. But the developer won’t have word-of-mouth advertising like I and my neighbors gave the original Friendswood Development Company. They won’t have tens of thousands of happy customers bragging about their community. Instead they’ll have a name that likely triggers a cynical comment as potential buyers enter the subdivision for the first time.
Impact of Clearcutting on Runoff, Water Quality
Clearcutting does more than drive wildlife away. It also increases runoff and reduces water quality. To see a simple experiment that dramatizes the impact, check out this 90-second video.
Progression of Clearcutting to Date
Also see the progression of clearing at Royal Pines during the last six months in these related posts.
https://i0.wp.com/reduceflooding.com/wp-content/uploads/2022/09/20220917-DJI_0599.jpg?fit=1200%2C799&ssl=17991200adminadmin2022-09-17 17:08:292022-09-19 11:13:11Clean Sweep for Royal Pines
Below is a brief digest of nine items concerning flood risk in the San Jacinto River Basin. Many of the groups mentioned need public input on their recommendations before they move forward. So make your voice heard.
Flood Gate B/CR
Addition of More Flood Gates to Lake Houston: Engineers expect to have a Benefit/Cost Ratio (B/CR) worked out no later than mid-October 2022. The ratio depends on the alternative selected (i.e., quantity of gates, type of gate [crest vs. tainter], and gate location [spillway vs. earthen portion of dam]. The engineers need to balance upstream and downstream safety with benefits, costs and environmental impact. Finding the optimum balance is not simple. And any solution is likely to cost more than the original FEMA budget. Mayor Pro Tem Dave Martin has had discussions with authorities at the state level about additional funding.
Engineers first examined more crest gates on the Lake Houston Spillway (left) and are now examining additional tainter gates in the earthen portion of the dam (right).
Related to San Jacinto River Authority
The SJRA could have its own digest this month.
Subsidence and Water Well Operational Costs: This hour-plus interview with Jace Houston on Hank’s Think Tank puts the Montgomery County Water Wars into perspective. Houston discusses the San Jacinto River Authority (SJRA); its mission; contracts with municipalities and MUDs; rates of water usage in Harris and Montgomery Counties; aquifer recharge rates; how aquifer drawdowns escalate operational costs; how the SJRA got into the water treatment business and more. Whether water costs or subsidence concern you, it’s well worth watching.
SJRA Groundwater Reduction Plan Committee Meeting: MONDAY, SEPTEMBER 19, 2022 – 11:30 A.M. Go in person if you would like to make a public comment or watch it online. This month, the invited guest speaker is Samantha Reiter, General Manager at the Lone Star Groundwater Conservation District.
SJRA Sunset Review: The Texas Sunset Act requires the Sunset Commission to periodically review SJRA and recommend whether to change state law to improve the authority’s efficiency and effectiveness. The Legislature ultimately will decide whether to adopt Sunset Commission’s statutory recommendations. The Sunset Commission also may adopt management directives for SJRA that do not require statutory change. The Sunset process has three stages: review; public meetings and input; legislative actions on Commission recommendations. The Staff report will be published in November 2022. Visit www.sunset.texas.gov to learn more and sign up for email alerts on the report.
Sedimentation: The SJRA is leading an Upper San Jacinto River Basin Regional Sedimentation Study. It needs your input! The SJRA has developed a sediment deposition dashboard that shows locations in watersheds with known issues. Do you know locations that experience sediment deposition? If so, email floodmanagementdivision@sjra.net. The SJRA would like to add them to its dashboard. What kinds of information are they looking for? Where the sediment comes from; where it builds up; what causes build-ups, etc. Both photos and text are welcome.
The San Jacinto West Fork has 20 square miles of sand mines in the 20-mile reach between I-45 and I-69.
Regional Flood Plan Open Houses
San Jacinto Regional Flood Planning Group Meetings on DRAFT Plan. The San Jacinto Regional Flood Planning Group submitted its DRAFT Regional Flood Plan to the Texas Water Development Board on Aug. 1, 2022. Here’s my summary. The public is invited to provide feedback on the DRAFT Plan and learn more about flood risk, stormwater management, and flood mitigation projects in two upcoming open houses.
In-Person Public Open House: Tuesday, Sept. 27, 2022, from 5:30 – 7:30 p.m. at the White Oak Conference Center, 7603 Antoine Dr., Houston, TX 77088.
Virtual Public Open House: Thursday, Sept. 29, 2022, from 5:30 – 7:30 p.m. (Register here to receive Zoom access information).
There were three major flood-related anniversaries this month that could also have their own digest.
Anniversary of Great Galveston Hurricane: After all the hoopla surrounding the fifth anniversary of Hurricane Harvey, most people missed the anniversary of the deadliest natural disaster in North American history. It happened on September 8, 1900. According to the National Oceanic and Atmospheric Administration, the storm killed more than 6,000 people, destroyed more than 3,600 buildings and pushed 15 feet of water ashore. It was so devastating that it reshaped the region. It caused people and businesses to move further inland to a then-tiny city called Houston.
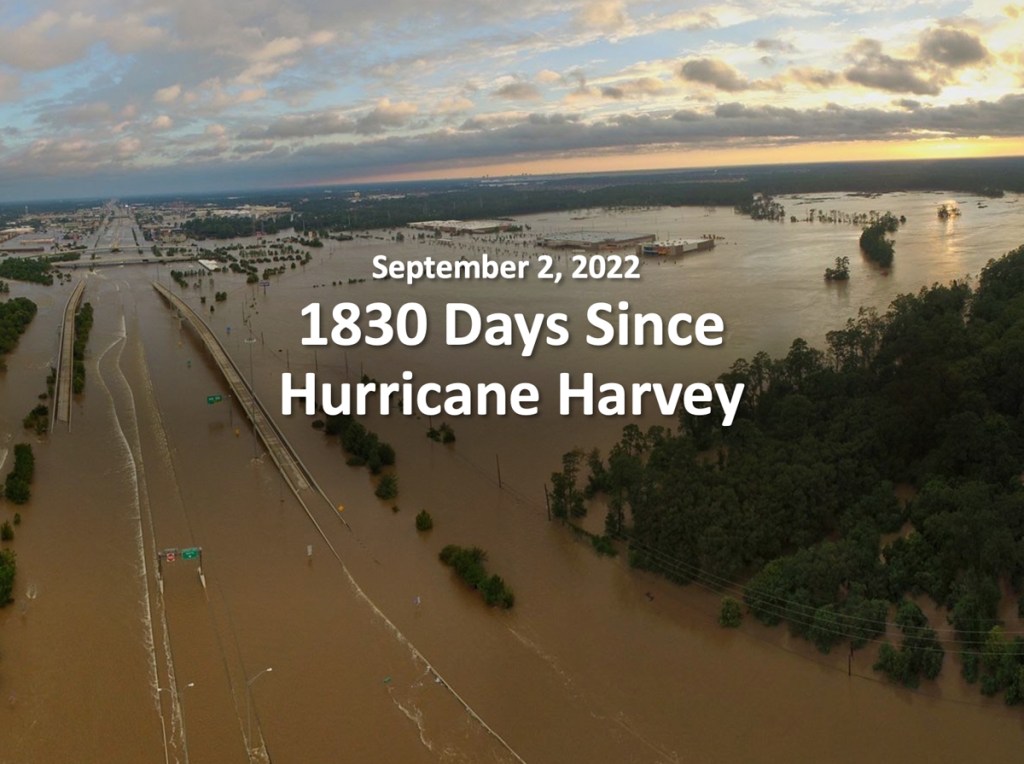
Hurricane Harvey Mitigation Update: On September 2, I gave a talk at Kingwood College about Hurricane Harvey and the status of flood-mitigation efforts in its wake. It starts with a look back at the damage from Harvey. Then it covers why we flood. And finally, it discusses the status of approximately two dozen mitigation efforts. See it on YouTube at: https://youtu.be/PjXX042NEPE.
Homes on Village Springs in Kingwood were still recovering from a May 7th, 2019 flood when they flooded again during Tropical Storm Imelda in September.
And that’s your September digest.
Posted by Bob Rehak on 9/16/2022
1844 Days since Hurricane Harvey
https://i0.wp.com/reduceflooding.com/wp-content/uploads/2021/02/20210101-RJR_4942.jpg?fit=1200%2C800&ssl=18001200adminadmin2022-09-16 14:11:312022-09-16 14:15:33Flood Digest: Brief Updates on 9 Flood-Related Items
Harris County Flood Control District (HCFCD) has essentially completed Batches 1 and 2 of Cypress Creek major maintenance projects, according to District spokesperson Karen Hastings. On 9/12/22, I photographed the freshly repaired and reseeded channel K131-00-00 (Spring Gully) at Cypresswood Drive, one of the last projects in Batch #1. See the pictures below.
Looking NW at K131-00-00 (Spring Gully) across Cypresswood Drive in foreground. Location is about a block west of TC Jester.
Such projects typically involve desilting. That involves removing accumulated sediment that reduces the conveyance of the channel.
Same tributary from a vantage point a little farther upstream.Looking NW.At the split, you can see that repairs extend farther upstream. Spring Gully goes toward the right; Theiss Gully to the left.
Even though maintenance on Spring Gully may be complete for the time being, additional projects are in the works to provide even more flood relief to the area.
TC Jester Stormwater Detention Basin
Among them is the capital improvement project below. Note the two red ovals in the photo. They loosely represent the locations of what will become two large detention basins on either side of TC Jester.
Looking SE across Cypresswood Drive. TC Jester cuts across Cypresswood in the upper left and continues S between the circles. Looking SE toward TC Jester in upper left. HCFCD has a head start on a detention basin thanks to an E&R Contract.
E&R Contract
E&R stands for Excavation and Removal. HCFCD has owned this property and the property across TC Jester for years. Knowing that someday a detention pond would be built here, HCFCD entered into an E&R contract with a dirt company. Such contracts give dirt companies the right to excavate the dirt and haul it away for pennies a truckload. The company then makes its money by selling the dirt at market rates.
Such contracts also create a quadruple-win situation.
Taxpayers get dirt removed virtually for free.
HCFCD gets a head start on excavation.
The hauling company reduces its costs.
Home- and road-builders reduce their costs.
The main restriction: excavated dirt must be taken outside of the floodplain.
The main drawback: If the market slows, so does excavation.
This contract is very similar, if not identical to the one with Sprint Sand & Clay on the Woodridge Village property in Montgomery County. There, HCFCD hopes to more than double the stormwater detention capacity on the site.
Area shown in photo above with E&R contract is approximately 40 acres.HCAD has owned this since 2003.Area east of TC Jester is almost 100 acres.HCAD has owned this since 2015.First phase of expansion will include light blue area.
Together, the projects will mitigate the risk of future riverine flooding by providing a safe place to temporarily store stormwater runoff. That will reduce both the size of the floodplain and the water level within it.
Every cubic yard of dirt removed creates room for a cubic yard of stormwater runoff.
Crenshaw and HCFCD say that approximately 2689 structures are located nearby in the existing 100-year floodplain. The proposed detention basin east of TC Jester could reduce stormwater elevations in a 100-year storm by half a foot. The first phase will remove 87 structures from the 100-year floodplain. When complete, the full detention basinwill remove 271 structures from the existing floodplain.
Spending this money now should save money in the long run – money that would otherwise go to more costly post-disaster recovery programs.
Looking east over TC Jester toward area where HCFCD will build first phase of first detention basin. Photo taken 7/24/21.
Separately, Crenshaw has also requested another $8.25 million to begin building the planned Westador Stormwater Detention Basin farther east along Cypress Creek at Ella Blvd.
None of these projects will provide an instant fix for the entire Cypress Creek watershed. But together they will reduce risk in areas along it.
Posted by Bob Rehak on 9/15/22
1843 Days since Hurricane Harvey
https://i0.wp.com/reduceflooding.com/wp-content/uploads/2022/09/20220913-DJI_0556.jpg?fit=1200%2C799&ssl=17991200adminadmin2022-09-15 06:38:132022-09-15 06:55:57Batches 1 and 2 of Cypress Creek Major-Maintenance Projects Completed, More to Come
Late in the afternoon on 9/13/22, my phone started blowing up. Frantic callers asked, “Are you watching Commissioners Court?” I wasn’t unfortunately. I was working on a post about the completion of a flood-mitigation project. But my priorities quickly changed when I learned that the three Democrats (Garcia, Ellis and Hidalgo) voted – as a block – to take take “no action” on 32 separate projects. Each will deprive residents of Precincts 3 and 4 of services.
Adrian Garcia, Rodney Ellis and Lina Hidalgo removed 32 items from the 8/13/22 Harris County Commissioners Court Agenda that would have helped residents of Precincts 3 and 4.
The brazen no-action votes, led by Precinct 2 Commissioner Adrian Garcia, were in retaliation for Republican commissioners walking out of a vote that would have allowed Democrats to increase taxes at a time when rising inflation makes larger tax bills doubly difficult.
A quarter of the no-action votes directly targeted residents. The other three-quarters target companies that provide services that benefit residents, such as engineering companies that improve drainage.
Targeted items included residents’ community center wellness classes, maintenance, flood-rescue equipment, roadway improvements and drainage projects.
Violating Historical Norms
By agreement and tradition, historically, Harris County Commissioners do not interfere with each others’ business. So this sets a dangerous precedent in which one party weaponizes its majority to punish the opposition’s constituents. Here’s what happened.
Ramsey and Precinct 4 Commissioner Jack Cagle boycotted the meeting so that the Court would not have sufficient votes to raise taxes. In retaliation, Commissioner Adrian Garcia, aided by Commissioner Rodney Ellis and County Judge Lina Hidalgo, pulled dozens of Precinct 3 and 4 items from the agenda.
Commissioner Ramsey said in a press release that, “This is retaliation against Harris County residents at its lowest level. It punishes residents because they disagree about having a responsible fiscal budget. It’s childish and embarrassing for the Court and Harris County.”
Ramsey and Cagle have tried for several months to engage their Democratic counterparts in substantive budget discussions with little luck. The Democrats even rammed through a $1.2 billion bond proposal with no details except for a lopsided allocation plan that gave about 40% more to Democratic precincts.
Previously, Commissioners have agreed to respect the boundaries of one another’s precincts. “Today’s action is the latest example of Precinct 3 residents being stripped of services by the current Court,” said Ramsey.
Ramsey’s allusion to “latest” referred to a redistricting plan that left Ramsey with 47% of the county’s unincorporated area to maintain with only 25% of the budget.
Said Ramsey, “Judge Hidalgo and others would have you believe that since there was not a quorum at today’s Commissioners Court, the budget will fail. In reality, the lack of a quorum simply means that the maximum tax rate allowed by law – without voter consent – cannot be implemented. Instead, a smaller budget will be adopted.”
The difference between the two budgets is $100 million. Out of a $2.2 billion budget, that’s 4.5%.
Hidalgo counters that the extra money is needed for more “officers.” According to Ramsey, she referenced investigators and detention officers, “yet didn’t mention adding one patrol officer” who could combat street crime.
Hidalgo also threatened that if the maximum budget and tax rate aren’t passed, 180 flood projects that “…affect the lives of every single resident in Harris County” will be jeopardized. But the bond pays for those projects, and the difference between the two budgets for flood control is only $14 million. That’s .6% of the HCFCD’s budget. And Commissioners Ramsey and Cagle volunteered $7 million each from their precinct budgets to make up the difference.
Finally, Judge Hidalgo asserted that not passing the Voter-Approved-Rate budget instead of the No-New-Revenue budget would dramatically affect the Harris Health System. The difference between the two budgets is less than 2%. And Ramsey points out that many of the Health System’s requests are for capital investments which are not even a part of these budgets at all.
On-Call Engineering Contracts Delayed by Dems
So which projects did Dems pull from the agenda? Let’s start with retainer fees for on-call engineering in Precincts 3 and 4. The numbers below refer to agenda items. See full descriptions here.
#43 Pape-Dawson Consulting Engineers, Inc. for Precinct 3
#44 Volkert, Inc. for Precinct 3
#45 Cascade Civil Services, LLC for Precinct 3
#49 HVJ Associates, Inc. for Precinct 4
#52 Eneval, LLC for Precinct 4
#53 Volkert, Inc. for Precinct 4
Engineering Contracts for Specific Projects Also Delayed
In addition, the Dems agreed to delay approval of engineering contracts or contract amendments for specific projects in Precincts 3 and 4..
#51 Request to amend a contract Isani Consultants, L.P. for Professional Engineering Services relating to Stuebner Airline Road Segment C in Precinct 3.
#55 Approval of a contract with Edminster, Hinshaw, Russ and Associates, Inc. d/b/a EHRA to develop a Master Plan for improvements to Burnett Bayland Park in Precinct 4.
#67 Approval of an amendment to a contract with Huitt-Zollars, Inc. for improvements to Atascocita Area Trails Phase 2 in Precinct 3.
#76 Approval of Interlocal Agreement with City of Tomball to construct improvements to Nabors Parkway between Highway 249 and Holderrieth Road in Precinct 4.
#114 Approval of a contract with HNTB Corporation for engineering and landscape architecture services for a Road and Drainage Master Plan, Precinct 4.
Bizarre Delay
For unknown reasons, the Dems also voted to pull the following from the agenda:
#119 Request for approval to change the names of several projects in Precinct 3.
Delaying Release or Retention of Financial Surety
The following motions relating to approval of the release or retention of financial surety from developers were also taken off the agenda.
#123 Grand Oaks Section 9 in Precinct 4.
#124 Breckenridge West Section 7 in Precinct 3.
#125 Breckenridge West Section 10 in Precinct 3.
#126 Bridge Creek Section 2 in Precinct 3.
#127 Bridgeland Creek Parkway in Precinct 4.
#128 Bridgeland Sec 44 in Precinct 3.
#129 Bridgeland streets in Precinct 4.
#131 Groves Section 35 in Precinct 3.
#132 Groves Section 36 in Precinct 3.
#133 Newport Section 7 Partial Replat #3 in Precinct 3.
#134 Newport Section 7 Partial Replat #4 in Precinct 3.
#135 Windrow Section 3 in Precinct 4.
Delaying/Denying Services Directly Affecting Public
The items that most directly and immediately affect residents include the following. Garcia, Hidalgo and Ellis took each off the agenda.
#155 Approval to negotiate an agreement for surveying as needed in Precinct 3.
#160 Approval to convert Sam Houston Tollway Segment #3 in Precincts 3 and 4 to an all-electronic roadway.
#278 Approval to construct pedestrian trails along a drainage ditch of Brays Bayou under Addicks Clodine Road Bridge in Precinct 3.
#291 Renewal of 1-year contract for exercise classes in Precinct 3.
#342 Approval to bid reinforced concrete pipe, saddle inlets and related items for Precinct 4.
#343 Approval to bid asphalt roadway rehabilitation for the Western Trails Subdivision in Precinct 3.
#351 Approval to bid airboat and trailer purchases for Precinct 3.
#352 Approval to bid passenger buses for Precinct 3.
Most Troubling Item Cancelled, Not Just Delayed
#351 is especially concerning because the airboats would presumably be used for rescue operations during flooding…something the Lake Houston Area remembers all too well. The Dems outright cancelled that; they didn’t just delay it.
Watch the meeting and form your own opinions. Apocalyptic predictions take up the first three hours and fifty minutes. Garcia then starts listing the agenda items he wants to kill or take off the agenda.
Posted by Bob Rehak on 9/14/22
1842 Days since Hurricane Harvey
https://i0.wp.com/reduceflooding.com/wp-content/uploads/2022/09/20220913-Screen-Shot-2022-09-13-at-11.48.04-PM.jpg?fit=1200%2C629&ssl=16291200adminadmin2022-09-14 01:10:112022-09-14 19:26:54Dems Deprive Republican Precincts of Services
Harris County Flood Control District has essentially completed the first two batches of major maintenance projects along Cypress Creek tributaries and is ramping up for the third, according to District spokesperson Karen Hastings.
Current Batch to Cost about $10.8 Million
Construction costs for Batch 3 should total about $10.8 million. Batch 3 includes 11 channels. The projects within them will span 5.8 miles.
Batches 1-3 include channels within the Cypress Creek watershed for which the Flood Control District already has property rights. They were previously developed and altered. They do not generally include natural channels.
Below is a general list of the types of maintenance needed on these channels. However, not every channel will need all the types of maintenance listed.
Desilting is the removal of sediment deposited in channels after multiple rain events. The sediment can restrict the conveyance of channels leading to flooding. See below.
Location of Batch 3 Projects
Location of first project in Batch 3 circled in red. See photos below.
Photos Taken September 12, 2022
Looking west across K-124 at southern end of project. Street is Bridgeview Lane.Looking NW (upstream) across Bridgeview Lane. Father up the channel, still looking NW, at the current limit of construction. Because of the proximity of homes, it would be difficult to widen this channel if that became necessary in the future. Looking back toward SE from NW limit of construction several blocks up.
Altogether, projects such as this one will total almost 20 miles in Batches 1-3 alone. That should help reduce flood risk throughout the Cypress Creek watershed. Estimated completion for Batch 3 construction is Summer 2024.
But the major maintenance won’t stop there. HCFCD expects at least two more batches. The District will separately design each and put each out for construction bidding. Batch 5 will include major maintenance at multiple sites along Cypress Creek itself.
https://i0.wp.com/reduceflooding.com/wp-content/uploads/2022/09/20220912-DJI_0496.jpg?fit=1200%2C799&ssl=17991200adminadmin2022-09-12 20:00:312022-09-12 20:03:33Batch 3 of Cypress Creek Major Maintenance Projects Ramping Up
A friend sent me a link to a Facebook post by a landscape/design company called Happy Gardens featuring this image of nature’s flood protection – the root systems of native grasses.
Said Happy Gardens, “This is why you don’t have to water native grasses. And their roots act like sponges to control flooding.”
It’s interesting to see the parts of these grasses that we never see. Note that some of these roots have been folded back and tied up to minimize their height for display purposes! Some are deeper than the lady is tall!
Providing Multiple Defenses Against Floods
Such grasses help reduce flooding several ways. They:
Slow water down in storms, decelerating runoff, and giving more runoff more time to soak in.
Absorb water like sponges.
Bind soil and reduce erosion.
Maintain more of an ecosystem’s natural hydrographic profile, which extends the time of accumulation and reduces flood peaks.
Runoff in natural areas spreads out over longer periods and has lower peaks.
No Watering and Less Maintenance
An additional plus: you never have to water them. They do look a little (pardon the pun) “rangy.” So some neighbors might object…until they flood.
The West Fork, by contrast, had been devastated by sand mining and erosion. The eroded sediment contributed to massive buildups of sand in the West Fork which reduced the conveyance of the river and also contributed to flooding.
Sometimes all you have to do to enjoy the protection of nature is just let it be. I hope this powerful image serves a reminder of that simple fact.
During Hurricane Harvey, the Humble ISD Ag Barn at Deer Ridge Park flooded badly. Shortly thereafter, the school board made a decision to move the ag barn facility to higher ground using money from the 2018 bond.
Since then, the district purchased 7 acres of land at the intersection of Ford and Mills Branch Roads in late 2018, broke ground in 2020, and constructed several new buildings.
Photos of New Facility
The district originally targeted 2021 for opening the facility. But permit issues with the City of Houston delayed the target opening to 2022. Don Thompson, the contractor for the facility, tells me it is now complete. However, as of last Sunday, two dumpsters still remained in the parking lot. Here are several aerial pictures of the beautiful new facility taken on Sunday 9/4/22.
Looking south toward North Kingwood ForestLooking SELooking NNWLooking NNW over detention pond in foreground.
The day before I took these pictures, the area received 2.5 inches of rain. It looks like the detention pond did its job. It absorbed the water and then released it slowly toward White Oak Creek so as not to overwhelm the creek’s capacity and cause flooding downstream.
If all new construction retained its rain, we would all be a lot better off from a flood perspective. Thanks to the Humble ISD for a beautiful new ag barn, which hopefully should make both students, their parents and the animals safer from flooding.
The animals at the old ag barn had to be evacuated several times recently because of rising floodwaters.
Reminder
Today is the statistical peak of hurricane season. We’ve dodged any hits so far this year, but there’s still a lot of weather yet to come.
Posted by Bob Rehak on 9/10/22
1838 Days since Hurricane Harvey
https://i0.wp.com/reduceflooding.com/wp-content/uploads/2022/09/20220904-DJI_0455.jpg?fit=1200%2C799&ssl=17991200adminadmin2022-09-10 11:55:192022-09-10 15:37:13New Humble ISD Ag Barn Construction Complete
And the Memorial Hermann Convenient Care Center next door flooded just days before its scheduled grand opening in 2017. That delayed the opening 14 months for repairs!
What’s in a Name?
Was naming this center “The Docks” a wise move?
Lovett’s brochure and website emphasizes the HEIGHT of docks. Perhaps they thought that would reassure people concerned about flooding.
But the word “Docks” also conjures up waterfront images, reinforced by the proximity of the property to a drainage ditch, a large detention basin, and memories of Harvey. Probably not the best association!
I wasn’t surprised to see that the first two tenants both had a fitness theme. Yoga mats are a lot cheaper to replace than MRI and CAT-scan machines.
That said, many renters want exclusivity within a shopping center; more fitness businesses may not prosper in such close proximity. The YMCA is just three blocks south. And a fitness chain is rumored to be moving into the large retail center one block south next to the new ACE Hardware.
Lovett originally envisioned this center as a strip of restaurants. And their latest brochure, updated in March 2022, indicates they still hope to achieve that. It shows Asian, pizza, breakfast, and TexMex restaurants in remaining spaces.
New Name Needed
Frankly, I wish Lovett hadn’t built so close to major flood risk. Having said that, I hope they can rent the space and eliminate the ghost-town look. The trick may be finding businesses, like yoga, with minimal equipment that would minimize flood damage if it happens.
Having spent 50 years in marketing, I would advise Lovett to ditch their “Docks” name. They don’t have to rename it Mount Kingwood. But please lose the waterfront association. How about something like “The Food ‘n Fitness Center”? Eat up and slim down. Now, that sounds like fun!
Posted by Bob Rehak on 9/9/22
1837 Days since Hurricane Harvey
The thoughts expressed in this post represent opinions on matters of public concern and safety. They are protected by the First Amendment of the US Constitution and the Anti-SLAPP Statute of the Great State of Texas.
https://i0.wp.com/reduceflooding.com/wp-content/uploads/2022/09/20220908-RJR_0967.jpg?fit=1200%2C800&ssl=18001200adminadmin2022-09-09 17:34:552022-09-09 19:33:53Bad Name? “Docks” Center Still Mostly Empty
Hurricane Harvey flooded 100 percent of all the businesses in Kingwood Town Center. Recovery has been a long, hard road. Some retailers threw in the towel. Others hung on by their nails. The shopping center on the northwest side of Kingwood Drive and West Lake Houston Parkway was one of the hardest hit – caught between rising waters from Lake Houston and descending waters from Bens Branch. For several years, the entire center looked like a ghost town.
City of Houston crews remove sediment from under Kingwood Drive Bridge over Bens Branch by shopping center.
The remediation efforts seem to have bolstered confidence and encouraged the return of retailers.
Pardon Their Dust
For the last two years, loyal customers had to dodge construction as the shopping center got a facelift. But last month, the construction trailer and fencing disappeared. Today, I counted only four vacancies in the main part of the shopping center. And workmen are busy doing interior buildout on some of those.
Ghost-Town Look Gone
The ghost-town look is gone…replaced by pristine exteriors, new signage, and fresh landscaping. It will only be a matter of time before the remaining spaces refill.
Here’s how the center looks today.
A new Trek bicycle store recently opened, and makes a nice complement to other retailers. Around the corner, a fresh new look for the urgent care center and Walgreens.
Still Searching for Anchor Tenant…
Unfortunately, the center still lacks an anchor tenant.
The leasing agent, NewQuest, is rumored to have been in discussions with a large fitness center to occupy that space or part of it. This morning, I saw electricians entering the space to work. But NewQuest did not return a phone call to confirm or deny a deal with a new tenant. NewQuest’s website still shows the space officially for lease.
…But Appraised Value Quadruples Since Harvey
Regardless, you can see another sign of the shopping center’s success on the Harris County Appraisal District website. The appraised value of the center has more than quadrupled since those bleak days after Harvey.
Five-year appraised value history from HCAD.orgas of 9/8/22.Screen capture from HCAD.org as of 9/8/22.
Welcome Back, Retailers!
If you avoided this center during construction, explore what all the small business owners have to offer.
Posted by Bob Rehak on 9/8/2022
1836 Days since Hurricane Harvey
https://i0.wp.com/reduceflooding.com/wp-content/uploads/2022/09/20220908-RJR_0963.jpg?fit=1200%2C800&ssl=18001200adminadmin2022-09-08 15:17:032022-09-08 17:09:21Major Kingwood Shopping Center Almost Back