6/13/24 – NOAA’s National Hurricane Center’s 7-day outlook shows the first tropical threats of the season for the Gulf of Mexico and Atlantic.
From National Hurricane Center as of 1:16AM EDT on 6/14/24
That orange area in the Bay of Campeche carries a 40% risk of formation within 7 days.
According to NHC forecasters, “A broad area of low pressure is forecast to form over the southwestern Gulf of Mexico this weekend. Environmental conditions appear conducive for gradual development of this system, and a tropical depression could form during the early or middle part of next week while it moves slowly westward or west-northwestward.”
The Weather Channel says, “That would bring locally heavy rain to parts of the Gulf Coast from Louisiana to as far west as Texas and eastern Mexico, beginning Sunday and lasting well into the week. Exactly where the heaviest rain could fall remains uncertain this far out in time.”
As the system moves farther north, it will encounter record-warm sea-surface temperatures and wind shear should decrease.
The torrential rains in Florida this week serve as a warning that widespread damage doesn’t require a full-blown hurricane. Parts of Florida received 18-24 inches of life-threatening rain. News media are filled with images of flooded streets and stalled cars. The system could still turn into a tropical storm as it moves up the east coast.
If either of these storms turns into a tropical storm, its name will be Alberto. The next will be Beryl.
As Houston faces new tropical threats, the area is still recovering from non-tropical May storms.
Jeff Lindner, Harris County’s meteorologist, predicts we could see another 2-4 inches of rain from this next threat. He expects the heaviest rains to fall near the coast with decreasing amounts inland. Lindner also warns of strong wind and wave action near the coast.
Posted by Bob Rehak on 6/13/24
2480 Days since Hurricane Harvey
https://i0.wp.com/reduceflooding.com/wp-content/uploads/2024/06/two_atl_7d0.png?fit=900%2C665&ssl=1665900adminadmin2024-06-13 07:06:562024-06-13 07:21:39Hurricane Center Posts First Tropical Threats of Season for Gulf
May floods destroyed the popular “Overlook” hiking trail with spectacular river views in Kingwood’s East End Park.
The northern perimeter of East End Park is on the cutbank side of the San Jacinto East Fork where it joins Caney and Peach Creeks.
According to the National Park Service, “As water flows around these curves, the outer edge of water is moving faster than the inner. This creates an erosional surface on the outer edge (a cut bank) and a depostional surface on the inner edge (a point bar).”
You can see these forces at work in East End Park. For students interested in earth sciences, a simple stroll in the park can turn into a memorable learning exercise.
Looking N from over East End Park. Note how river makes a 90 degree turn.River flows toward right.
Note how a giant sand bar has built up on far side of river, inside the curve in the photo above.
However, it’s a different story when you get out over the water and look back at the south shore of the river bordering the park. No expansive, white-sand beaches beckoning boaters, picnickers and sunbathers on the East End Park side!
Tangled roots, downed trees, washed-out trail, destroyed bench (lower right) on East End Park’s Overlook Trail
Note that tree with a clearing behind it in the middle of the photo above and compare the photo below.
The washed-out trail suffered considerable erosion during Hurricane Harvey. At that time, an alternate trail was built farther back from the river. Now it, too, looks like it will require replacement.
“I Know There Used to Be a Trail Here Somewhere!”
Here’s how the same scene looked from the ground. Note the same tree in the middle of the photo below.
Photo courtesy of Dr. Charles Campbell
Poor pooch. How confusing! All the familiar smells and sights are gone.
The Kingwood Service Association will have to spend money making this area safe and usable again. Before the storm, it was one of the prettiest parts of East End Park.
Two of the photos in this poster were taken from the washed out trail: Blue Water (middle left) and pelicans (bottom center).
Mother Nature Can Be Difficult At Times
Unfortunately, East End Park repairs will pile on top of repairs to River Grove Park. The mouth of the Kingwood Diversion Ditch has silted in at River Grove, severely limiting the use of the boat launch there. The water is up about a foot since I took pictures of the new sand bar there a couple weeks ago.
However, a few small boats have churned a narrow channel through the sand with their props. I talked to the owner of a john boat this morning. The shallow draft of his boat meant that he could get through/over the sand bar, whereas larger ski boats could not.
Note sand churned up by the prop of the john boat at River Grove boat launch.That indicates how shallow the water is.
He virtually had the river to himself. And liked it that way. But the river won’t stay that way for long.
Remember to register your opinion about what to do with the River Grove boat launch with your Homeowner Association board before the HOA’s vote on options later this summer or fall.
Posted by Bob Rehak on 6/11/24
2478 Days since Hurricane Harvey
The thoughts expressed in this post represent opinions on matters of public concern and safety. They are protected by the First Amendment of the US Constitution and the Anti-SLAPP Statute of the Great State of Texas.
.
https://i0.wp.com/reduceflooding.com/wp-content/uploads/2024/06/20240611-DJI_20240611101341_0090_D.jpg?fit=1100%2C619&ssl=16191100adminadmin2024-06-11 16:31:532024-06-11 17:52:13May Floods Destroyed Popular Trail in East End Park
6/9/24 – After posting about four West Fork sand mine breaches just last night, I discovered two more this morning. Both were at the end of White Sands Drive, which branches off of Sorters-McClellan Road a half mile south of Kingwood Drive.
The first was at the Eagle Sorters mine north of White Sands. Operators have opened up a pit to drain it directly into the river.
The second was at the Williams Brothers Mine south of White Sands. There, nature did the dirty work. The January flood caused large slabs of the mine’s dike to break off and fall into the river. The May flood finished the job. The dike separating the mine from the river is now completely gone … like a cool spring breeze.
According to historical satellite images in Google Earth, the Williams Brothers Mine last showed signs of activity shortly after Hurricane Harvey. It appears to have been abandoned, but the Montgomery County Appraisal District shows that William Brothers still owns the property.
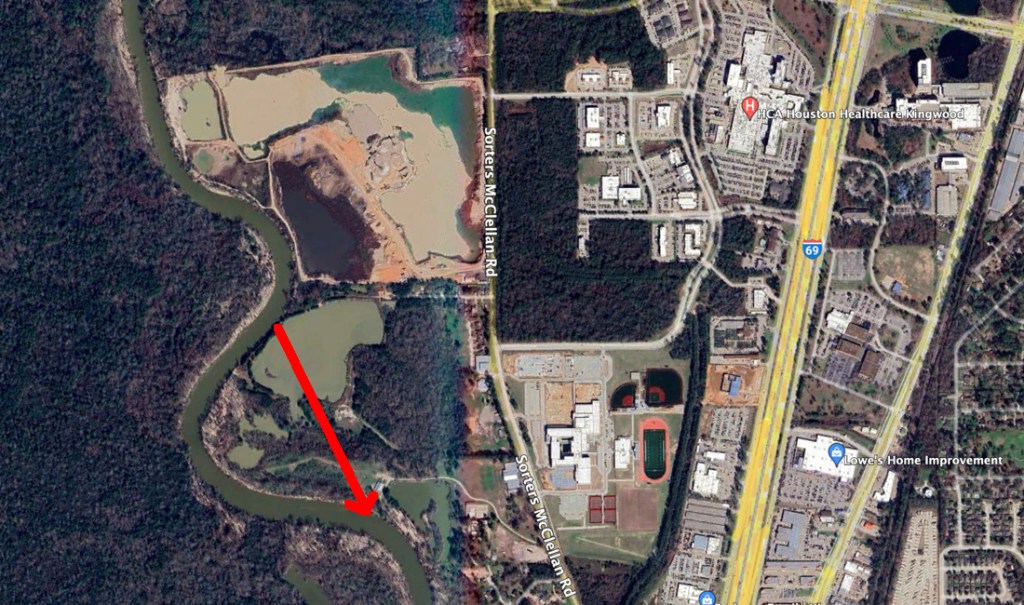
The satellite image below from Google Earth shows the respective locations of the two mines.
Eagle Mine (north) separated from Williams Brothers Mine (south) by White Sands Drive.Date 2/19/24 – before May flood wiped out Williams Brothers dike.
Eagle Sorters Mine Opens the Drain
Let’s look at the Eagle mine first.
West Fork in foreground, silty pit in background, and trench running between them.Reverse angle. Trench (center) leads from pit to West Fork at top of frame.Enlargement shows tracks of heavy equipment, such as an excavator, between the piles of loose dirt next to road.
This breach appears intentional.
Nature Finishes Job Started in January at Williams Mine
At the Williams Brothers Mine during May floods, nature finished the job it started in January. As reported in February, half of the dike that separated the mine from the river partially collapsed in the late January flood.
Giant slabs peeled off, taking huge trees and half of the mine’s perimeter road with them.
Williams Brothers dike after January Flood.
No you see it. Now you don’t.
Reverse angle.During May flood, dike disappeared altogether. Looking SW from over pit toward West Fork, which cuts diagonally through upper right.Looking downriver. West Fork on right, mine on left.Breach is approximately 600 feet long.
This wasn’t a pit capture in the traditional sense. At least not yet. It was more like nature making a hostile corporate takeover.
As you can see in the satellite image below, the Willliams Brothers mine sits on a point bar. The river has forced its way into the pit and will almost certainly cut the rest of the way through it in some future flood. See red arrow below.
River has now cut its way into pit, but has some distance to go before exiting other side.
We will need to watch this closely in future floods.
Consequences
In recent weeks, we’ve talked extensively about excessive sedimentation that blocks drainage ditches farther down the West Fork, potential flooding impacts and the high cost of remediation.
A study by Jacobs in Australia discusses many other dangers of floodplain mining. They include channel widening, undercutting of banks, and increased erosion and sediment transport.
However, understand that this isn’t floodplain mining per se. It’s floodway mining.
That means the mines are in the main body of the current during floods. So when the SJRA releases 72,000 CFS, look out below!
The red arrow in the map above shows the likely centerline of the current when the pit is finally captured. That means the center of the river will be a quarter mile closer to the new high $75 million high school shown in the lower center of the satellite image.
Part of the floodplain already crosses Sorters-McClellan Road. And FEMA has advised that the new flood maps, when released, will show the floodplains expanding 50% on average.
If that happens here, floodwaters will lap at the front door of the new high school. Oh well. It only cost $75 million dollars or so. And it isn’t even finished yet. But TACA says we need the sand to support growth.
As they say in high school, there’s a learning opportunity here. This is why we should keep sand mines farther back from rivers. It’s a public safety issue. End of lecture.
Posted by Bob Rehak on 6/9/24
2476 Days since Hurricane Harvey
The thoughts expressed in this post represent opinions on matters of public concern and safety. They are protected by the First Amendment of the US Constitution and the Anti-SLAPP Statute of the Great State of Texas.
https://i0.wp.com/reduceflooding.com/wp-content/uploads/2024/06/20240609-DJI_20240609132544_0077_D.jpg?fit=1100%2C619&ssl=16191100adminadmin2024-06-09 22:09:262024-06-09 22:18:23Two More West Fork Sand Mine Breaches Discovered
6/8/24 – Today, I discovered another sand pit captured by the San Jacinto West Fork. I also discovered two more pits with breached dikes. That makes at least four San Jacinto West Fork sand pits seriously damaged by the last storm.
The West Fork has now captured a pit that Hallett owned until earlier this year and another that it still owns.
Let’s look at each. See the photos below.
Photos Taken on 6/8/24
Pit Capture #1
I discovered the first pit capture in mid-May and photographed it again today.
Looking from over West Fork at blocked channel and former Hallett pit. River now runs through the pit.
Hallett sold this mile-long,, half-mile-wide pit to a real estate company called Riverwalk Porter LLC in January, just days before the first breach at the downstream end. The breach at the northern end, in the foreground above, happened in May.
Pit capture is a phenomenon where the river cuts through one side of a mine and out the other. Watch it happen in this table top experiment.
Pit Capture #2
I discovered a second pit capture today. The river punched through one side of the pit and now flows out the other. It’s taking a shortcut through the pit, rather than going around like it used to.
Note how the river curves way out to the upper left in the photo. The inside of that curve used to be what geologists call a point bar. Such areas usually contain finely sorted sand. And indeed, historical images in Google Earth show trucks pulling sand from river banks before Hallett started mining here.
Hallett pit on another point bar, also captured by West ForkRiver flows from top to bottom.
Ironically, this area was being considered by the SJRA for its sand trap study. They may have to reconsider that now.
Breach #1
Another pit purchased from Hallett by Riverwalk Porter LLC also drains directly into the West Fork. Nothing holds it back now.
The area around the pipe has expanded into a chasm.
Breach #2
Farther north, Heidelberg Materials Southwest Agg LLC owns another pit that now drains into the West Fork.
Looking S from over West Fork (bottom left) toward Heidelberg Property.
Historical satellite images of the Heidelberg property show that they started mining it decades ago. Then they sold the mine to another company and recently repurchased it. While this particular area is recovering, the company appears to be mining other areas around it.
And look what’s happening downstream from the breach above. Could this be a third pit capture in the making?
Downstream at the same pond, the river looks as though it could soon punch through another narrow dike. Photo taken 5/22/24.
If and when this happens, the river could then route itself through the pit above. That would make at least three pits captured on the West Fork.
There may be more breaches and pit captures that I have not yet found.
Geomorphic Processes Accelerated to a Human Time Scale
It’s interesting to watch geomorphic processes at work on a human time scale. It’s also disconcerting to know that without help from miners and the TCEQ – which did not establish setbacks of mines from rivers until 2021 – the West Fork would have much less sediment pollution.
See below.
Confluence of Spring Creek (left) and San Jacinto West Fork (right), where all of the sand mine breaches above area.
If you wish to lodge a complaint with the TCEQ, go to this web page. Last time I heard, they only inspect the river once every three years unless citizens file complaints.
Posted by Bob Rehak on 6/8/24
2475 Days since Hurricane Harvey
The thoughts expressed in this post represent opinions on matters of public concern and safety. They are protected by the First Amendment of the US Constitution and the Anti-SLAPP Statute of the Great State of Texas.
https://i0.wp.com/reduceflooding.com/wp-content/uploads/2024/06/Hallett-North.jpg?fit=1100%2C619&ssl=16191100adminadmin2024-06-08 21:54:082024-06-09 09:52:54Another Sand Pit Captured, More Breached by San Jacinto West Fork
6/7/24 – Last night, the Kingwood Service Association (KSA) Parks Committee discussed the future of its River Grove boat launch. As reported previously on ReduceFlooding.com, the boat launch has become seriously blocked by sand and other sediment coming downriver during the May floods, primarily from the West Fork San Jacinto.
After floods in January, boaters complained of difficulty navigating through the sediment to the river. So KSA commissioned a sonar study. It showed that approximately 11,500 cubic yards of sediment needed to be dredged to open the channel. The cost approached $800,000…without any contingency funds built in.
KSA’s board authorized the Parks Committee to spend the money at its April Board Meeting. However, board members also requested the Parks Committee to explore ways to lower the cost first.
During that exploration, May floods deposited even more sand. To avoid surprise overages, a dredging subcommittee asked the low bidder to do another sonar survey. The new survey indicated that the amount of sand needing removal increased about 50 percent.
Budget-Busting Costs
The cost – without any contingency funds for overages – represents 49% of KSA’s current Capital Assets Reserve Fund balance. And that prompted many tough questions from the Parks Committee. Especially since boat dock usage represents only a small part of KSA’s responsibilities. And because a relatively small percentage of Kingwood residents use the boat docks.
Through June 5, KSA has issued 837 boat trailer stickers. Compare that to 23,842 regular vehicle stickers. Only 3.5% of the vehicles using Kingwood parks use the boat launch.
Meanwhile East End Park needs extensive trail restoration after the last storm. And KSA is about to renovate the entry at Kingwood Drive and US59.
Note, however, that the mouth of the Kingwood Diversion Ditch (at the boat docks) also plays a role in flooding. The ditch drains the western third of Kingwood. And when it became blocked during Harvey, hundreds of homes behind the blockage flooded.
Options KSA Considered
Here is a slight revision of the River Grove boat launch presentation that the KSA Parks Committee reviewed last night. The revisions reflect changes discussed in the meeting.
To make it easier to understand, I’ve also shown the individual pages below with some background information.
The title slide shows sediment buildup at the mouth of the Kingwood Diversion Ditch in River Grove. Not only does it affect boating, if sediment continues to build, it could eventually back water up into homes as it did during Harvey.
Image taken after May floods when lake was down slightly for gate repairs at dam.
The next section of the presentation covered developments since the last Parks Committee meeting.
After the first sonar survey of the River Grove Boat Launch in February, the Dredging Subcommittee authorized a second survey to quantify the amount of additional sediment deposited by May storms and the cost impact…even as it looked for ways to reduce costs.
The cost of the second survey was necessary to be considered for FEMA debris removal/flood mitigation funds. You must prove that the money requested came from the storm covered by a disaster declaration. This became a huge issue with the Mouth Bar after Harvey.
The amount of sediment requiring removal increased 50% during May. The low bidder proposed hydraulic as opposed to mechanical dredging which is much faster. And the sediment would go to a property owner on the south shore of the river, instead of being trucked away.
By paying the landowner directly, KSA avoids markup on disposal costs.
The slide below shows an estimate of the revised costs and the current balance in KSA’s capital assets reserve fund. The River Grove Boat Launch dredging would consume 49% of KSA’s fund balance. Even though more sand is being dredged, the ability to pump the sand across the river helped to keep direct dredging costs close to the first estimate.
What to Do? Options Considered
With all that as background, the next slides present additional dimensions of the problem. The photo below shows the confluence of Spring Creek (left) and the West Fork (right) at US59. Sediment is now coming downriver from the West Fork after flowing through a mile-long sand pit.
The photo above helps explain the sediment build up at the River Grove Boat Launch: 5+ feet in places at the mouth of the Diversion Ditch and an average of 1.5 feet across the entire dredging area.
The dredging-company representative said he’d never seen anything like it in that short of a period.
And a retired Army Corps representative who helped lead the Emergency West Fork Dredging Project after Harvey said, “After we completed our survey of the area, we predicted sedimentation will be a perpetual problem at this location.”
Hydrologists call the photo below a “difference map. The colors represent the difference between the first and second surveys. It shows the build up between mid-February and mid-May outside the River Grove Boat Launch. The red, orange and yellow areas show the greatest build up. Blue and green show the lesser areas.
Note the options listed on the left. They set up a discussion of the pros and cons for each alternative.
Pros and Cons of Options
For the sake of brevity, I’ll let you read the pros and cons from the visuals in the following slides. They are fairly self explanatory.
In the first option, KSA would seek help with dredging costs. This became a possibility when the Governor and President issued disaster declarations for this area last month. Suddenly, federal money became available for debris removal and flood mitigation. The sand deposits might qualify under either.
Council Members Fred Flickinger and Twila Carter have already reviewed the pre/post surveys and forwarded them to the City’s Chief Resilience Officer, Stephen Costello, for help with developing an application.
However, the outcome won’t be known for a while. So, if that option fails, KSA could make the decision to dredge one more time using its own money. But if a hurricane should come along and fill the sand back in, then KSA would wipe out its capital asset reserves fund. Hence the emphasis on “ONE” below.
Another option the Parks Committee agreed to explore was asking the City to dredge. The City is strapped for cash right now, but if the City could get funds from FEMA to cover the removal, it might be possible. That’s because the City already has a dredge in the river for a separate project between Kings Point and FM1960.
If FEMA covered the sand deposited after the first survey, perhaps a cost-sharing arrangement could be worked out with the City for the rest.
After all, the City owns the lake and the lake is developing a sediment problem. The City also has responsibility for maintaining the outfalls of the ditches around the lake.
While discussing ways to reduce dredging costs, KSA’s low bidder suggested long-term ways to make periodic dredging more affordable and sustainable.
This is not an immediate answer to the problem, but could be considered as a follow-on option if one of the others becomes possible.
Example: the dredging company suggested building a jetty to deflect floodwaters out into the river instead of letting them curl into the gap between the islands.
They also suggested building low underwater rock walls that could catch sand scooting along the riverbed. This could trap sediment behind the walls. And that could help minimize the area needing dredging in the future. Hopefully, that could also make dredging more affordable and sustainable in the future.
However, the permitting and construction costs for those measures would be in addition to any dredging done now.
Some people on the parks committee felt the jetty might work in small floods, but not in larger ones like we just had.
KSA also considered an option to just close the boat dock. However, after discussion, a compromise became clear: just limit its use.
This would let families with smaller watercraft, such as canoes, kayaks and paddle boards, continue to use the facilities if they could portage over the developing sand bar. Large boats would have to seek other places to launch.
Next Steps and Timetable for Decision
The Parks Committee agreed that the options needed to be shared with HOAs and residents. Hopefully, after debate, public comment, and more exploration of the options, consensus may develop around one of the options. The community can then make a decision in the fall when people return from summer vacations about both short- and long-range plans for the River Grove boat launch.
Make Your Feelings Known
If you live in Kingwood, please share this post with friends and neighbors. And make sure you register your opinion with your homeowner association officers.
Even though most residents don’t use the boat launch, many people might like to have the option. And that option could affect home values. For instance, imagine if a potential buyer for your home someday owned a boat.
Posted by Bob Rehak on 6/7/2024
2474 Days since Hurricane Harvey
The thoughts expressed in this post represent opinions on matters of public concern and safety. They are protected by the First Amendment of the US Constitution and the Anti-SLAPP Statute of the Great State of Texas.
https://i0.wp.com/reduceflooding.com/wp-content/uploads/2024/06/KSA-Boat-Launch-Options-R3_Page_07.jpg?fit=1500%2C1125&ssl=111251500adminadmin2024-06-07 00:47:282024-06-07 09:40:58Future of River Grove Boat Launch Discussed at KSA Meeting
June 5, 2024 – The Triple PG sand mine trial, originally scheduled for 2020, has been rescheduled yet again for March 2025 – a five year delay and counting.
A new schedule shows the Texas Attorney General lawsuit against the Triple PG sand mine in Porter may go to a jury on March 24, 2025. Originally, the case was set for trial on June 22, 2020.
But a corporate shell game by the defendant created a series of delays while the AG tried to figure out who was on first.
Then they took two years off for COVID. Finally the judge scheduled a conference call to jumpstart the case in 2022.
Original Complaint
The Texas Attorney General (AG) sued the Triple PG sand mine in Porter on behalf of the Texas Commission on Environmental Quality in 2019. Two breaches in the mine’s dikes were allowing industrial wastewater to flush into White Oak and Caney Creeks, then into the headwaters of Lake Houston. The lake supplies drinking water for two million people.
But not much has happened since then. And the Triple PG sand mine trial just got postponed. Again. Without explanation.
New Scheduling Order
See the second amended agreed scheduling order in the Triple PG sand mine trial. Five years of delays on a case originally scheduled to go to trial in one year!
The Attorney General’s office did not respond to a request for explanation or comment.
Discovery is now supposed to end on December 20, 2024. And a jury trial will begin “on or after March 24, 2025.” Uh, oh! I don’t like that “or after” part.
While Everyone Delayed…
Along the way, those daredevils at the Triple PG have:
Those bullet points just scratch the surface. I’ve created more than 60 posts that feature the Triple PG mine.
All Charges Denied
Prabakar Guniganti, the cardiologist from Nacogdoches owns the mine through one of his shell companies. The Montgomery County Appraisal District shows that the Guniganti Children’s Trust Fund owns it now. Guniganti has denied all charges by the TCEQ and Attorney General.
Pipeline that wasn’t exposed, December 6, 2019Wastewaterat Triple PG mine, July 27, 2022.Guniganti has an ag/timber tax exemption on this gem.Trees killed by process wastewater on neighboring property, June 6, 2022Triple PG wastewater flowing unobstructed into Caney Creekand Lake Houston,September 2019
Posted by Bob Rehak on 6/5/24
2472 Days since Hurricane Harvey
The thoughts expressed in this post represent opinions on matters of public concern and safety. They are protected by the First Amendment of the US Constitution and the Anti-SLAPP Statute of the Great State of Texas.
https://i0.wp.com/reduceflooding.com/wp-content/uploads/2024/06/20190927-Helicopter9.27_106.jpg?fit=1100%2C733&ssl=17331100adminadmin2024-06-05 18:22:362024-06-05 18:28:29Triple PG Sand Mine Trial Delays Total 5 Years Now
6/4/24 – Rainfall in the upper part of the San Jacinto River (SJR) Basin during early May storms rivaled Hurricane Harvey totals there. And if you consider year-to-date rainfall (YTD) totals, the amount above normal equals two Harveys in places!
The comparisons with Harvey help put into perspective some extraordinary rainfall in a relatively small geographic area that affects a much larger area.
The comparisons help explain why many people in the Lake Houston Area felt the May flood was far out of proportion to the amount of rainfall received. The most extreme rains did not fall on downstream residents’ heads. For downstream residents, the rains fell unseen – 50 miles north.
Let’s look at data for Huntsville first. Even though the City itself technically sits just outside the San Jacinto River Basin, rainfall south and west of the City entered both the East and West Forks of the San Jacinto.
Harvey Week vs Week Around May Storm
During Hurricane Harvey week in 2017, the SJRA gage southwest of Huntsville received 20.46 inches of rain.
Area near Huntsville received 20.46 inches during Harvey week in 2017.
During the late April/early May storm of 2024, the same gage received just a little less – 18.4 inches.
Huntsville total for week starting April 28, 2024, fell about two inches short of Harvey.
This area got almost as much rain in one week this May as it did during Harvey. Now let’s look at year to date numbers.
Year-to-Date Totals Vs. Harvey
The National Weather Service maintains another gage in Huntsville which accounts for a slightly different total. But I’m using it for the YTD comparison because of the powerful graph. It illustrates how much rain the area recently received compared to normal. (We already know the Harvey total from the first bar graph above.)
From the brown line above, we can see that area normally gets 20 inches of rain through the end of May. This year it got 58.97 inches, almost triple the annual average at that point in the year.
The amount above normal (38.97 inches) is almost twice what the Huntsville area received during Harvey (20.46 inches)!
National Weather Service Data
So far this year, the upper river basin has received almost three Harveys worth of rain, or two above the normal YTD rainfall…for that latitude.
I should note here, that inland areas usually receive less rain than coastal areas during hurricanes. So if you’re saying, “Wait a minute! We received more than 20 inches of rain during Harvey,” you’re right. You also probably live south of Huntsville.
How to Compare Totals at Other Gages
Want to see what happened at a gage near you? HCFCD’s Flood Warning System lets you enter any date range using the historical feature. Just click on the “More Info” button associated with any gage. Or do it for the whole river basin to see the distribution of totals.
YTDrainfall distribution across upper SJR basin.
To quickly compare the distribution during Harvey, just change the dates to 8/25/17 and 8/29/17. It’s fun to explore. And it makes a fun learning experience for your kids. Teach them how to become “data detectives.” It could turn them into homeroom heroes.
Alternatively, you can compare Harris County gages during Harvey by consulting the tables at the end of HCFCD’s final Harvey report. It contains peak rainfall totals for all the gages above for time periods ranging from five minutes to four days.
There’s a point to all this data. We can draw several conclusions and recommendations from it:
Extreme rainfall in the northern tier of the river basin contributed to the flooding that many experienced 50 miles south.
Rainfall coming from the west and east was less intense and likely accounted for less damage downstream.
Heavy rains can fall outside of hurricane season. In fact, spring storms can exceed hurricane rainfall totals and rival hurricane intensity.
We need regional flood control. The people near Huntsville were not prepared for this event. Neither were people to the south protected.
Hurricane Harvey wasn’t a once-in-a-1,000 year rainfall. Pretending it was will jeopardize public safety. We need better building codes and drainage regulations in areas that haven’t already been updated since Harvey.
We also need updated flood maps that show current risk to help protect homebuyers. New floodplain surveys were conducted after Hurricane Harvey. But FEMA hasn’t yet released new risk maps based on those surveys. Many fast-growing areas in the region still base development decisions on data from the 1980s. That puts homebuyers at risk.
Flood Risk: A Shifting Target
Even as FEMA finalizes new flood-risk maps, understand that Mother Nature, sand mines, and insufficiently mitigated upstream developments are constantly changing the landscape through erosion and deposition.
The resulting blockages and reduction in conveyance may now contribute to increased flooding on smaller rains. Consider River Grove Park and the Kingwood Diversion Ditch. Both are now blocked by sand from upstream.
Kingwood Diversion Ditch where it passes through River Grove Park.Photo from 5/26.
It’s not as bad as it was after Harvey…yet. But up to five feet of sand was deposited in this area during the recent flood. So give it a few more floods.
As the City of Houston readies a $34 million dollar dredging program (that doesn’t even include River Grove), look what’s coming downstream to us.
Confluence of West Fork and Spring Creek near US59 bridge. West Fork, on right.
The West Fork snakes through 20 square miles of sand mines between US59 and I-45. And due to pit capture, the West Fork currently runs through a mile-long sand pit.
That raises one final recommendation: I wish the City could use its influence in Washington and Austin to have the EPA and TCEQ eliminate these blatant abuses.
In the meantime, the Kingwood Service Association will debate its own dredging program and the future of River Grove this Thursday night. To attend the online meeting, contact the KSA office at 281-358-5192 for a Zoom link.
Posted by Bob Rehak on June 4, 2024
2471 Days since Hurricane Harvey
The thoughts expressed in this post represent opinions on matters of public concern and safety. They are protected by the First Amendment of the US Constitution and the Anti-SLAPP Statute of the Great State of Texas.
https://i0.wp.com/reduceflooding.com/wp-content/uploads/2024/06/20240530-DJI_20240530161911_0905_D.jpg?fit=1100%2C619&ssl=16191100adminadmin2024-06-04 17:28:232024-06-04 21:28:42Top of SJR Basin Has Received Normal YTD Rainfall Plus a Harvey or Two
Hurricane season has started. For those new to the Gulf Coast and younger family members, here’s where to find authoritative hurricane information. Many of these sites are updated several times a day. They contain information that can help keep you and your family alive when severe weather threatens. So please share.
Most if not all forecasting agencies predict an above-average to well-above-average number of tropical storms and hurricanes for 2024. Harris County Meteorologist Jeff Lindner offers these tips for staying alert and ready. Here’s how to keep your eye on the tropics and factors that contribute to hurricanes.
National Hurricane Center
NOAA’s National Hurricane Center (NHC) offers the most up-to-date tropical storm and hurricane information. During the season, NHC updates its outlooks several times per day. They give you 2- and 7-day outlooks with the probability of tropical system formation and the most likely tracks for storms. The familiar cone graphics that show possible storm tracks will change this year to include watches, warnings, and impact areas, which can extend well outside of the cone.
Lindner reminds us that seasonal forecasts do not include storm tracks and landfalls. Steering currents in the atmosphere that guide storm tracks change from day to day and week to week. So don’t focus on the “numbers.” Instead prepare every year!
Contributing Factors
Several factors continue to support a lot of activity this year. They include:
Sea Surface Temperatures
The Atlantic, Caribbean Sea, and Gulf of Mexico continue to have well-above-normal sea surface temperatures. Recent high pressure systems have warmed the Gulf to near record levels for this time of year. With that said Gulf water temperatures can quickly change up and down. Overall, Atlantic basin water temperatures continue to run closer to middle summer than early June. Additionally, the Atlantic Ocean has a classic look to the above average waters that in the past have resulted in above average tropical activity. Check out seasonal anomalies (deviation from normal) at Current Operational SST Anomaly Charts – OSPO (noaa.gov).
Sea Surface Temperature anomalies as of 6/2/24.
El Niño/La Niña
El Niño (warm water in the Pacific from south America to south of Hawaii) continues to quickly fade. Cool water is starting to replace it. The Pacific will transition into La Nina toward mid- to late summer.
This tends to support Atlantic basin tropical development…especially in the Caribbean Sea. La Nina conditions help to reduce wind shear and create conditions more favorable for tropical storms and hurricane to not only develop but intensify. This NOAA presentation covers the transition and is dated 6/3/24.
Global long range models continue to show an active and wet Caribbean Sea and Gulf of Mexico in the June-September time period. They forecast much-above-average rainfall in the SW/W Caribbean Sea. This signal in 2020 coincided with several tropical storms and hurricanes moving from the Caribbean Sea into the Gulf of Mexico.
European Centre for Medium-Range Weather Forecasts (ECMWF)
ECMWF predicts below-average, sea-level pressures throughout portions of the tropical Atlantic and Caribbean Sea into at least the southern Gulf of Mexico. Lower pressures make it easier for tropical systems to form. See ECMWF | Charts.
Recent guidance from ECWMF and Colorado State University indicates enhanced potential for development in the Caribbean. Watch this in the upcoming season.
Storms that develop in the Caribbean tend to impact land areas more than storms that form off the coast of Africa. Storms that form off Africa tend to have at least some opportunity to turn northward over the open Atlantic Ocean prior to reaching the land areas in the western basin.
Local
As always…now is the time to prepare. Have plans of action in place should a tropical storm or hurricane approach the Texas coast this season. It all starts with accurate and timely hurricane information.
Should a tropical system threaten the Texas coast detailed impacts and forecasts can be found at the local National Weather Service Office webpage Houston/Galveston, TX (weather.gov).
The Links Page of ReduceFlooding contains links to these websites and dozens of others related to weather, preparedness, floodplains and releases from local lakes.
Please pass this information along to newcomers to the area and your family members.
Posted on 6/3/24 by Bob Rehak based on information from Jeff Lindner, Harris County Meteorologist
2470 Days since Hurricane Harvey
https://i0.wp.com/reduceflooding.com/wp-content/uploads/2019/08/Harvey-Peak-Intensity.jpg?fit=1500%2C843&ssl=18431500adminadmin2024-06-03 19:53:152024-06-03 19:53:16Where to Find Hurricane Information
Several years ago, Harris County Flood Control District (HCFCD) made a giant leap forward with real-time inundation mapping. You could log onto the Harris County Flood Warning System, click on “inundation map,” zoom into your neighborhood, and see how close floodwater was getting in “near real time.”
It was a radical advance over earlier system. But now we need another radical advance – predictive inundation mapping.
No one, as far as I can see, offers such a service. The National Weather Service predicts how high water will get at gages, but not between them where people live.
How Close Will the Floodwater Get…At My Location?
Buyers today have much more information at their fingertips than decades ago, but no one puts it all together.
One of the most useful websites during a flood is the National Weather Service Advanced Hydrologic Prediction Service. There, you can see how fast water is rising, where it will peak, when it will fall, and a hydrologic history of the event. (See layout below.)
From June 2 at 1:41PM for West Fork San Jacinto at US59
This is a huge advance over everything before it. But unfortunately, it only predicts flood heights at gages. Most people don’t know how their distance from a gage, elevation changes, and local topography will affect the peak at their home or business. Especially if they are new to a neighborhood, like the woman below.
Kingwood resident who moved here in January from a desert, then promptly flooded in May.
The mapping feature is a great enhancement compared to the NWS site in some ways. It shows the extent of flooding between gages.
But unfortunately, the Flood Warning System won’t tell you how close water will get at its peak.
So when you realize you need to get out, you may not have enough time to make thorough preparations.
Screen capture from Harris County Flood Warning System. It shows current flooding, but not peak flooding.
Trying to Integrate the Best of Both Approaches
Those with knowledge of prior floods may be able to translate gage readings upstream to their location downstream.
But almost 10% of the American population moves every year. So, five years after a hurricane hit an area, half of the people in a neighborhood would likely have little knowledge or memory of it.
More than real-time inundation mapping, we need predictive inundation mapping.
Legal Concerns over Bad Information
One official I talked to for this article feared such a system. What if the prediction were wrong? What if it implied someone would be safe and then they died while evacuating? Imagine the legal liability!
As a result, officials often err on the side of caution. They may issue orders to evacuate in much wider areas than necessary.
We saw that during the May flood this year. The county issued evacuation maps that showed the extent of flooding during Harvey. As a result, people may be less inclined to evacuate for the next storm, even if it is warranted.
In extreme cases, such over-reaction has resulted in harm. Those who have lived in the Houston area for 20 years or more may remember the disastrous mass evacuation during Hurricane Rita in 2005.
One hundred thirteen people died from Rita in Texas, 107 of which were associated with the evacuation of the Houston metropolitan area.
Need for Better Tools
A former HCFCD employee told me that HCFCD has been working on a predictive inundation mapping system for years. But, says the source, it’s incredibly complex and requires validation.
Validation involves confirming predictions against real-world storms. However, giant, widespread floods don’t just happen every year. And every storm is unique, as we saw in yesterday’s post about the early May storm. Some areas may get feet of rain, while others get inches.
You just can’t generalize. Every storm is unique. And referring to historical analog storms may fail for several reasons:
Massive developments, such as Colony Ridge, may have changed the hydrology of the watershed. Colony Ridge has grown 50% larger than Manhattan in just ten years.
Rainfall intensity may vary in storms, even if rainfall totals don’t.
Unequal rainfall distribution means that flood peaks may combine in different ways at different times.
Potential Ways to Handle Uncertainty
To help handle those contingencies, predictive inundation maps could have buffer zones showing degrees of uncertainty. For instance, “If you’re in Zone A, there’s a 100% chance you will flood. In Zone B, 50%. In Zone C, 25%, etc.”
Plus, the legislature could craft legal protections for agencies making such predictions based on the best available information and science.
We need a public debate. Perhaps an even better approach will emerge from the dialog.
That would be far preferable, in my opinion, to causing immense anxiety among millions.
Posted by Bob Rehak on 6/2/24
2469 Days since Hurricane Harvey
The thoughts expressed in this post represent opinions on matters of public concern and safety. They are protected by the First Amendment of the US Constitution and the Anti-SLAPP Statute of the Great State of Texas.
https://i0.wp.com/reduceflooding.com/wp-content/uploads/2024/05/20240510-RJR_3506.jpg?fit=1100%2C733&ssl=17331100adminadmin2024-06-02 17:49:082024-06-02 17:49:10The Next Step in Inundation Mapping
June 1, 2024 – On the first day of what experts predict will be a record-setting 2024 hurricane season, I thought it would be interesting to see how much rainfall we had in May and so far this year. How wet has 2024 been?
May 2024 rainfall caused the second highest release from Lake Conroe in the history of the San Jacinto River Authority. But whether May 2024 will go into the records books depends on where you live.
Huntsville smashed its record high precipitation total for the month and year to date (YTD).
Conroe also set a record for May, but its YTD total fell slightly behind the record set in 1935.
Bush and Galveston came close to their record high totals for May and YTD.
At all four reporting stations that I sampled, YTD rainfall was well above normal.
However, the National Weather Service showed dramatic differences between locations.
More Than 5X Difference Across Region
According to the National Weather Service, Huntsville had the rainiest May since record keeping began – 24.7 inches. That brought Huntsville’s total for the first five months to 58.97 inches – about 10 inches higher than the average rainfall for an entire year.
58.97 inches is also almost triple the normal year-to-date (YTD) total for Huntsville.
At other reporting stations during the last 25 years:
Conroe had its rainiest May – 12.58 inches
Bush Intercontinental Airport had the fifth rainiest May – 11.05 inches.
Galveston had its fourth rainiest May. But it was only 4.39 inches.
Huntsville received more than five times the rainfall in Galveston during May. That shows how high the rainfall was in the northern part of the San Jacinto River Basin.*
These statistics demonstrate three things:
May was very wet.
2024 has been very wet so far.
Rainfall across the region has varied dramatically.
Conroe, Bush Intercontinental and Galveston did not set records for May. But their monthly totals all fell into the top quintile of the last 25 years. And that helped bring YTD totals to near record highs at all sampled locations.
See graphs below arranged geographically from north to south. The boxes superimposed over the graphs show the years of the record high and low totals for YTD precipitation as well as the precipitation in a normal year.
Note: Record year at this location so green and blue lines coincide.
2024 YTD Totals Compared to Normal YTD
When comparing normal YTD totals to 2024’s, we can see that:
Huntsville is 193% ahead of normal.
Conroe is 73% ahead.
Bush Intercontinental Airport is 51% ahead.
Galveston is 58% ahead.
2X Differences in Lake Houston Area
Rainfall can vary dramatically within much smaller areas than the Houston region. Take the Lake Houston Area, for instance. According to the Harris County Flood Warning System, during May 2024, the gage at:
US59 and the West Fork received 13.76 inches of rainfall.
West Lake Houston Parkway and the West Fork received 16.56 inches.
FM1960 bridge across Lake Houston received 12.28 inches.
Slightly upstream, FM1485 and the East Fork received 22.8 inches.
That meant an almost 2X difference between the high at FM1485 and the low at FM1960. The two locations are just nine miles apart.
80% of Annual Rainfall in First 5 Months
I live just two miles from the gage at the West Lake Houston Parkway bridge and recorded an almost identical amount of rainfall in my back yard.
My gage received 16.45 inches for the month. That was just a tenth of an inch less than the Harris County Flood Control gage at WLHP.
And that brought my total rainfall for the year to 40.12 inches. Our average annual rainfall is only 50 inches. So we’re already at 80% of a normal year. I received a third of an average year in the month of May alone.
So, it was a very wet month for the Rehak household, even though we received 8 inches less than Huntsville’s mind-boggling 24 inches.
Today, another hurricane season starts. All early predictions indicate it could be a record-setting season. So keep those umbrellas handy.
Posted by Bob Rehak on June 1, 2024
2468 days since Hurricane Harvey
* Footnote: The NWS charts below all show monthly rainfall for the last 25 years. I have sorted the years in descending order based on May rainfall totals and highlighted where 2024 ranks for each reporting station.
https://i0.wp.com/reduceflooding.com/wp-content/uploads/2024/05/4PM-Front.jpg?fit=1100%2C632&ssl=16321100adminadmin2024-06-01 11:57:332024-06-01 12:18:36How Wet Has 2024 Been?