If you missed the Texas Water Development Board (TWDB) state flood planning seminar in Tomball, you still have three more options to participate.
Example of Q&A at Tomball Meeting
TWDB Planning Process
The Texas Water Development Board (TWDB) will offer two webinars to discuss and solicit input on state flood planning and financing programs established during the last legislative session.
The TWDB will launch the presentation screen approximately five minutes before the start of each webinar. Questions and comments will be addressed live during each webinar; you may email your questions and comments to FloodWebinar@twdb.texas.gov throughout the presentations.
The last in-person meeting will be held on Friday, August 23rd at Houston City Hall.
Houston City Hall
Council Chamber,
2nd floor
901 Bagby St.
Houston, TX 77002
9:30-11:30 a.m.
The complete meeting schedule may be viewed on the TWDB website.
If you ever wanted to influence the way $800 million is spent, here’s your chance.
Posted by Bob Rehak on 8/16/2019
717 Days since Hurricane Harvey
https://i0.wp.com/reduceflooding.com/wp-content/uploads/2019/08/Types-of-Proj_01-copy.jpg?fit=1460%2C684&ssl=16841460adminadmin2019-08-16 22:48:162019-08-16 22:48:27TWDB to Host Two State Flood Plan Webinars on August 19
Just three months ago, on May 7th, water poured out of Woodridge Village and into the streets and homes of Elm Grove. More than 200 flooded homeowners are suing the developer and contractor for negligence. Meanwhile, before the case has even gone to trial, contractors are pouring concrete. Let’s hope the drainage plans do the job. Because they are literally setting those plans in “stone,” so to speak. Here’s what’s happening north of the MoCo border.
Woodridge plans 5 detention ponds, 3 in the northern and 2 in the southern section. The two in the southern section are now at total depth. However, excavation still has not started on the three northern ponds, despite ideal construction weather.
Elevation Raised Compared to Elm Grove
Looking east along the southern border with the detention pond S1 out of frame on the left and the culvert that leads to Taylor Gully in the upper left. Village Springs in Elm Grove can be seen through the trees on the right.
The new development has been built up about four feet above Elm Grove and Woodland Hills Villages. It gives the hood a split level look.
At the top of that hill, along the perimeter, the contractor bulldozed a v-shaped notch. That’s called a backslope interceptor swale. The swale or depression collects rainwater that would otherwise drain straight into detention ponds. In theory it provides additional storage for rainwater. It also reduces the potential for erosion along the banks of the pond. That’s because water collects in the swale and drains through a pipe into the detention pond.
S2 detention pond above Village Springs in Elm Grove. Photo courtesy of Jeff Miller. Miller says that the pond looks 3 feet below the mouth to the culvert on Taylor Gully. So it will hold water constantly.
Detention Pond S1 Now Lined with Concrete
Contractors have also begun lining detention pond S1 with concrete. That should reduce erosion. It will also accelerate runoff.
Woodridge Village Detention Pond S1 which is north of Woodland Hills Village. The ditch has reached its total depth and is now being lined with concrete.Photo courtesy of Jeff Miller.
Roads Going In
Contractors have also poured the main road through the southern part of the subdivision. It is within feet of connecting to Woodland Hills Drive on one end. It will soon cross Taylor Gulley about in the middle of the subdivision and eventually connect to the northern half of the development.
Looking east from Woodland Hills in front of Kingwood Park High School.
It looks like this from the opposite direction.
Looking southwest toward Woodland Hills from the northern side of the southern section of Woodridge. Main road in distance will soon cross Taylor Gully.Photo courtesy of Jeff Miller.
In Other News
Jeff Miller says it appears that the contractor has nuked all of the trees separating the northern and souther section. Says Jeff Miller who supplied many of these pictures, “As Peter Townseand of the Who sang, ‘I can see for miles and miles.’” The song now applies to the view from Elm Grove looking north. There’s little to see but brush piles.
Nothing but brush piles for miles and miles. Photo courtesy of Jeff Miller
Risky Business: No More Detention Ponds Heading into Peak Hurricane Season
Contractors have not yet started excavation on any of the detention ponds for the northern section: N1, N2, or N3. That’s a risky strategy given months of ideal construction weather behind us and the peak of hurricane season fast approaching. Those Perry Homes subsidiaries are definitely connoisseurs of edge work.
Peak of hurricane season is less than a month away. This is when things usually start to heat up.
Posted by Bob Rehak on 8/16/2019with thanks to Jeff Miller
717 Days since Hurricane Harvey
https://i0.wp.com/reduceflooding.com/wp-content/uploads/2019/08/Road_01.jpg?fit=1500%2C1000&ssl=110001500adminadmin2019-08-16 21:39:402019-08-17 21:01:03Woodridge Village Plans Being Set in Concrete…Before Case Goes to Trial
Harris County Flood Control District (HCFCD) needs your help. Hold your fire. Someone is shooting up their equipment on Taylor Gully. The District is performing a clean-out of the ditch to restore its conveyance so people won’t flood again, as they did on May 7th.
Harris County Flood Control is now trying to restore the conveyance of Taylor Gully, but vandals are shooting up their equipment.
Slowing Down the Job, Raising Expenses
Sandra Musgrove, Director of HCFCD’s Infrastructure Division, reports that at night, Flood Control places metal sheets over the windows of their equipment to prevent vandalism. But now, instead of throwing rocks, vandals have taken their game to the next level. They’re SHOOTING out the windows.
Harris County Flood Control asked me to communicate that this adds to the cost of jobs and slows them down. That increases people’s flood risk. Plus it’s just not neighborly. So please help.
Lock Up Your Guns, Report Suspicious Activity
Keep your eyes and ears open for suspicious activity. Chances are, anyone you see packing on Taylor Gully late at night is hunting for heavy equipment. However, I have noticed some Texas-sized bullfrogs now and then in Taylor Gully.
Seriously. It’s a crime to discharge a firearm within the City. And if caught, something like this could ruin a young person’s life.
So lock up your guns. Hold your fire. And please report suspicious activity to 911.
Posted by Bob Rehak on 8/15/2019
716 Days since Hurricane Harvey
https://i0.wp.com/reduceflooding.com/wp-content/uploads/2019/08/Backhoe.jpg?fit=1500%2C840&ssl=18401500adminadmin2019-08-14 21:37:242019-08-14 21:37:33“Hold Your Fire! It’s Flood Control!”
Great news! Tuesday, Harris County Commissioners Court approved a $700,000 contract with Neel-Schaffer, Inc. for a Kingwood Area drainage study. The engineering firm will identify flooding sources in the Kingwood area and develop potential solutions.
Data shows that portions of Kingwood have potential for significant offsite flows from Montgomery County as well as ponding locations due to inadequate overland flow conveyance. Said another way, new upstream development is taxing Kingwood’s drainage infrastructure. This project will help ensure that a 100-year flood plain remains a 100-year flood plain, and doesn’t turn into a 10-, 20- or 50-year flood plain.
Area of investigation outlined in red.
Drainage Study Details Outlined in Contract
The contract for the work indicates its scope and details. Discussion of those begins in Appendix A on page 14. The goal of the study is to identify mitigation strategies that will return 12.4 miles of existing drainage ditches and streams within Kingwood to their originally designed 100-year service levels.
Harris County Flood Control District (HCFCD) entered into an interlocal agreement with TIRZ 10 (Kingwood) to perform a drainage study of five main Kingwood streams to their confluence with the West and East Forks of the San Jacinto River. The five include:
G103-33-00 Bens Branch – From Rocky Woods Drive to WFSR (Length= 3.1 miles)
G103-33-01 – From North park Drive to the confluence with Bens Branch (Length= 1.3 miles)
G103-38-00 (Kingwood Diversion Ditch)- From Harris County Boundary to WFSR (Length = 4.0 miles)
G103-80-01 (Green Tree Ditch) – From Woodland View Dr to the EFSR (Length= 1.5 miles)
G103-80-03.1B (Taylor Gully)- From Harris County Boundary to Whiteoak Creek (Length= 2.5 miles)
Flood Control Will Fund Remainder of Streams/Ditches
In addition to the interlocal agreement, Harris County Flood Control District will also study all remaining streams and ditches within the Kingwood Area. Those include another 19.9 miles:
G103-33-00 Bens Branch – From Harris County Boundary to Rocky Woods Drive (Length = 2.2 miles)
G103-33-02 – From North park Drive to the confluence with Bens Branch (Length= 0.2 miles)
G103-33-03 – From Hidden Pines Dr. to the confluence with Bens Branch (Length= 0.1 miles)
G103-33-04 – From W Lake Houston Pkway to the confluence with Bens Branch (Length= 1.2 miles)
G103-36-00 (Bear Branch)- From Woodland Hills Dr. to WFSR (Length= 2.7 miles)
G103-36-01 – From Woods Estates Dr. to the confluence with Bear Branch (Length= 0.8 miles)
G103-36-02 – From Woodland Hills Dr. to the confluence with Bear Branch (Length = 0.9 miles)
G103-36-02.1- From Kingwood Dr. to the confluence with Bear Branch (Length= 0.4 miles)\
G103-36-03- From Royal Circle Dr. to the confluence with Bear Branch (Length= 0.4 miles)
G103-38-01- From Laurel Springs Ln. to the confluence with Kingwood Diversion Ditch (Length= 1.3 miles)
G103-38-01.1- From Red Oak Terrace Ct. to the confluence with Kingwood Diversion Ditch (Length = 0.4 miles)
G103-38-02- From Harris County Line to the confluence with Kingwood Diversion Ditch (Length= 0.7 miles)
G103-39-00- From Palmetto Ln. to the WFSR (Length= 1.3 miles)
G103-41-00 (Sand Branch) – From Sycamore Creek Dr. to the WFSR (Length= 2.0 miles)
G103-41-01- From Elk Creek Dr. to the confluence with Sand Branch (Length= 0.8 miles)
G103-45-00- From Trail Tree Ln. to the WFSR (Length= 0.4 miles)
G103-46-00- From Forest Cove Dr. to the WFSR (Length = 1.0 miles)
G103-46-01- From Sweet Gum Ln. to the confluence with G103-46-00 (Length= 0.7 miles)
G103-80-01.1- From Autumn Sage Ln. to the confluence with Green Tree Ditch (Length= 0.3 miles)
G103-80-03.1A (Mills Branch) – From Same Way to Whiteoak Creek (Length = 1.5 miles)
G103-80-04 (Blackland Gully) – From Maple Knob Ct. to the EFSR (Length = 0.6 miles)
The scope of work includes several stakeholder meetings with TIRZ 10, homeowner associations, and the community at large. Their purpose: to increase public awareness and understanding of the magnitude of the watershed problems, their complexities and the cost of solutions.
Drainage Study Data Acquisition Phase
The contractor will start by collecting all available information and data including:
Construction plans
Previous drainage studies
HCFCD historical flooding data
High Water Marks
Watershed Masterplan data
FEMA Repetitive Loss properties
Flooding reports
LiDAR DEM data
Aerial maps
HCFCD watershed maps
Hydrologic and hydraulic models
City of Houston GIMS data
Any other pertinent technical data in the development of this scope of services.
Field Reconnaissance Phase
Neel-Schaffer engineers will then conduct field reconnaissance of the existing drainage systems, outfalls, and drainage patterns within the project area. That will include field measurements of 27 bridge crossings, 32 culvert crossings, 16 pedestrian bridge crossings and 6 drop structures to be incorporated in the development of hydraulic models.
During this stage, Neel-Schaffer will also measure high water marks; update floodplains; and analyze stream performance and capacity to illustrate flooding issues to the County, TIRZ and community.
Identification of Structural and Non-Structural Mitigation Alternatives
The Engineer will determine structural and non-structural improvement alternatives to bring all streams back up to the 100-year level-of-service.
Neel-Schaffer will perform this analysis using full conveyance at peak flows. Engineers will identify the major constraints that affect the available solutions for each stream.
They will then consider both structural and non-structural alternatives for mitigation.
Structural Alternatives
Structural alternatives include:
Improved drainage channels including widening, deepening, and/or lining for increased conveyance capacity.
Watershed diversions using enclosed conduits (following existing roadway alignments or other public ROW).
New regional or sub-regional detention basins and modification of existing detention basins including inlet and/or outlet structures.
Enhanced conveyance using selectective clearing and re-shaping of natural channels.
Enhanced flood storage in natural and park areas using small-scale berms and grading.
Non-Structural Alternatives
Non-Structural Alternatives include:
Property buy-outs.
Coordinated ROW dedications for future improved channels and regional detention basins.
Regional detention fees for new development.
Drainage Study Will Consider Detention Ponds
This contract includes identifying detention needs, identifying potential locations, and developing schematic layouts of the detention ponds. It also includes:
Proposed Right of Way acquisition
Preliminary Cost Estimates
A project priority and implementation plan
It is not clear at this point how long this project will take.
This post is dedicated to Barbara Hillburn, the president of the Kingwood Lakes HOA, who fought long and hard to get a project like this started. Thank you, Barbara!
Posted by Bob Rehak on 8/14/2019 with thanks to Barbara Hillburnand Precinct 4 Commissioner Jack Cagle
715 Days since Hurricane Harvey
https://i0.wp.com/reduceflooding.com/wp-content/uploads/2019/08/Kingwood-Drainage-Study-Area.jpg?fit=1366%2C1088&ssl=110881366adminadmin2019-08-14 15:55:322019-08-14 15:55:43Harris County Commissioners Approve $700,000 Kingwood Area Drainage Study
The Army Corps has released a new summary of its progress on dredging the mouth bar. The report indicates that Great Lakes, the contractor is now 70% complete. They have dredged 350,000 out of 500,000 cubic yards.
Great Lakes started dredging the mouth bar on June 25th, 2019, as part of a $17,085,861 extension of the original contract (FEMA mission assignment SWD-30).
Current area of operation is the blue area on the far right. Sediment removed from that area is being pumped 10 miles back upstream to Placement Area #2, a sand mine near Kingwood College, on the far left.
Between the start of mouth bar dredging and August 12, Great Lakes dredged an average of 6,363 cubic yards per day. If they can keep that pace up, they should be done by approximately Labor Day – three months ahead of schedule. That’s HALF the predicted time.
Remainder of Project Still Not Decided
What comes next? That still has not been finalized. City, County and State officials have been meeting in the background to determine that. The Army Corps still has not accepted or rejected Berry Madden’s property as a third placement area. And the $30 million appropriated by the State for mouth bar dredging won’t even become available until September 1st.
RD Kissling and Tim Garfield, two local geologists who first brought the mouth bar issue to the public’s attention, estimate that 500,000 cubic yards is about one-fourth of the total sediment that must be removed to fully restore conveyance of the West Fork.
How Shallow is It?
The Corps has not yet released (or even developed) plans for mouth bar dredging. We do know the volume they intend to remove, and the general area they intend to remove it from. However, they have refused to divulge how much of a dent their efforts will make in solving the problem.
This photo of a Kings River resident wading across the river shows how shallow it is near the orange channel marker.This resident says boats “beach” behind his property almost every day.Note: Deeper pockets may exist, especially near dredging equipment. The risk of drowning is real. Do not let children attempt this.Photo taken Sunday, August 10, 2019.The resident made it almost to the channel marker without getting his shorts wet.Shot taken with 6X telephoto lens.The lake/river within this area averages two to three feet deep. 500,000 cubic yards would lower the average level by another three feet as this calculation shows.
Problem With Stopping after 500,000 CY
The problem with stopping after the Corps finishes its 500,000 cubic yards is that the river behind this area is much deeper. Where the Corps stopped dredging just past Kings Harbor, the river is now 25-30 feet deep. And places are even deeper according to fishermen. That means water coming downriver will be forced to flow uphill in this area. That will force it to slow down and more sediment will rapidly drop out of suspension. Some experts have suggested dredging a deep channel through this area to help restore full conveyance of the river. However, the Army Corps intends to stop after 500,000 cubic yards.
“Q: What is USACE Galveston District’s plan for the rest of the mouth bar?“
“A. There is no additional work planned for the mouth bar. The current plan for the modification addressing material near the mouth bar can be found on the placemat. USACE Galveston District has no authority to conduct any additional work in the West Fork of the San Jacinto River or Lake Houston. The San Jacinto River is not an authorized federal waterway, the Corps of Engineers dredging operations are currently limited to dredging Harvey-related material. The ongoing work under the contract modification will remove the remainder of material attributable directly to Hurricane Harvey. The sedimentation from recurring annual flows are not within USACE Galveston District’s mission assignment from FEMA. Water flows on the West Fork of San Jacinto River were restored to pre-Harvey levels in December 2018.”
“Q: Who can the public contact for additional concerns with the maintenance of the San Jacinto River?“
“A. For concerns with the maintenance of the San Jacinto River, please contact Harris County Flood Control District, the San Jacinto River Authority and the City of Houston.”
Punt!
Meanwhile the City is still arguing with the Corps about how they arrived at 500,000 cubic yards. More on that later. I have obtained the Corps’ estimate through a FOIA request to the City of Houston. It raises many questions that I am still trying to sort through. More on that later.
Posted by Bob Rehak on August 14, 2019
715 Days since Hurricane Harvey
https://i0.wp.com/reduceflooding.com/wp-content/uploads/2019/08/MouthBar_01_01.jpg?fit=1500%2C1000&ssl=110001500adminadmin2019-08-14 13:46:172019-08-14 13:46:28Army Corps Now 70% Complete with Its Portion of Mouth Bar Dredging
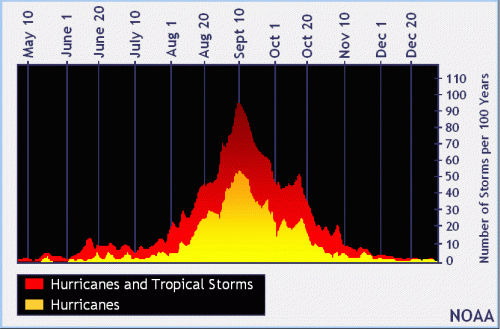
With two weeks left in August and no active tropical systems in the Atlantic, Caribbean or Gulf, I started wondering how this hurricane season stacked up against the average. Through the end of July, we had two named storms in the Atlantic. We also had six in the eastern Pacific, none of which threatened land. That makes a total of eight. How does that compare to a normal year? Below is a chart from NOAA. It shows the averages for tropical storms and hurricanes by month.
167 Years of Hurricane History
The first thing I noticed when looking at this table is the clear jump between July and August. Through the end of July, the averages for both tropical storms and hurricanes are below 1. That means the chances of NOT seeing one are greater than seeing one. However, August is where things heat up (pardon the pun). Your chances of seeing one are far greater than NOT seeing one.
Through the end of July, we exceeded the averages for The Atlantic and Pacific combined. But if you look at just the Atlantic, we are about on average, as the chart below shows.
Cumulative Number of Storms Per 100 Years in The Atlantic Basin.Source: NOAA
The official hurricane season for the Atlantic Basin (the Atlantic Ocean, the Caribbean Sea, and the Gulf of Mexico) is from 1 June to 30 November. As seen in the graph above, the peak of the season is from mid-August (now) to late October.
Current Outlook Clear
However, THIS August has been quiet so far. Season-to-date, we are still slightly above average, but the month of August is unusually quiet. We’re halfway through the month without any named storms in the Atlantic and NOAA expects no activity for the next five days.
Regardless, if you are the type to play the odds, so far this year Texans have to consider themselves lucky.
Lake Levels As of Mid-August
With that in mind, let’s look at what the San Jacinto River Authority (SJRA) and Coastal Water Authority are doing with Lake Conroe and Lake Houston to reduce the chance of flooding in the event of a major storm.
Both lakes are down about a foot. This creates an extra buffer against flooding by creating extra capacity within the lake.
The SJRA began lowering Lake Conroe on August 1. Normal level is 201 feet above sea level. As of this morning, Lake Conroe was at 200.03 feet and the SJRA continued to release water at a minuscule rate of 150 cubic feet per second. Evaporation is doing most of the work. The SJRA says the lake can lose up to an inch per day through evaporation in hot, dry weather, which we have had plenty of lately. You can always check the current lake level at SJRA.net.
The Coastal Water Authority is maintaining Lake Houston at 41.57 feet above sea level. Normal level is 42.38 feet. A recent lowering for dam maintenance combined with lack of recent rain and evaporation have all contributed to the current level.
The SJRA will continue releasing water at a rate that brings Lake Conroe down to 199 feet by September 1. The SJRA will maintain that level through the end of September, then allow the lake to gradually refill with rainwater until it reaches the normal level of 201 feet.
https://i0.wp.com/reduceflooding.com/wp-content/uploads/2019/08/peakofseason_sm.gif?fit=500%2C329&ssl=1329500adminadmin2019-08-14 11:52:152019-08-14 11:57:27How This Hurricane Season Compares to Others So Far
Jill Boullion, Executive Director of the Bayou Land Conservancy, sent me a link to a fascinating article called Fossil Rivers. It’s about the evolution of the Mississippi River. Even if you’re not a student of geology, the maps are worth looking at as pieces of abstract art. As the author of the article, Geoff Manaugh says, “Colors coil round other colors; abstract shapes knot, circle, and extend like Christmas gift ribbons. This is geology as a subset of Abstract Expressionism: rocky loops of the Earth’s surface in the hands of Jackson Pollock.”
Army Corps map showing the geomorphology of the Lower Mississippi over time.
Says Manaugh, “Indeed, what the Army Corps of Engineers discovered while producing these maps is that the Mississippi River has changed channel completely – and it has done this hundreds, even thousands, of times. In fact, the river’s endless self-alteration still occurs, even as you read these words: the Mississippi, like all rivers, is migratory, destined to wander across the landscape for as long as it continues to flow. It drifts back and forth – sometimes a few feet, sometimes a mile – walled in by its own silt and debris; until there is change: a natural levee fails, or a storm surge bursts into another watercourse nearby, and then the river finds itself on a quick new route to the sea.”
Powerful reminders to respect the rivers! Give them room. Those who build too close will lose in the long run. People can moan about property rights all they want. But in the end, Mother Nature always wins.
Posted by Bob Rehak on 8/13/2019
714 Days since Hurricane Harvey
https://i0.wp.com/reduceflooding.com/wp-content/uploads/2019/08/766866365_e2000a2d1c_o.jpg?fit=475%2C575&ssl=1575475adminadmin2019-08-13 23:32:112019-08-14 09:16:31Respect the Rivers
Bill King, Candidate for Mayor of Houston, will visit Kingwood tomorrow to answer residents’ questions about how he would address flooding and other issues. King will offer a sneak peak of his flood plan that will be released next Monday or Tuesday.
King (left) with Elm Grove resident Abel Vera after the May 7th flood.
Flood mitigation solutions by their very nature are political. I will be posting similar announcements for other candidates as events arise. My hope is that everyone in Houston can meet the candidates personally, get to know them, and learn about their ideas to reduce flooding. A massive turnout in November will help secure our future.
Posted by Bob Rehak on 8/13/2019
713 Days since Hurricane Harvey
https://i0.wp.com/reduceflooding.com/wp-content/uploads/2019/05/ElmGroveFlood_01_15.jpg?fit=1500%2C1000&ssl=110001500adminadmin2019-08-12 18:08:362019-08-12 18:10:23Meet Bill King, Candidate for Mayor of Houston, At Los Cucos Tuesday at 6PM
Good news! Jason Krahn with the Harris County Flood Control District (HCFCD) has announced that the District will start restoring conveyance capacity to Bens Branch beginning August 19, 2019. The contractor’s official start date is that Monday, but it will take several days to move equipment to the site. “So the citizens of Kingwood should see the contractor on site by midweek,” said Krahn.
Project Scope
The project will include removing and disposing of approximately 76,285 cubic yards of sediment accumulations. This will be a multi-step process. First, HCFCD’s contractor, Solid Bridge Construction, LLC, must remove the soil from the creek. Then the soil must drain and dry. Finally, dump trucks will remove the excavated material.
Scope of Ben’s Branch project outlined in red.
The project will extend from Kingwood Drive south to the library, then east under West Lake Houston Parkway to the YMCA, then south again to an area adjacent to Deerwood Country Club. It will stop 1800 feet from the river where the the ditch flattens out into a natural stream, near the Y canoe launch.
Sedimentation restricting the conveyance of Ben’s Branch between the library and West Lake Houston Parkway. Looking west from bridge.
The east/west portion of this project above became severely silted during Harvey, contributing to flooding in Kingwood Greens, Town Center, the Enclave, Kingwood Village Estates. A dozen seniors died in Kingwood Village Estates from injuries sustained during the evacuation or from the stress of seeing their homes destroyed when they returned.
City Portion of Ditch South of Y Not Included
The City of Houston reports that it has not yet secured maintenance easements from adjoining property owners south of the Y.
Most of the ditch adjoins property owned by the Clubs of Kingwood. Here’s what it looks like from a drone. My thanks to Jim Zura of Zura Productions for his time and expertise in securing this footage.
Ben’s Branch out of the YMCA looking toward Lake Houston. HCFCD project does NOT include this portion which is controlled by the City of Houston. Note the dredge operation in the distance at the end of this video. Drone footage courtesy of Jim Zura, Zura Productions.
For more information about the project, consult the Kingwood pages of the HCFCD website. The project ID is # G103-33-00-X004 – Bens Branch Conveyance Restoration.
Krahn expects the lower portion of Ben’s Branch to take 9 months. Construction equipment will access the work area via the established access points from Kingwood Drive, Bens View, West Lake Houston Parkway, and Denmere. The contractor will use heavy construction equipment such as dump trucks, excavators and bulldozers. Motorists should stay on high alert for truck traffic when passing near construction access points.
Expect Extra Traffic
The average commercial dump truck holds ten to fourteen cubic yards. So this project could result in 5,500 to more than 7,000 round-trips before its over.
Posted by Bob Rehak on 8/12/2019 with video from Jim Zura of Zura Productions
713 Days since Hurricane Harvey
https://i0.wp.com/reduceflooding.com/wp-content/uploads/2019/08/g103-33-00-map_web.jpg?fit=600%2C413&ssl=1413600adminadmin2019-08-12 16:44:492019-08-12 16:59:52Ben’s Branch Clean Out to Begin August 19
Harris County Flood Control District (HCFCD) is nearing completion of its project to clean out Taylor Gully. The project will restore the ditch’s conveyance through Elm Grove. The ditch had become clogged due, in large part, to erosion from months of clear-cutting and construction activities immediately upstream in the new Woodridge Village development.
After the Flood, but Before the Clean-Out
Below, several shots taken shortly after the May 7th flood.
Erosion on Woodridge Village property. Concrete culvert in background is entrance to Taylor Gully on Harris County side of Montgomery County Line. Another shot of erosion leading to culvert, visible in upper right.Looking north at same culvert from Harris County side of county line.Flood debris carried downstream into Elm Grove portion of Taylor GullyShot taken at end of May looking south along Taylor Gully. Three weeks after the May 7 flood.
After the Clean-Out
What a difference some backhoes and bulldozers can make!
Looking south from same area today, but from opposite side of Gully. Photo courtesy of Jeff Miller.
Re-contoured backslope swale with new culvert. Photo courtesy of Jeff Miller.
Newly cleared Taylor Gulley Backslope Swale near the homes that flooded in North Kingwood Forest. Photo courtesy of Jeff Miller.
Brand new backslope interceptor structure and improved swale by HCFCD located just north of Creek Manor where it dead ends into Taylor Gulley.Photo courtesy of Jeff Miller.
These backslope interceptor swales reduce erosion, provide additional floodwater storage, and help prevent floodwaters from impacting structures.
One Month From Statistical Peak of Hurricane Season
Today is one month from the peak of hurricane season – September 11. Hundreds of people in Elm Grove and North Kingwood Forest will have an additional margin of safety thanks to HCFCD’s Taylor Gully project. Despite three months of near-perfect construction weather, Perry Homes’ contractors have only completed two of five planned detention ponds upstream. More on the construction status of Woodridge Village in my next post.
Posted by Bob Rehak on 8/11/2019 with photography from Jeff Miller
712 Days since Hurricane Harvey and 3 months + 4 days since the May 7th flood
https://i0.wp.com/reduceflooding.com/wp-content/uploads/2019/08/IMG_2731.jpeg?fit=640%2C480&ssl=1480640adminadmin2019-08-11 07:44:082019-08-11 07:44:20Before-After Shots of Clean-Out: HCFCD Restoring Conveyance of Taylor Gully In Elm Grove