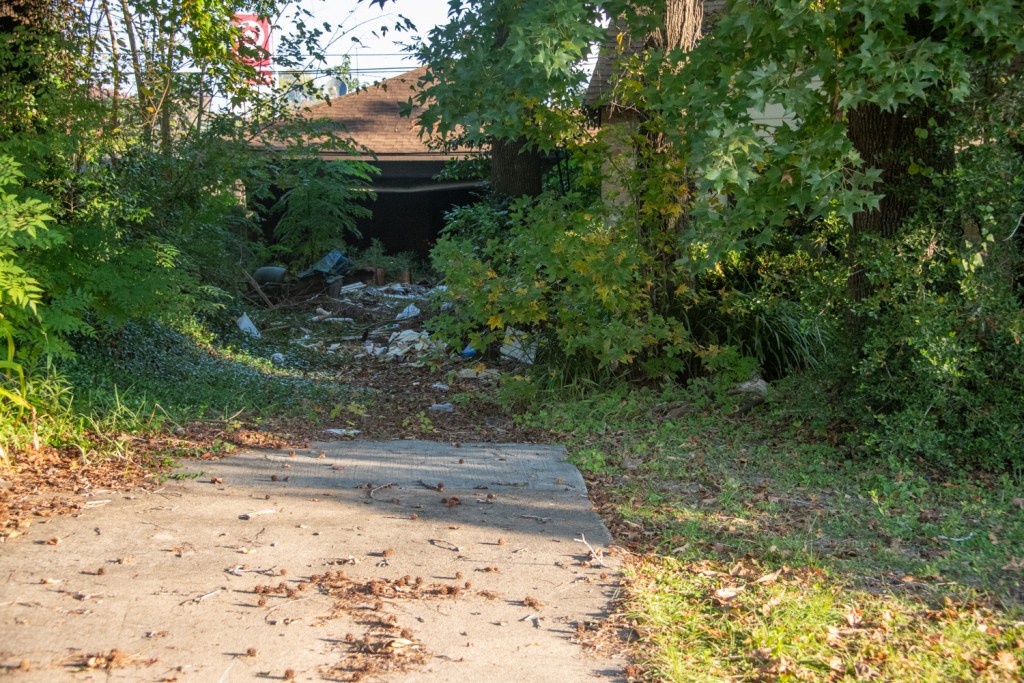
Harris County Flood Control District (HCFCD) reports that it is buying out a handful of low-lying homes on Fieldtree Drive in Northshire where the City of Humble could soon build a pocket park. The area flooded badly during Harvey. Northshire lies between Deerbrook Mall and the San Jacinto River west of the hotels that line US59.
A drive down Fieldtree reveals several homes at the bottom of the hill that have already been demolished and others that look abandoned.
Area under discussion on 8.30.17 after peak of Hurricane Harvey.
HCFCD Buyouts in Progress
Several lots that head down the hill on Fieldtree have been cleared.Several others appear as though owners have abandoned themand would make good candidates for buyouts.
Impact of Flooded and Abandoned Homes on Tax Base
For the most part, modest but well-maintained homes line Fieldtree. The street slopes sharply and all of the vacant or abandoned lots lie at or near the bottom of a hill near Glencreek Drive.
Harris County Appraisal District shows that home market values took a beating in this neighborhood after Harvey. Appraisals for homes at the top of the hill went down about 15%. The farther down the hill you went, the farther down appraisals went – from 20% to 30% or more. The house above even lost a whopping 65% of its market value.
Currently, the abandoned homes seem to be dragging down values of homes that didn’t flood on higher ground. However…
Pocket Park Could Help Reverse Downward Trend
According to Humble City Manager Jason Stuebe, Humble is considering building a pocket park once buyouts in this area are complete.
https://i0.wp.com/reduceflooding.com/wp-content/uploads/2019/11/Northshire.jpg?fit=1500%2C1104&ssl=111041500adminadmin2019-11-24 21:26:422019-11-24 21:26:51HCFCD Buying Out Low-Lying Homes In Northshire Near Deerbrook Mall; Humble Considering Pocket Park
Lake Conroe residents organizing opposition to the SJRA’s lake lowering policy have found it easy to “blame” Kingwood for their inconvenience. Kingwood is an affluent community in another county. But the Lake Conroe people ignore more than 1100 homes between Kingwood and Lake Conroe in Montgomery County (MoCo) that also flooded.
The lake lowering reduces downstream flood risk by creating extra capacity within the lake during months with the heaviest rainfall. It is a temporary measure until flood mitigation measures can be completed that help protect the Lake Houston Area.
ESRI GIS Database Shows Counts of Damaged MoCo Homes
ESRI operates a Montgomery County GIS (geographic information system) database called the Harvey Story Map. (Unfortunately, this may not work with all versions of Safari. Try Chrome if you have trouble.) Clicking on Section 12 shows the location of homes that flooded during Harvey in MoCo.
As you to zoom, you can see counts of flooded structures within the visible area. For instance, around Lake Conroe, 292 homes flooded during Harvey. The map below shows the location of those homes.
292 homes flooded on Lake Conroe during Harvey. Lake lowering gives them an extra buffer against flooding.
If you continue to zoom in, you can even see how individual houses fared in other floods as well.
Below are six screen captures that give you a sampling of what you will find. This first area is just below the Lake Conroe dam where 30 homes flooded during Harvey.
Below is River Plantation, just downstream from I-45. Put your water wings on, Bucko! The count here: 527.
Here are four more subdivisions farther downstream.
The West Fork subdivisions shown above had 1159 flooded structures during Harvey. But more homes flooded than in these six images. For starters, there were the 298 homes around Lake Conroe itself.
I’m not sure how many people have waterfront lots on Lake Conroe, but is their boating convenience really worth risking the possibility of flooding even a subset of these homes again?
Posted by Bob Rehak on 11/24/2019
817 Days after Hurricane Harvey
https://i0.wp.com/reduceflooding.com/wp-content/uploads/2019/11/image-1.png?fit=1911%2C917&ssl=19171911adminadmin2019-11-23 21:29:122020-01-17 08:56:39Lake Conroe Lowering Benefits MoCo Residents, Too; More Than 1100 Flooded on West Fork During Harvey
At its February 2020 board meeting, the San Jacinto River Authority (SJRA) Board of Directors will consider NOT lowering Lake Conroe during the spring and fall rainy seasons. Lake Conroe residents have mobilized to protest the lowering which they see as a costly inconvenience. They have started spreading disinformation about the policy. The SJRA Board has reportedly already received more than a hundred letters protesting the policy.
Reason for Lowering and Current Status
The strategy of lowering Lake Conroe on a seasonal basis reduces the risk of flooding downstream residents by increasing the capacity of Lake Conroe to store water. The SJRA Board of Directors and City of Houston review the strategy annually. Both entities own water rights in Lake Conroe.
The gates at Lake Conroe can release water at up too 150,000 CFS but are currently releasing 0 CFS. Lake lowering ended October 1st.
After Hurricane Harvey, the State of Texas called on the SJRA Board of Directors and the City of Houston to participate in regional strategies to reduce flooding. The temporary lowering of Lake Conroe has reduced releases from Lake Conroe during storms. SJRA and downstream communities realize and understand the inconvenience that the strategy can create around Lake Conroe. We ask for understanding for the duration of this temporary mitigation strategy.
Seasonal Lake-Lowering FAQs
Who Decides?
The City of Houston and the SJRA collaborate on the decision to temporarily lower Lake Conroe for flood mitigation because it effects the water supply of both entities.
How Long Will It Continue?
Seasonal lake lowering is a temporary flood mitigation initiative to increase the capacity of Lake Conroe to catch rainfall and runoff while long-term and short-term flood mitigation strategies are implemented downstream.
The motion made by the SJRA Board states that the intent of the proposal is to provide “a near-term, temporary flood mitigation benefit while more permanent mitigation strategies, such as dredging of the lower West Fork, are completed.”
When Does It Happen?
Seasonal lake lowering occurs twice annually – first in April/May and second in August/September.
How Much is It Lowered and for How Long?
In the spring, releases begin on April 1st. SJRA gradually reduces the level of Lake Conroe to 200’ mean feet above sea level (msl)—one foot below the normal Lake Conroe pool level of 201’ msl. Starting on June 1st, SJRA recaptures flows to restore normal lake elevation to 201’ msl.
In the fall, releases begin on August 1st. SJRA gradually reduces the level of Lake Conroe with a goal of reaching 200’ msl by August 15th. After August 15th, gradual lowering continues with a goal of reaching (and maintaining) 199’ msl—two feet below normal pool—by August 31st. Starting October 1st, SJRA begins to capture flows to restore normal lake elevation to 201’ msl.
What If The Lake Is Already Down?
If the lake level has already dropped to the target elevation due to evaporation, no releases are made.
What if It Rains While the Lake is Already Lowered?
If a storm enters the forecast while seasonal releases are being made to lower the lake level, releases are stopped and the river is allowed to drain out until rainfall is out of the forecast.
Is There Science Behind This Policy?
Two engineering reports by Frees & Nichols from early 2018 show the benefits in terms of flood mitigation and the potential negative impacts to water supply. These reports as well as additional information about seasonal lowering can be found at: https://www.sjra.net/floodmanagement/.
Has it worked? Is there real value in terms of flood mitigation?
Yes. Looking at recent rainfall events, seasonal lowering resulted in both lower peak lake levels during storms and lower release rates from the dam.
Seasonal lowering also reduces the peak Lake Conroe level during storms, which reduces negative impacts around the lake such as damage to docks and other personal property. During Harvey, several hundred homes around Lake Conroe flooded.
Data for the May event, and for all releases from the dam, including those during seasonal lowering periods, can be monitored by visiting SJRA’s home page at www.sjra.net. Click on the “Lake Operations and Rainfall Dashboard.”
What is the cost of the release?
Lake Conroe was built as a water supply reservoir in the 1970s through a partnership between SJRA and the City of Houston. Two thirds of the water in Lake Conroe belongs to the City of Houston and one third to SJRA. The City of Houston can call for the release of its water at any time, and water supply reservoirs are built to fluctuate as demands or operational needs dictate.
Releases such as those made for dam repairs and seasonal lowering are not charged to any particular customer, therefore it is not possible to assign a value to the water released. In addition, temporary, non-customer releases do not reduce long-term water supplies, therefore they are not considered lost revenue.
To be considered as lost revenue, releases would have to happen at a time when the SJRA could not meet demand with water from Lake Conroe. But that has not happened.
And most important, if the water supply in Lake Conroe were ever threatened, say from drought, the SJRA would not be releasing water anyway. The lake level would already be far below the target level, making a release unnecessary.
Is This a Permanent Program?
No. Seasonal lowering is a temporary flood mitigation strategy that must be reconsidered each year by the City of Houston and the SJRA Board of Directors while more permanent mitigation strategies, such as dredging of the lower West Fork, are completed.
https://i0.wp.com/reduceflooding.com/wp-content/uploads/2019/04/LC-Dam-e1719277556742.jpg?fit=1200%2C549&ssl=15491200adminadmin2019-11-23 11:00:262020-01-17 08:57:17FAQs About Lowering Lake Conroe to Reduce Downstream Flood Risk
Efforts have started already to lobby against the seasonal lowering of Lake Conroe again next year. They seem to be organized and inspired by the Lake Conroe Association again. I understand that the lowering inconveniences some Lake Conroe residents, especially boaters who live in areas like Grand Harbor where the water depth is shallow to start with. However, the inconvenience pales in comparison to the damages suffered in the Lake Houston Area. The lowering helps provide a buffer against downstream flooding during the wettest months of the year. The SJRA will vote on whether to extend the lowering policy at its February board meeting.
A Campaign of Misinformation
The Lake Conroe Association and its proxies are deliberately spreading falsehoods to rile up people against the lowering. The same misinformation contained in the Lake Conroe Association presentation on their news page, is repeated in the website Stop Draining Lake Conroe (https://www.stopdraininglakeconroe.com) and the Grand Harbor YouTube video below.
Lake Conroe homes are being damaged by the lake lowering. Really? How does that work? Is it the same as 250,000 CFS coming through your living room? That’s what happened to 81 townhomes in Forest Cove. See below.
One of 81 empty townhomes on the West Fork in Forest Cove after the Lake Conroe release. Note the bulk-heading. Harris County Flood Control demolished this building earlier this month. Many others remain, affecting property values around them.
Lake lowering is damaging bulk-heading around Lake Conroe. How does that work? Does evaporation destroy the bulk-heading? See the bulk-heading along the West Fork above.
Downstream residents are trying to turn this into a permanent plan. Please tell me who. I’m not aware of any organized effort. The plan has always been to reconsider the lowering every year until flood mitigation measures such as dredging were complete.
SJRA is throwing away $5.33 million of water revenue. It would only be throwing away the revenue if it could sell the water. But there’s no unfilled demand due to water shortages in the lake. And the water replenishes itself as rain falls from the sky.
Water level of Lake Conroe is at 198. That’s an exaggeration to rile up the people in Grand Harbor, who normally only have four feet of water. The lake level is normally at 201′ and currently at 198.82′. That’s 198 and ten inches. So those Grand Harbor people have half their normal water, not one quarter. Current release rate is 0.
Lake Conroe only provided 15% of the water that flooded Kingwood. Lake Conroe only affects the West Fork, but the statistic includes the East Fork. During Harvey, West Fork flooding caused the vast majority of the damage. The Lake Conroe release comprised ONE-THIRD of the water coming down the West Fork through the highly populated Humble/Kingwood corridor where virtually 100% of the businesses are located. Lake Conroe released 80,000 CFS of the 240,00 CFS coming down the West Fork. So the 15% statistic is extremely misleading.
Video Makes Many of Same False Claims And Some More
The video includes many of the same false claims and a few new ones. Let me focus on the new ones.
The video states or implies that:
Describing the lowering as Seasonal rather than Temporary implies we are trying to make it Permanent. I’m not sure how you get from either of those words to “permanent.” This is a logical fallacy. It’s a falsehood designed to inspire fear.
Recent events show that Lake Conroe is being unfairly blamed for downstream flooding. Kingwood still flooded during Imelda “even though we didn’t release anything” during Imelda. Please! The vast majority of all Kingwood flooding during Imelda was street flooding or related to Woodridge Village. Some homes did flood on the East Fork, but I can’t believe any of those residents would blame it on a fictional release from Lake Conroe that wasn’t coming down the West Fork.
There was an “organized effort” in Kingwood to send an unspecified number of “letters” to the SJRA board thanking them for not releasing during Imelda. So what is it? Are we allegedly blaming you for flooding us during Imelda or thanking you for not flooding us? Show me the letters. I’m not aware of any such organized effort. See the comment above.
Kingwood is trying to increase the lowering to 3 feet and Kingwood is winning that fight by a large margin.I’m aware of no effort to increase the lowering and no fight that we’re winning by a large margin.
Wading birds that require shallow areas are being destroyed. Duh! They’re saying birds need shallow water, but they want to make the lake deeper. So if water depth had something to do with destroying birds, who would be destroying them?
Boating Vs. Flooding
Let’s face it. The big reason Lake Conroe residents don’t want to see their lake lowered is that it makes boating more difficult. No argument there.
But the big reason Lake Houston area residents want more dredging is not boating. It’s to reduce flood risk. The mouth bar forms a sediment dam behind the dam that reduces the conveyance of the river through the heavily populated Humble/Kingwood corridor. And until it’s dredged, we need the help of Lake Conroe residents. The lake lowering strategy gives us the only effective way to mitigate flooding for now.
After the Army Corps removed 500,000 cubic yards of sediment from the West Fork mouth bar, Imelda promptly redeposited much of it. Here’s what it looked like after Imelda.
700 yards south of the mouth bar, RD Kissling, a kayaker, photographed himself in 1 foot of water AFTER the Corps finished dredgingand after Imelda.
Compare These West Fork Damages
Tens of thousands living north of the West Fork who used I-69 for commuting experienced massive traffic jams every day for 11 months while TxDoT reconstructed the southbound lanes after Harvey.Photo taken 6/19/2018.
We are certainly sensitive to Lake Conroe lifestyle considerations. But during Harvey, Lake Houston Area damages on the West Fork alone included:
After a year, only half the residents who flooded throughout the Lake Houston Area were fully back in their homes. Some still aren’t. Many homes have been abandoned.
City of Houston estimated Lake Houston area damages to be in the billions.
City of Houston estimated this area’s tax revenues were reduced 20-30 percent.
TIRZ funded expansion of Northpark Drive had to be delayed several years.
Humble ISD documented $97.5 million in damages to its facilities.
Kingwood High School closed for 7 months; 4000 students had to be bused to another high school more than an hour away the entire time.
More on this in future posts. Lake Houston Area residents need to gear up to fight the falsehoods and ensure that Lake Conroe seasonal lowering policy remains in place for another year.
Harvey knocked out the Union Pacific Railroad bridge over the San Jacinto River near I-69 and disrupted rail traffic for months. Photo taken 9/14/2017.
Posted by Bob Rehak on 11/22/2019
815 Days since Hurricane Harvey
https://i0.wp.com/reduceflooding.com/wp-content/uploads/2018/05/I69Damage-e1775243525276.jpg?fit=1100%2C733&ssl=17331100adminadmin2019-11-22 19:00:202020-01-23 11:28:50Lake Conroe Association Fighting Seasonal Lowering in Advance of SJRA Vote to Reconsider Policy
Note: This is the third in a five part series about What Went Wrong in Woodridge Village that may have contributed to flooding in Elm Grove and North Kingwood Forest.It focuses on Detention Ponds.
Section 7 of the Montgomery County Drainage Criteria Manual cautions, “The introduction of impervious cover and improved runoff conveyance serves in many cases to increase flood peaks quite dramatically over those for existing conditions.” And that’s exactly what happened in Elm Grove and North Kingwood Forest in May and September of this year. Two subdivisions that had never flooded before were inundated with several feet of water from Woodridge Village.
Perry Homes failed to observe numerous regulations in the Drainage Criteria Manual including provisions for:
Erosion control measures such as pond linings, revegetation, backslope swales
Maintenance roads
Increases in downstream flooding
Geotechnical reports for detention ponds
Drainage of detention ponds
Critically, they also failed to construct all the detention ponds they promised.
Less than a Quarter of Detention Ponds Built
When listing factors that contributed to the flooding, the absence of several promised detention ponds should rank near the top.
Before the September flood, contractors substantially completed a second detention pond (S2) that added another 16% of promised detention capacity.
Since then, no work has been done on additional excavation to protect against flooding.
While clearcutting ALL of the land, Perry Homes installed only PART of the detention.
According to LJA Engineering, Perry Homes was supposed to develop the project in two phases and clearcut only 30 acres in the northern section during Phase 1. However, something changed. Instead, Perry Homes clearcut the entire northern section. And they still haven’t excavated any of the three detention ponds there.
By May 2019, only S1 was substantially complete. By September, S2 was also substantially complete, but overwhelmed.
Had Perry Homes installed all the detention that it promised, the site should have detained a foot of rainfall. But it didn’t. When Imelda came along, it was like trying to pour 100 gallons of water into a 23 gallon jug. Water spilled out of the development into adjacent streets and homes.
Erosion Control Measures Missing for Detention Ponds
“The erosion potential for a detention basin is similar to that of an open channel. For this reason the same types of erosion protection are necessary, including the use of backslope swales and drainage systems (as outlined In SECTION 6), proper revegetation and pond surface lining where necessary. Proper protection must especially be provided at pipe outfalls into the facility, pond outlet structures and overflow spillways where excessive turbulence and velocities will cause erosion.” (See page page 123 of pdf, numbered 113 in doc.)
Revegetation?
Not much grass in S1 (right of the road) or the area that drains into it.All aerial photos below taken on 11/4/2019.Not much grass on the slopes of S2 either, although Perry Homes did make an ineffective attempt to hydromulch the south (right) border.
No Protection for Overflow Spillway
Perry Homes quality! This spillway from Taylor Gully (right) was supposed to have a grass lining, but still does not.Picture taken 11/4/2019.As of 11/21/19 work still had not started on the lining.Perry Homes has done virtually no work on this pond for three months.However, they did start lining the channel on the right today.
Backslope Interceptor Swales?
The northern edge of the S2 pond has no backslope interceptor swale. As a consequence, water from Taylor Gully at the top of this frame flows over the edge of the pond and erodes it. This may not be a sustainable solution. In the long run, the Gully could erode its way into the pond from the north (top of the frame).
Maintenance Road Missing at Critical Point
Section 7.2.8 talks about Maintenance of Detention Facilities. It states, “A 30-foot wide access and maintenance easement shall be provided around the entire detention pond.” The most critical place in the entire chain of detention ponds, the final outflow culvert into Taylor Gully, has no room for a maintenance road. That’s because when they installed the required backslope interceptor swale, the only place left for it was the maintenance road. That’s planning for you!
S2 has no maintenance easement or road at final outfall into Taylor Gully.The backslope interceptor swale takes up that space.
No Increase in Downstream Flood Levels Allowed
Section 7.3 talks about DETENTION DESIGN PROCEDURES. It clearly lays out the design goal when it says…
No increase in downstream flow rates or flood levels will be allowed.
Further down in this section, the regulations state: “The maximum 100-year water surface elevation in all detention facilities shall be a minimum of 1 foot below the minimum top of bank elevation of the basin.”
No Geotechnical Report for Groundwater Level at Pond Sites
Section 7.5 discusses GEOTECHNICAL INVESTIGATIONS. It says, “Before initiating final design of a detention pond, a detailed soils investigation by a geotechnical engineer should be undertaken.” Regulations state that the ground water investigation must be “at the proposed site.” Montgomery County has no record of such an investigation or report.
A company called Terracon prepared a Preliminary Geotechnical Report for Perry that addressed issues pertaining to utilities, road pavement and residential foundations. But it makes no mention of detention ponds.
The company took four widely spaced borings around the perimeter of the site that managed to miss all the detention pond locations. Significantly, they missed all the wetlands, too.
Page 17 of Terracon Report. Red lines added to improve visibility of locations.
MoCo Claims It Has No Further Geotechnical Reports
If Perry Homes did additional investigations into ground water on this site, Montgomery County says it doesn’t have them.
If no further investigations were conducted, this could be a fatal flaw affecting the economics of the entire development. Note the presence of standing water in the photo below.
S2 Pond (left), Taylor Gully (center), and area where N3 pond will go (right) all have standing water that will reduce their rated capacity.
The presence of standing water reduces the rated capacity of detention ponds and channels. Only the area above the standing water counts as capacity. Regulations say that these ponds should drain completely (see below).
Thus, S2 likely has lost a third of its designed capacity. N3, when eventually built, could fare worse. Note how close the water is to the surface in the small pond on the right.
If you can’t go deep to get your detention pond capacity, you have to go wide. And that will mean fewer homesites than the 896 they planned. This site might not even make economic sense for building homes.
Problems with Homes Built Over Wetlands
The presence of wetlands in the northern section, which the Terracon report never mentions, would also significantly reduce the site’s suitability for building homes.
This article describes the problems with homes built on wetlands. The title: “Caution: Building in a Wetland Can Be Hazardous to Your House.” A biologist for the US Fish and Wildlife service who investigated filled wetlands in Pennsylvania warned: “Build your house in a wetland, and you’ve got a hobby for the rest of your life. You will be fighting that water forever.” He discusses cracked foundations and also warns, “When wetlands are filled, the water that made them wet has to go somewhere. … the water likely is leaking into formerly dry homes of downstream property owners.”
I’m sure Perry Homes would divulge the presence of former wetlands to the future buyers of homes on this site. It’s the only ethical thing to do and Kathy Perry Britton, CEO, has standards to maintain.
Incomplete Drainage of Detention Ponds
Section 7.6 of the Drainage Criteria Manual addresses GENERAL REQUIREMENTS FOR DETENTION POND CONSTRUCTION. It states: “A pilot channel shall be provided in detention facilities to insure that proper and complete drainage of the storage facility will occur.” (Emphasis added.)
Complete drainage will likely never occur in S2 and N3 because of the high water table.
To excavate S2 to the required design depth, contractors had to continuously pump water out of it as they worked. It still retains water to this day.
Photo by Jeff Miller on June 2, three days after contractors started digging to the final depth.No surface linings were ever added to this portion of the pond per Section 7.2.7 of the MoCo Drainage Criteria Manual.Photo taken on June 3 shows contractors were pumping water out of pond as they continued excavating.
The new statistics would require 40% more capacity to ensure downstream safety.
Where Does Perry Homes Go from here?
After ignoring regulations, hundreds of homes flooded. And they will flood again. Owning this site is like hanging a millstone around one’s neck. It could drown the entire company in perpetual litigation and debt.
Future Posts in this series will look at:
Contradictions in Perry Homes’ Plans
The Dirt on Perry Homes’ Soil Test
The Floodplain that Wasn’t
Posted by Bob Rehak on 11/21/2019 with help from Jeff Miller
814 Days since Hurricane Harvey and 63 since Imelda
The thoughts expressed in this post represent opinions on matters of public concern and safety. They are protected by the First Amendment of the US Constitution and the Anti-SLAPP Statute of the Great State of Texas.
https://i0.wp.com/reduceflooding.com/wp-content/uploads/2019/11/RJR_4350-2.jpg?fit=1500%2C1089&ssl=110891500adminadmin2019-11-21 17:48:092019-11-21 18:26:13What Went Wrong, Part III: Perry Homes’ Woodridge Village Detention Pond Catastrophe
Dr. Charlie Campbell, a master of functional medicine, jogs 22 miles a week in East End Park. He tries to time his jogs so that he arrives at Otter Point every morning for moments like this.
Sunrise at Otter Point by Dr. Charles Campbell. Used with permission.
If that won’t make you feel good, you’re a spiritual crustacean.
Years ago, I remember meeting a man meditating at Otter Point almost every day. I asked him what he found in it. He told me his story. The man was on chemo, fighting cancer. He said that the natural beauty gave him sustenance and the will to keep on fighting.
East End Park does that for many people in many different ways. Especially Otter Point. Whether you’re a cancer survivor or a flood survivor. If you’re not familiar with the park and the place, you should be. They are rare ecological gems inside the fourth largest city in the country. And something worth fighting FOR.
As a postscript to this story, Dr. Campbell sent me another picture taken this morning.
Photo by Dr. Charles Campbell, used with permission.
If you want to get your kids interested in physics, ask them why sunrises and sunsets are red. Here’s the answer.
Posted by Bob Rehak on 11/21/2019, with thanks to Dr. Campbell and Mother Nature
814 Days since Hurricane Harvey and 63 since Imelda
https://i0.wp.com/reduceflooding.com/wp-content/uploads/2019/11/IMG_1341.jpeg?fit=1599%2C1199&ssl=111991599adminadmin2019-11-20 22:03:132019-11-21 10:45:09A Moment of Tranquil Splendor at Otter Point
On May 7th and September 19th, sediment-laden runoff from Perry Homes’ Woodridge Village development in Montgomery County flooded the streets and homes of Elm Grove Village and North Kingwood Forest. On September 26, the City of Houston wrote a cease and desist letter to Perry Homes, its subsidiaries and contractors. The letter alleged that runoff damaged the City’s sewer system and residents’ homes. It demanded that Perry Homes’ proxies stop sending sediment into the City.
After Imelda, Abel Versa had to grab his car to avoid slipping in ankle-deep sediment on Village Springs. The sediment came from Woodridge Village right behind him.
Sediment Control Measures Not Followed in Subdivision Rules and Regs
If Perry Homes and its contractors had followed all the construction regulations affecting drainage, the flooding of Elm Grove would not have happened and the letter would not have been necessary. So what went wrong? I previously reviewed the sediment control measures in the Montgomery County Subdivision Rules and Regulations. Perry Homes received seven strikes. Among the worst apparent violations:
They clearcut 268 acres when the rules say no more than 10.
They are supposed to plant temporary vegetation but haven’t.
They were supposed to make provisions for increased runoff during construction, but didn’t.
The southern section of Woodridge Village has been cleared, filled and graded since last summer. Grass could have reduced the runoff during Imelda.Photo taken on 11/4/2019.The northern section has also been mostly cleared for months, though workers are still removing piles of dead trees. This shows the area where they filled wetlands.Because no detention exist for the northern section, runoff from 188 acres is supposed to funnel through a 3′ pipe. That’s not working well in heavy rains.You can see how much loose sediment is exposed to floodwaters.
More Regulations in Drainage Criteria Manual Not Followed
Perry Homes also overlooked many provisions in the Montgomery County Drainage Criteria Manual. Twenty-two of the 175 pages also discuss erosion and sediment control (see Section 6 starting on page 85). Among the more serious omissions:
Channel Slopes Severely Eroding
Section 6.2.1 on Grass Establishment states that: “A good grass cover must be established on all areas within the right-of-way (except the channel bottom) disturbed by channel improvements or by any type of construction. An adequate grass stand on the banks helps stabilize the channel and minimize erosion caused by overbank flow and high velocities in the channel. Establishing a good grass cover requires preparing the seedbed, seeding properly. keeping the seed in place, fertilizing, and watering regularly.
The LJA Engineering report never mentions erosion or sediment control by those words. However, it does mention grass-lined and concrete-lined channels and spillways. Only one problem. The channels are not grass lined and most of the areas designated for concrete lining have yet to be lined.
The banks of detention ponds should be lined with grass. They are not. As a result, sediment is slumping to the bottom of the ponds where it is carried downstream by floodwaters.This closeup shows how severe the erosion is.
Channel Turns Not Protected
Section 6.2.3 on Minimum Erosion Protection Requirements for Bends specifies that bends in drainage ditches must be protected from erosion by grass, rip-rap, or concrete. The material depends on the radius of the curve, the type of soil, average water velocity and maximum water velocity.
Despite funneling 188 acres of sheet flow into Taylor Gulley, which narrows down into a 3-foot pipe, Perry Homes has done little to increase the channel capacity or detention for that area. Worse, the channel design which may have been adequate for forested wetlands, can no longer handle high volume overland sheet flow.
The most obvious needs are on the eastern side of the development. There, Taylor Gully makes a 120-degree turn, then two quick 90 degree turns and two 45-degree turns, all within two hundred yards. Getting dizzy? The floodwater turns 390 degrees in this area!
At each turn the banks take a beating. The full force of the floodwater slams against the far bank and erodes it.
Photo taken on 11/4/2019 along eastern boundary of the southern section of Woodridge Village. That’s North Kingwood Forest on the rightand Elm Grove on the bottom.Little wonder that this was the area hardest hit by floodingin May and September.Where the channel on the right narrows down into the black 3-foot pipe, contractors built an overflow channel into the detention pond on the left but still have not lined it with concrete. Note the severe erosion. Also note the erosion and sediment coming into the pond on the left just below the flow-constricting device in Taylor Gully. Clearly, there isn’t enough channel capacity to handle the volume of water. Photo taken on 11/4/2019, looking north.
Straight Drop Spillway Not Installed
Section 6.2.5.3 states that a straight-drop spillway should be installed in drainage channels to adjust channel gradients which are too steep for design conditions.
LJA specifies one between where detention pond N3 will be and the 120-degree turn shown above. However, neither the detention pond, nor the spillway have yet been installed. So water from the north comes barreling down the ditch on the right unchecked. The high velocity increases erosion. Here’s what it looked like after May 7th.
Same area shown above but from ground level and looking south toward Elm Grove.Rain did a lot of the excavating for Perry Homes. But unfortunately, the sediment wound up in flood victims’ homes and the City storm drains.
More Things Perry Homes Didn’t Do in the Montgomery County Drainage Manual
Contradictions in Perry Homes’ Plans
The Dirt on Perry Homes’ Soil Test
The Floodplain that Wasn’t
Posted by Bob Rehak on 11/20/2019 with help from Jeff Miller
813 Days since Hurricane Harvey and 62 since Imelda
The thoughts expressed in this post represent opinions on matters of public concern and safety. They are protected by the First Amendment of the US Constitution and the Anti-SLAPP Statute of the Great State of Texas.
https://i0.wp.com/reduceflooding.com/wp-content/uploads/2019/11/RJR_4881.jpg?fit=1500%2C1000&ssl=110001500adminadmin2019-11-20 15:48:182019-11-20 16:02:51What Went Wrong, Part II: Lack of Erosion and Sediment Control Worsen Elm Grove Flooding
On May 7th and September 19th, floodwater poured out of the 268 clearcut acres of the Woodridge Village development in Montgomery County. It poured into the streets and homes of people who lived in Kingwood’s Elm Grove Village and North Kingwood Forest. That should not have happened if everything had gone according to plan and by the book. This is the first in a series about what went wrong.
In it, LJA promised that PHASE 1 would only include 30 acres on the northern part of the site. But contractors clearcut the ENTIRE northern section instead. That was approximately 188 acres. Without installing any detention ponds there.
The 30-acre mention is buried in the middle of a long paragraph. Frankly I read it several times and never snapped to its significance until Jeff Miller, an Elm Grove activist, rubbed my nose in it.
And, by the way, the 30 acres should have had 12.1 acre feet of detention, according to the plan. (See bottom of page 2 of the letter.) That equals the triangular area in the bottom left of the northern section. But in the May flood, there was nothing there to detain the water. That triangle is actually owned by Montgomery County and was excavated in 2006. One flood expert suggested that the area was already counted as detention for some other area, so it really shouldn’t count for Woodridge.
Of the three Woodridge sections outlined below, Phase One was supposed to include 58 acres in the southern (middle) section and 30 in the northern. The northern section dwarfs the others.
Gone: Everything that Could Have Slowed Runoff
Gone were the trees, underbrush and wetlands to soak up and slow down runoff. Contractors cleared six times more than LJA Engineering planned. That was a game changer. Plus those 188 clearcut acres had the steepest grade on the property. And the drainage all funneled toward the homes that flooded. Oops! Or should I say, “Duh”?
Map of original drainage on site shows which way water funneled.
It might have been a good plan. But you have to follow the plan for it to work.
Things Perry Homes Didn’t Do in the Montgomery County Drainage Manual
The Dirt on Perry Homes’ Soil Test
The Floodplain that Wasn’t
Posted by Bob Rehak on 11/19/2019, with thanks to Jeff Miller
812 Days after Hurricane Harvey and 61 since Imelda
The thoughts expressed in this post represent opinions on matters of public concern and safety. They are protected by the First Amendment of the US Constitution and the Anti-SLAPP Statute of the Great State of Texas.
https://i0.wp.com/reduceflooding.com/wp-content/uploads/2019/11/RJR_4365.jpg?fit=1500%2C1000&ssl=110001500adminadmin2019-11-19 18:59:022019-11-20 15:13:50What Went Wrong: First in a Five Part Series about Woodridge Village and Elm Grove Flooding
At its November meeting, the Kingwood Service Association (KSA) Parks Committee voted to dredge the boardwalk and boat ramp areas of River Grove Park. The work, when done, will finally restore the park to full function.
Harvey Nearly Destroyed Park
Hurricane Harvey nearly destroyed River Grove Park. Thanks to KSA, the park has made a remarkable comeback. Harvey deposited sand five feet high in the parking lot. It left a wall of sand 12 feet high and a quarter mile long that blocked the drainage ditch that runs through the park and empties the western third of Kingwood. In the process, it also blocked the park’s boat ramp, only one on the West Fork. Finally, the storm deposited sand in the lagoon by the boardwalk and across the southern end of the soccer fields.
By the time the park is fully restored, repairs will have taken more than two and a half years.
Boat Ramp After Harvey
The Army Corps spent weeks opening up the drainage ditch that contains the boat ramp. Contractors dredged a 250-foot wide opening in the bar. Here’s how that area looked then and now from a satellite and helicopter.
Google Earth image from October 2017 shows the massive sand bar blocking the boat ramp and drainage ditch that empties the western third of Kingwood.How the sandbar looked from a helicopter two weeks after Harvey.
Sand Bar After Dredging
Image from 2/2019.Boats can now get through the bar, but the area immediately in front of the boat ramp is still filled with sediment.Photo taken October 2, 2019.
Even though boats can get by the sand bar now, they can’t get in and out of the water. Sediment remains around the ramp area and must be dredged. The Corps dredge was too big to maneuver in the tight space around the dock.
The Corps asked KSA not to open its boat docks in the name of safety while dredgers were still working the West Fork. Now, with dredging done and all the dredge pipe removed, KSA can work on reopening the dock.
Lagoon Also Filled with Sediment
The lagoon opposite the boardwalk filled with sediment during Harvey, too. Here’s what it looked like two weeks after Harvey.
The lagoon next to the boardwalk totally filled in with sand deposited by Hurricane Harvey. Photo also taken two weeks after Harvey.
The Association has already located a placement area for the spoils far from the river and any flood plain.
If permitted, removal of the sediment around the dock and boardwalk would begin in January.
Removal should take 6-8 weeks. Sediment will be placed on the parking lot to drain and dry. Then it will be trucked to the placement area in Humble.
The park could be fully functional again as early as March next year.
Public Soccer Fields Now Available
While working to prepare this project, KSA also restored the soccer fields which had been covered with sand several feet thick. All fields are now playable and KSA has designated two as public fields.
All in all, it’s been a remarkable comeback for a park that Harvey all but destroyed.
Posted by Bob Rehak on 11/19/2019, with grateful thanks to Dee Price and KSA
812 Days since Hurricane Harvey
https://i0.wp.com/reduceflooding.com/wp-content/uploads/2019/11/RJR_4052.jpg?fit=1500%2C1000&ssl=110001500adminadmin2019-11-18 22:11:042019-11-18 22:54:25KSA Parks Committee Votes to Dredge River Grove Park Boat Ramp and Boardwalk
In October, the Texas Commission on Environmental Quality (TCEQ) issued a notice of enforcement (NOE) to a Texas Concrete Plum Grove sand mine for discharging wastewater into the East Fork. During Imelda, the mine’s dikes breached in at least four separate places. The TCEQ also issued another NOE for failure to stabilize soil in the mine before letting its permit lapse.
No Activity at Plant for Months
TCEQ investigator Christian Eubanks says they saw no activity at the plant for two months before the investigation after Imelda. No one at Texas Concrete answered phone calls to discuss their intentions for the mine.
Citizen Complaint Leads to Investigation
When floodwaters swept through the mine, sediment and industrial wastewater washed into the East Fork. Shortly thereafter, Josh Alberson, a Kingwood resident, noticed a distinct difference in the color of water coming off Caney Creek and the East Fork while boating. His personal investigation led to the mine at 7530 FM 1010 Road, Cleveland in Liberty County. After seeing the breaches, he then filed a complaint with the TCEQ which conducted a formal investigation.
12 Allegations of Unauthorized Discharges in 4 Years, Then This One
Texas Concrete Sand and Gravel, Inc. has a troubled history at its Plum Grove location. TCEQ investigated the operation nine times in the last four years for 17 alleged violations. Twelve involved unauthorized discharge of industrial waste. Then came this investigation, adding to their home run count.
Previous alleged violations included failure to:
Prevent unauthorized discharge of industrial waste (7 investigations plus 5 complaints)
Renew registration
Document steps taken to address benchmark exceedances
Comply with record keeping and reporting requirements
Maintain compliance with permitted numeric effluent limitations
Sample at designated outfalls.
Four Breaches Photographed At Texas Concrete Plant
TCEQ investigators photographed four breaches in the 70-acre mine‘s dikes.Breach 1. This and all photos below were taken by Christian Eubanks of the TCEQ.Breach 2Breach 3Breach 4
Failure to Meet Final Stabilization Requirements
On October 1, 2019, the mine allowed its permit to lapse. A TCEQ overflight on that same day found that large portions of the plant consisted of exposed soil. However, before the mine can legally terminate its permit, it must stabilize soil on the property.
TCEQ defines final stabilization as: “All soil disturbing activities at the site have been completed and a uniform (e.g. evenly distributed, without large bare areas) perennial vegetative cover with a density of 70 percent (%) of the native background vegetative cover for the area has been established on all unpaved areas and areas not covered by permanent structures, or equivalent permanent stabilization measures (such as the use of riprap, gabions, or geotextiles) have been employed.”
TCEQ photo from flyover on 10/1/2019. Note exposed soil circled in red.
Stabilizing soil helps prevent erosion and water pollution. Pollution that could escape through breaches in the mine’s dikes and affect water quality all the way down to Lake Houston.
Need for Greater Setbacks of Mines from Rivers
Since Harvey, I have campaigned to increase the setback distance of mines from rivers to prevent this type of tragedy. Texas has no minimum setbacks. Most other states require at least 100 feet and Alaska requires 1000 feet.
Texas Concrete underscores the need to establish minimum setbacks that would keep dikes from breaching. Once the owners of this mine are gone, who will be there to repair the dikes after the next flood?
Kudos to Josh Alberson for having the curiosity to investigate a problem he saw and the tenacity to follow through. People like Josh make this community great.
Posted by Bob Rehak on 11/18/2019, with appreciation for Josh Albersonand the TCEQ
811 Days since Hurricane Harvey and 60 since Imelda
The thoughts expressed in this post represent opinions on matters of public concern and safety. They are protected by the First Amendment of the US Constitution and the Anti-SLAPP Statute of the Great State of Texas.
https://i0.wp.com/reduceflooding.com/wp-content/uploads/2019/11/Breach4.jpg?fit=1500%2C1128&ssl=111281500adminadmin2019-11-18 16:16:002019-11-18 16:55:11TCEQ Goes After Texas Concrete Mine With Four Breached Dikes, Unstabilized Soil and Lapsed Permit