Harris County Declared Federal Disaster Area in Wake of Imelda; State Taking Control of Disaster Mitigation Funding

On October 1st, Governor Greg Abbott sent a disaster-request letter to President Trump in response to the damage caused by Tropical Storm Imelda. The 31-page letter to President Trump lays out the case for Federal aid. It also includes an impressive catalog of storm-related damages.

The thirteen counties impacted by Tropical Storm Imelda (Imelda) are still recovering from previous disasters, including Hurricane Harvey. The population of the counties affected by Imelda exceeds 7.59 million people. That represents more than a quarter of the state’s population.

Six Counties Declared Disaster Area

Abbott requested a Presidential Disaster Declaration for the six counties in the Gulf Coast region that sustained severe flooding. Today, the President granted Governor Abbott’s request.

That means Individual Assistance for those in Chambers, Harris, Jefferson, Liberty, Montgomery, and Orange counties will now become available. The Governor’s press release states that “Individual Assistance includes up to $35,500 per household for damages sustained during the severe weather.”

“This means that even if people did not have flood insurance, they may receive financial aid and low-cost SBA loans,” said Kaaren Cambio, staff assistant for Congressman Dan Crenshaw.

GLO Designated to Lead Disaster Mitigation Efforts

In a separate statement, the Governor announced that Commissioner George P. Bush and the Texas General Land Office will lead the State’s comprehensive disaster mitigation program. Bush will direct more than $4 billion in U.S. Department of Housing and Urban Development (HUD) Community Development Block Grant for Mitigation (CDBG-MIT).

The program will prioritize large-scale, regional projects that increase the state’s resilience to disasters statewide, protect lives and mitigate against future hurricanes and other natural disasters. Bush says he will focus on projects that benefit the most Texans. That means “prioritizing regional partnerships to protect Texans from future storms.”

On August 23, 2019, HUD released mandatory rules for the use of more than $4.3 billion in funding for mitigation projects. They covered money appropriated by Congress on February 9, 2018. Before the GLO could begin drafting a state action plan, those rules had to be published in the Federal Register. The GLO has already begun drafting the plan. It should take approximately nine months or more to complete, at which time, the GLO can send it to HUD for approval.

In total, HUD allocated $4,383,085,000 in CDBG-MIT funds to Texas. Altogether, 140 Texas counties are eligible for some part of this allocation of funding for 2015, 2016, and 2017 (Hurricane Harvey) disasters.

ABC13 Says Choice of GLO Was Response to Slow Pace of Recovery

Ted Oberg of ABC13 News reported today that Abbott tapped the GLO because the City of Houston and Harris County were not moving fast enough with their flood mitigation efforts. The article’s headline says, “Slow pace costs Houston, Harris County control of flood money.” It begins, “Texas Gov. Greg Abbott has taken notice of Houston’s slow-moving progress with its Harvey recovery program.”

“Houston and Harris County’s lack of movement on Harvey housing recovery is the reason the city and county will not get a direct allocation. Victims need this money. That’s why this will go through GLO,” Abbott spokesman John Wittman told 13 Investigates’ Ted Oberg.

In the Mayoral Debate on Wednesday, Houston Mayor Sylvester Turner said that the city had received $1.3 billion for home repair and recovery.

Oberg reported in June, 2019, that only four people received housing aid as of that date, despite private companies being paid millions to operate the program. Oberg says that the City’s latest figures show that since then, only an additional 11 people have received financial assistance, despite more than 16,400 homeowners expressing interest in it. 

As of August 1, of the 4,900 people that the City invited to apply for its federally-funded Homeowner Assistance Programs, less than half submitted an application.

Reaction from Local Officials

According to Oberg, Mayor Sylvester Turner said, “It’s on them now.”

Judge Lina Hidalgo said in a statement to 13 Investigates. “While we’re disappointed in Governor Abbott’s decision to run this program out of Austin instead of providing us local control, we’ll continue to work as a team to make sure we apply every single federal dollar available towards building a stronger, safer Harris County.”

Questions Still Remain

It’s still unclear to me at this hour how the GLO’s focus on large scale mitigation projects affects individual homeowners seeking financial assistance. They seem to tap two different pots of money. But they also seem to have been conflated by the reporting on this issue. Let’s hope that the state can speed things up on both fronts. Flooded homeowners need help immediately, not three years after the disaster.

More than a dozen homes on Dunnam Road near Tailor Gulley flooded for the second time in four months during Imelda. The owner of the home on the left told me he did not apply for federal assistance.

Need to Re-engineer Disaster Mitigation is NOT in Question

As I’ve stated before, we need to re-engineer the whole disaster mitigation business. Sometimes fewer people, not more, can get results faster.

Harris County’s Final Harvey report stated: “Based on house flooding assessments, the estimated total number of homes flooded within Harris County is 154,170.” That only 15 homeowners have received HUD financial assistance more than two years after Harvey is an indictment of the whole crazy system that has evolved.

Posted by Bob Rehak on 10/3/2019

766 Days after Hurricane Harvey and 15 since Imelda

KSA Approves $60,000 to Begin Emergency Repairs to East End Park Immediately

At its monthly meeting, members of the KSA Parks Committee voted unanimously to approve $60,000 to begin emergency repairs to East End Park immediately. The vote followed a presentation by Bob Rehak (me), Park Steward; Dee Price, KSA President; and Maryanne Fortson, KSA Secretary and President of Fosters Mill.

Safety Concerns Jumpstart Repairs

The presentation detailed damage by Imelda and historic East Fork flooding that put most of the park under water during the tropical storm. Much of the discussion focused on safety concerns following a review of photos taken from land, boat and helicopter, including those below.

Pelican Overlook Trail consumed by erosion from river during Imelda.
Same scene from river shows undercut banks. People standing near river could trigger dangerous cave ins.
More trail erosion in East End Park. The river migrated approximately 50 feet south consuming large parts of two trails.

The photos (including those above) showed significant bank erosion to the northern shoreline of the park. The river undercut two trails as it migrated south about fifty feet during the storm. Parts of two trails fell into the river: the Pelican Overlook and Eagle Point Trails.

Photos (above) taken from Josh Alberson’s boat show significant undercutting of the shoreline in those areas. That means, someone standing on the edge could trigger a cave in.

KSA has tried to close the park three times, but people keep tearing down the warning signs.

Options Discussed but NOT Included in Emergency Repairs

As part of the discussion on the motion, the Committee examined several alternative solutions to restoring the park to full functionality.

  1. A short new trail (further inland) will reconnect the two parts of the severed Pelican Overlook Trail.
  2. Fallen logs will block off the parts of the existing trail in danger of caving into the river. Metal signs will be screwed into the logs warning people of dangers ahead.
  3. KSA will abandon the Eagle Point Trail and rename it the “Dunes Area” of the park. Residents can still access the Dunes Area, but no trails will run through it. This will reduce current and future repair and maintenance costs; repairing that area consumed a large portion of the budget after Harvey. The dunes should offer a new experience for park-goers, especially those who like climbing or hiking in sand for cardio workouts.
  4. As a separate project (not included in the $60,000), KSA will explore the cost of building a new trail that connects the South Loop and Pelican Overlook trails without going all the way back to the main entry trail. It would go to the south of the “overflow channel” that carries floodwater through that section of the park and would not require bridges.
  5. Also as a separate project, KSA would compare two options for replacing a portion of the South Loop trail. The portion – between Heron’s Rest and the turn-off to the main boardwalk – turns into mud after every flood. The mud comes from several inches of silt deposited on TOP of the crushed granite trail. The first option: relocating the trail atop a berm that parallels the current trail about 50 feet further inland. The second option: replacing the current trail with a low boardwalk, like the ones near Alligator Alley.

Dunes Area Will Revert to Nature

This birds’ nest used to be the height of a basketball hoop. After Imelda, it’s ankle high. Photo by John Knoezer.

Emergency Repairs Will Include…

The Parks Committee appointed Rehak, Fortson and Price as a subcommittee to approve emergency repair costs, rather than wait another month for the Parks Committee to meet again. Included in the emergency repairs:

  • Tree removal, where necessary
  • Patching trails scoured by the flood to create a stable hiking and jogging surface
  • Resurfacing most muddy areas with crushed granite
  • Boardwalk repairs
  • Restoring the telephone poles in the parking lot to their original positions
  • Replacing trail underliner on hills with gravel to create a more stable base for crushed granite. The latter will form the top finished surface.
  • Erecting barricades and signs warning of hazardous conditions where the river undercut existing trails
  • Cleaning all boardwalks and benches
  • Removing all flood debris from trails.

Restoring An Ecological Gem

An estimated 70,000 to 80,000 visitors per year use East End Park. It is an ecological gem, valued as much for the 150 bird species that migrate through the park and a herd of deer that lives in the park year round, as for the quiet, restorative atmosphere that bonds families together on nature walks.

Five area cross country teams also use the park for practice. Joggers value the soft surface of crushed granite. It’s much easier on knees and backs than concrete.

East End Park is also one of the few dog-friendly parks in the City of Houston. Different people like the park for different reasons. It has so much to offer.

I remember one time, seeing a man sitting at a new bench in a particularly beautiful part of the park. He came day after day to walk in beauty and meditate on nature. One day, I asked him what he got out of it. It gave him the motivation, he said, to cope with chemo.

The poster below shows how the park looked then and how it will soon look again.

What East End Park looked like BEFORE Imelda.

Posted by Bob Rehak on 10/3/2019 with gratitude to Josh Alberson, John Knoezer, Dee Price, Maryanne Fortson, National Helicopter Service and the entire KSA Parks Committee

765 Days since Hurricane Harvey and 14 since Imelda

City of Houston Files Cease-and-Desist Order Against Perry Homes, Double Oak, and Figure Four Partners

Houston City Council Member Dave Martin would like for Kingwood residents to know that the City of Houston has filed cease-and-desist orders against Perry Homes, Double Oak Construction, Inc., and Figure Four Partners, Ltd. for the discharge of stormwater from the Woodridge Village development site. 

Erosion within Woodridge Forest. Photo taken two days after Imelda on 9/21/2019
How the streets looked in Elm Grove on 9/20/2019.

Basis of Cease-and-Desist Order

These cease-and-desist orders were issued in response to the discharge of sand, silt, sediment, and debris from the development site into the Municipal Storm Sewer System (MS4) on September 19, 2019. 

This discharge is in direct violation of City of Houston Ordinance: ARTICLE XII. – STORM WATER DISCHARGES, DIVISION 5 – ILLICIT DISCHARGES AND CONNECTIONS, Section 47-741 – Discharge to MS4 prohibited (a)   A person commits an offense if the person threatens to introduce, introduces or causes to be introduced into the MS4 any discharge that is not composed entirely of storm water.

Severe Damage to COH Property and Citizens

This discharge has caused severe damage to the City of Houston’s MS4 and to the property of the citizens of the City of Houston. 

As a result of this discharge, the City of Houston started last week a 12-week extensive investigation of the stormwater system located within Elm Grove and other effected communities within the far northeast section of Kingwood. This investigation is currently 10 percent complete. 

Another Update Coming on October 17

Another update on this investigation will be provided during the Council Member Martin’s Kingwood Town Hall Meeting to be held on Thursday, October 17, 2019 at 6:30 p.m. located at the Kingwood Community Center (4102 Rustic Woods, Kingwood, TX 77345). 

Council Member Martin is actively pursuing additional measures to be taken to further protect the residents of Kingwood. Although he has not yet specified what those are, members of his staff implied that they may be seeking to throw executives for the defendants into jail until the situation is remedied.

Posted by Bob Rehak on 10/2/2019

764 Days After Hurricane Harvey and 13 after Imelda

East Fork Mouth Bar Rapidly Developing

In the 2+ years since Hurricane Harvey, many East Fork residents complained that the West Fork was getting all the media attention and remediation dollars. Imelda may have just changed that narrative. An East Fork Mouth Bar rapidly increased in size during the storm.

Rapid Increase in Sedimentation Between Royal Shores and Luce Bayou

Between Luce Bayou and Royal Shores, Josh Alberson, an East Fork resident and boater says the channel recently measured as much as 18 feet deep. Last weekend, when checking cross-sections on the depth finder of his jet boat, the deepest part of the channel measured three to four feet in that same area. Here’s what it looks like from a helicopter pointing south toward Lake Houston and the FM1960 Bridge.

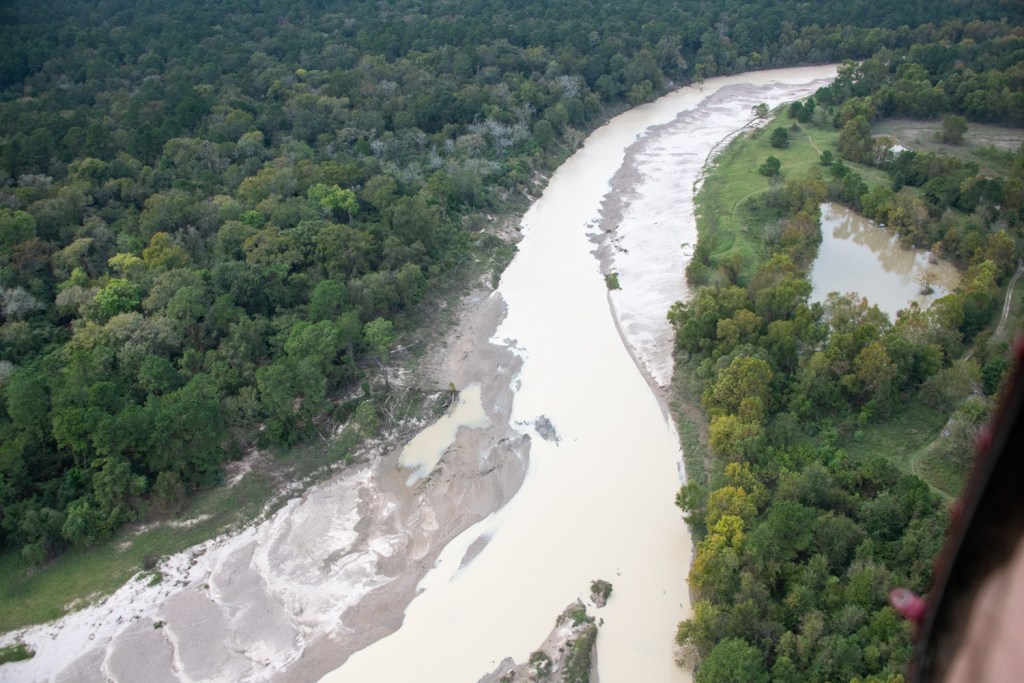
East Fork Mouth Bar. Photo taken one week after Imelda on 9/27/19.

It’s clear that portions of these bars preceded Imelda, just as portions of the West Fork Mouth Bar preceded Harvey. You can tell that by the vegetation. However, you can also see the immense recent growth of these bars in the areas without vegetation.

Shots taken from the boat show vast expanses of sand now clogging the East Fork.

Looking south toward the entrance to Lake Houston. Photo taken on 9/29/19. Channel between here and Luce Bayou (out of frame on the left) averaged 3-4 feet deep.
Looking west toward Royal Shores from same location. Photo taken 9/29/19.
Looking east toward Luce Bayou, I captured this shot of a dead tree on 9/29/19. It underscores how shallow the river is at this location. More than half the root ball sits above water.

Hundreds, Possibly Thousands of Trees Down

Upstream, hundreds, if not thousands of trees were uprooted by Imelda. The City and DRC had just completed removing such hazards. They did a thorough and beautiful job. However, Imelda will mean starting over…at least on the East Fork.

Giant Sand Bars Now Filling More than Half of River

The sand bar opposite East End Park migrated downstream. It also expanded outward and may have contributed to significant erosion on the parks northern shore. It now cuts off more than half the river. Not surprisingly The river appears to have migrated south in this area by at least 50 feet.
Opposite the massive sand bar above, entire trails have been washed away in East End Park. Beware of possible bank collapse. Very dangerous conditions exist on trails. Do not use the park until repairs have been completed.
The storm deposited other sand bars father upstream, like this one in the approximate area of Woodstream. It was just below where Taylor Gully enters the river at Dunham Road.

Fourth Breach Discovered at Sand Mine

Still unknown: how much of a role multiple breaches at the Triple PG mine played in sedimentation.

Charlie Fahrmeier discovered yet another breach at the mine on Monday; this one partial.

View of partial breach near north end of Triple PG mine from Caney Creek. Photo by Charlie Fahrmeier. Taken on 9/30/19.
Above the partial breach shown in the photo above. Fahrmeier says he found the grass all laying down in one direction indicating rushing water inundated it recently. Photo taken on 9/30/19.

Role of Sand Mine Under Investigation

Dan Huberty today announced that Ken Paxton, the state attorney general, has agreed to investigate the Triple PG mine. A spokesman for the federal Mine Safety and Health Administration said investigators were headed to the site today. The TCEQ has also launched an investigation.

Clearly, the mine is not responsible for all of the sand in the river. But its location in TWO floodways, four possible breaches, and loss of a major portion of its stockpile indicate it played some role in the massive sedimentation.

Looking south across the Triple PG Mine’s main stockpile. White Oak Creek swept in from the right and Caney Creek from the left. The stockpile measures approximately 20 acres and has risen to an estimated 90-100 feet at times. On this day, 9/27/19, it was much smaller. Whether that was due to erosion or sales is unknown. Notice all the equipment laying on its side to the right of the metal buildings.

Substantial Repairs?

After a breach in May, the mine simply dumped sand in the hole which quickly eroded again. Photo taken 9/29/19.

I doubt this meets the TCEQ requirements for substantial repairs.

Close up of breach repair. It appears to be nothing but sand. Photo 9/29/19.

Whether these repairs were intended to fail or whether the operator didn’t care if they failed, the result was the same. More sand in the river. And more gunk in your drinking water supply.

Posted by Bob Rehak on 10/2/2019 with thanks to Josh Alberson and Charlie Fahrmeier.

764 Days after Hurricane Harvey and 13 since Imelda

All thoughts expressed in this post represent my opinions on matters of public policy and safety. They are protected by the First Amendment of the US Constitution and the Anti-SLAPP statute of the Great State of Texas.

Imelda Floods Ben’s Branch Schools, Homes at Three Choke Points

Disclaimer: I spent the better part of a day driving down every street that borders Ben’s Branch. I saw damage clustered in three areas. It’s possible other areas were affected but the City had removed trash before I got there.

At least two schools, 7 homes, and one business flooded along Ben’s Branch in Kingwood during Imelda. All were located near choke points along the creek. And massive recent upstream development likely played a role in each case. That new development also played a role in eroding the margin of safety between floodwaters and foundations all along the creek – even for homes and businesses that did not flood. Total damages will likely exceed $3 million along Ben’s Branch in Kingwood.

Three circles represent choke points where virtually all structural flooding happened on Ben’s Branch during Imelda. See discussion below.

Ben’s Branch Now and 10 Years Ago: Influence of Upstream Development

Area in white box is roughly 800 acres. Three quarters of it was not developed ten years ago (see below). Red line marks the course of Ben’s Branch through a series of retention ponds and new ditches that now contribute more water faster during heavy rains.
Same area in 2009, only ten years ago.. Neither Woodridge Forest, Woodridge Village, nor the Kroger Center at 59 had started development yet, though some areas had been cleared.

Imelda Tested Design Limits of Drainage Systems

Most drainage systems are designed to protect homes and businesses from a hundred-year flood. Imelda was a hundred year flood. The storm tested the design limits of flood infrastructure everywhere along Ben’s Branch in Kingwood.

Based on its peak intensity of 4.56 inches in one hour (as measured at the US59/West Fork gage), Imelda qualified as a 100-year storm. Streets, storm drains and ditches are designed to handle that much as an upper limit. And for the most part they did. Especially because builders usually elevate most structures at least two feet above the hundred-year flood plain.

Those extra two feet act as a margin of safety and as a hedge against future upstream development.

Limits Exceeded in Several Places During Imelda

In each case where homes, businesses or schools flooded along Ben’s Branch, unique circumstances eliminated that margin of error and resulted in flooded structures.

With the exception of one low-lying home I found in Hunter’s Ridge very close to the creek, all of the structural damage took place at three choke points along the creek.

Choke Point #1: Northpark and Ben’s Branch

Where Ben’s Branch crosses under Northpark Drive, two things happen. A ditch from the new Woodridge Forest subdivision joins it. And then all that water is forced into a culvert that crosses under Northpark Drive.

These two culverts constrained water flowing under Northpark Drive and backed it up past Hidden Pines at the stoplight in the background. When water started flowing over the road for approximately two blocks, this part of Kingwood was cut off.

To my knowledge, no one has ever upgraded that culvert despite significant upstream development. It backs water up for several blocks during heavy rains and forces water OVER Northpark Drive. This caused at least six homes near Aspen Glade west of Hidden Pines to flood.

When water backed up and flowed over Northpark, it cut off both inbound and outbound traffic. It also broke through the fences of homes that back up to Northpark.

East-West fences were pushed in from the north by water overflowing across Northpark Drive. This location is a block west of the culverts.
Looking north toward Northpark Drive at Hidden Pines. North-South Fences were pushed out to the East by water trying to return to Ben’s Branch across Hidden Pines to the right. Note the new fence. It had just been replaced after the May 7th flood.
The scene on Aspen Glade Drive in North Woodland Hills. These homes are west of Hidden Pines and back up to Northpark Drive.
A resident of Aspen Glade shows how high the water got in front of his house during Imelda.
A worried Lela Yorba wonders how her family will ever recover from the second flood in four months, and whether she should even try. Despite living on Aspen Glade for decades, her home had never flooded before May of this year.
The interior of Yorba’s flooded home during Imelda. Image courtesy of Lela Yorba.
Yorba’s garage during the peak of Imelda. Image courtesy of Lela Yorba.
Floodwaters crept up to the foundations on the far side of the street but did not enter homes according to Yorba. Image courtesy of Lela Yorba.
One week after Imelda, Yorba tries to turn wet walls back into dry walls.

Impact of New Development

Net: the flooding of homes on Aspen Glade was likely caused by an undersized culvert at North Park that could not convey all the water coming from hundreds of acres of new development. When the water backed up, it rushed over North Park for approximately two blocks. Eyewitness reports and FaceBook videos peg the height at a foot above the roadway.

In the last 10 years, more than 600 acres have been developed north of North Park between 59 and Woodland Hills. More new homes are being built every day.

Much of the drainage from the new development joined Ben’s Branch just before it reached the culverts.

This drainage ditch from many of those new homes in Woodridge Forest joins Ben’s Branch east of Hidden Pines in the background where multiple homes flooded. This is additional drainage coming into the creek at a point where part of it can not be siphoned off into the diversion ditch that runs down the west side of the villages of North and South Woodland Hills.

Choke Point #2: Woodland Hills Drive and Ben’s Branch

About two or three blocks east of the culverts under Northpark, between St. Martha Catholic School and Kids in Action, Ben’s Branch narrows down again. It quickly funnels from a wide, excavated ditch to a narrow stream cutting through dense forest. See photo below.

Hovering over Woodland Hills Drive in a helicopter looking east. Ben’s Branch narrows between Kids in Action on the left and St. Martha’s school (out of frame on the right). Both flooded. Note how the fence was pushed in by the force of the water.

At this choke point, both the school and Kids in Action, flooded. Repairing the school after the May flood cost St. Martha $900,000. Repairing Kids in Action cost $500,000. This time it will cost each even more.

Behind St. Martha’s, Ben’s Branch becomes a narrow creek filled with trees. This further slows water down and backs it up. It remains like this most of the way to Kingwood Drive. Image courtesy of Father TJ Dolce.
The natural creek also makes many tight turns. Here, it makes a 150 degree turn followed by a 90 degree turn. Image courtesy of Father TJ Dolce.

The results were costly. St. Martha’s lost two classroom buildings plus its playground.

One of the two St. Martha School buildings flooded by Imelda.
Flooded corridor.
Flooded classroom.

Until the school buildings can be dried, disinfected and rebuilt, classes are being held on upper floors and in other parish buildings. No children were ever endangered by the flood. Parish personnel started evacuations to higher buildings as soon was water started coming into the parking lot, the lowest point on the campus.

Across the creek, Kids in Action, one of Kingwood’s most popular day care and after school facilities, had its own problems.

A distraught Diane Havens, owner of Kids in Action, tries to keep a brave face after she loses the use of her beautiful facilities for the second time in four months.
Hand sanitizer is the second thing you see in the reception area now.
Havens is bringing in four of these mobile units to hold classes until the first floor of Kids in Action can be restored again.

Haven’s spent $500,000 repairing her facilities after the May 7th flood. That’s a lot for a small business. She’s determined to weather this storm, too. But she worries that some of her clients may grow impatient in the inconvenience during repairs.

Choke Point #3: Kingwood Drive and Ben’s Branch

As Ben’s Branch approaches Kingwood Drive from the northwest, it spreads out into a 100+ acre forested area that includes the Creekwood Nature Center. But just before it crosses under Kingwood Drive, Ben’s Branch’s flood plain funnels down between Kingwood High School and the old H-E-B shopping center. At that point, a second branch of the stream joins it from the north. After crossing under Kingwood Drive, it is further constricted on the east side by commercial development. This represents another choke point.

The Kingwood High School Gym and Natatorium (bottom left) took on floodwater during Imelda.

The Kingwood High School gym and natatorium took on several inches of water during Imelda when drains and/or Ben’s Branch backed up. Merchants in the old H-E-B shopping center also report being stranded in their stores for two hours at the peak of Imelda as water from Ben’s Branch raced through the parking lot. Merchants said the water was inches from coming in their stores.

While many of the businesses south of Kingwood Drive in Town Center and Kings Harbor reported having water lapping at their foundations, I found none that reported flood damage.

No Simple Fix

I can’t think of a simple fix to all of three of these problems. Fixing one could compound the others. For instance, it would be simple to replace the culverts under Northpark with a bridge when the street is widened. However, that would just increase the volume of water backing up where the creek narrows between St. Martha’s School and Kids in Action. That would likely flood them even worse.

Channelizing the creek all the way to Kingwood Drive would likely be unpalatable from a political point of view. Four reasons: Few people in that area were affected. They all love their greenbelts. And the costs would be high. That would make the Benefit/Cost ratio of the project a non-starter.

One Possible Solution

One possible solution: convert the unused land around St. Martha’s new church north of Northpark Drive to additional detention. That’s valuable land and detention is expensive, but it may be a better alternative than losing the school which was just expanded in 2008. Father TJ Dolce is pitching that idea and hopes the Archdiocese would approve the use of their vacant land for detention. The big question: Would it be enough to make a difference.

Drainage Study Already Under Way

Thankfully, Harris County Flood Control is conducting a Kingwood-wide drainage study right now. They are studying Ben’s Branch. Hopefully, their talented engineers will be able to find the optimum solution that protects everyone. I sure hope they find it soon because these people are every bit as desperate as the people who flooded twice in Elm Grove and North Kingwood Forest.

Ben’s Branch may affect fewer structures. But it probably affects more people when you add up enrolled students and their families.

Posted by Bob Rehak on 10/1/2019 with help from Father TJ Dolce, Diane Havens, Lela Yorba, Daryl Palmer and National Helicopter Service.

763 Days since Hurricane Harvey and 12 since Imelda

Harris County Flood Control Issues First Report on Imelda

Jeff Lindner, meteorologist for Harris County Flood Control, has issued a 29-page report packed with statistics that puts Imelda in a historical context.

Contents of Imelda Report

The report starts out by summarizing what happened when and where during Imelda. It discusses far more than rainfall; it covers high water rescues, fatalities and more.

“Imelda demonstrated the susceptibility of the area to intense short duration rainfall rates,” says Lindner. That pretty much sums up the storm, but not the report.

Imelda Inch by Inch

“Lake Houston and 20.0-30.0 inches from Crosby to Huffman. 12-hr storm totals averaged 6.0-10.0 inches from the Spring Branch area to Lake Houston and 13.0-18.0 inches from Crosby to Huffman. 3-hr storm totals averaged 6.0-10.0 inches from northwest Houston to Huffman. 1-hr storm totals averaged 4.0-6.0 inches from Humble to northwest Houston including a maximum 1-hr total of 6.4 inches at Greens Bayou and US 59 and a 2-hr total of 9.2 inches. While just outside of Harris County, a 48-hr rainfall of 30.4 inches was recorded on the East Fork of the San Jacinto River at FM 2090 in the Plum Grove area,” says Lindner.

Comparing Imelda to Allison and Harvey

Many people have asked how Imelda compared to Harvey and Allison. It’s all in there. With max rainfall totals for each storm ranging from 5-minutes to four days. That was particularly illuminating in terms of explaining why some people flooded during one storm and not the other.

The report also includes:

  • A comparison of recent extreme rainfalls in Harris County for all those who worry we are on the verge of the apocalypse.
  • An analysis of overbook flooding for East and West Forks of the San Jacinto, Lake Houston, and other bayous.
  • House flooding estimates
  • High water marks
  • Rainfall intensity reports for multiple locations across the region
  • Contour maps showing rainfall intensities around the county
  • Peak water surface elevations

To download the full report click here.

Posted by Bob Rehak on 9/30/2019

762 Days since Hurricane Harvey and 11 Days since Imelda

Triple PG Mine Dikes Breach in Multiple Places, Contributing to Giant East Fork Sand Buildups

Of all the sand mines on the East and West Forks of the San Jacinto, the Triple PG Mine is unique. It alone sits inside the confluence of TWO floodways. The Prabhakar Guniganti family owns the mine. So far they have cleared, grubbed and mined about 700 of the 2000 acres they own in the area. But that hasn’t stopped them from receiving timber exemptions from the Montgomery County Appraisal District on the land being mined (that has no timber).

After Harvey, when I found 30 acres of sand up to 15 feet deep covering East End Park (just downstream from the mine), I rented a helicopter to see where the sand came from. That’s when I discovered this horrific mine for the first time.

Owned by Cardiologist Turned Sand Miner

Prabhakar Guniganti is a cardiologist from Nacogdoches who has broadened his practice into mining and land development.

I hope he’s better at cardiology than mining. His mine has received 15 citations in the last two years from the Mine Safety and Health Administration (see the MSHA site for a key to the citations). The one highlighted in yellow had to do with a breach.

Fifteen in two years averages out to more than one every other month. And that does not even include notices of enforcement from the Texas Commission on Environmental Quality, for instance when Tony Buzbee, candidate for Mayor discovered a massive breach in the dike of the Triple PG mine back in May.

Will This Never Stop?

Last week, Charlie Fahrmeier, a Lake Houston Area resident and an expert in sediment control, observed the same breach open AGAIN. Right above East End Park, which was destroyed by sand AGAIN.

So Friday, I rented another helicopter to see what I could see. What I saw turned my stomach. There was more than one breach. There were at least two and possibly three.

It appeared that Caney Creek (from the north) and White Oak Bayou from the west “captured the pit.” The streams then apparently crossed the mine sweeping out through the breach on the southeast side back into Caney Creek and then down the East Fork of the San Jacinto River.

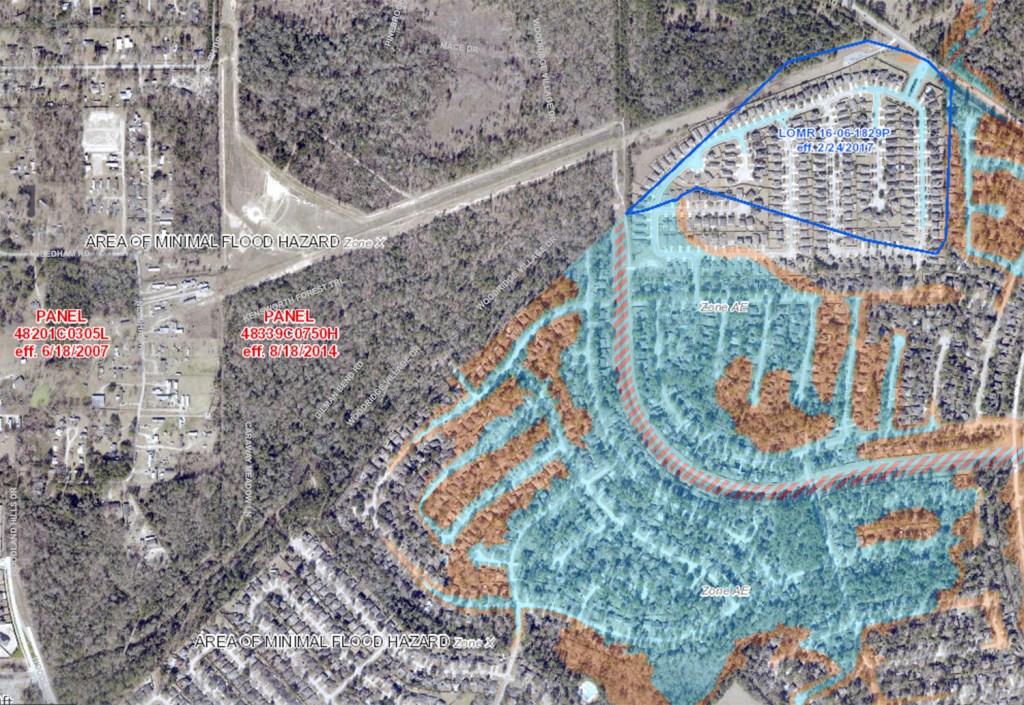
White Oak Creek approaches the mine from the west and Caney Creek runs along its north and east sides. From the images below, taken a week after Imelda, it appears that the both creeks captured the mine and cut across it. From FEMA’s National Flood Hazard Layer Viewer.

Where Breaches Occurred

The TCEQ fined Triple PG $16,875 for breaches one and two that were first reported after the May 7th storm. TCEQ has opened another investigation into the most recent breaches. Fines could be more substantial this time.

Three Breaches from the Air

Looking north from over the pit toward Caney Creek out of frame on the top. Water likely entered the mine from the north as Caney Creek reached flood stage and cut across the point bar above the mine.
Taken 9/27/19.

A reverse shot shows how water tore through the mine.

Looking south from over Caney Creek, you can see how current ripped through the mine. The road across the mine in the middle of the frame had been recently repaired when I took this shot on 9/27/19.
At the far end of the shot above on the west (right) side of the mine, I found this breach near White Oak Creek. Taken 9/27/19.
Looking east, directly across the mine, I saw this breach in the same location as the May breach. That’s Caney Creek in the background. Taken 9/27/19.
This close up shot of the same breach looking west from over Caney Creek shows how flimsy the repair was from earlier in the year. It was nothing but some sand dumped into a hole. Taken 9/27/19.

Designed to Fail?

Two engineers told me that patch looked like it was “designed to fail.” Mine Safety and Health Administration regulation §56.20010 regarding retaining dams specifies that “If failure of a water or silt retaining dam will create a hazard, it shall be of substantial construction and inspected at regular intervals.” Clearly, sand is not substantial. “Built properly, that repair would not have reopened in this past flood,” said Fahrmeier.

 TCEQ Requirements for Dike Construction and Repairs

Here are the TCEQ requirements for constructing dikes and levees. Note the paragraph on page 2 about structural integrity. “Construction must be based upon sound engineering principles. Structural integrity must withstand any waters which the levee or other improvement is intended to restrain or carry, considering all topographic features, including existing levees.”

These dikes had the structural integrity of a sand castle at a beach when the tide comes in.

Also interesting: Paragraph 4, Rights of Third Parties to be Protected. It’s a good read as far as regulations go.

Certainly, East End Park, just downstream was not protected.

KSA just finished cleaning up East End Park from Harvey. The organization spent close to $200,000 to restore trails covered in sand that reached to the treetops. Now the entire Kingwood community will have to sacrifice again. This area used to be a boardwalk over wetlands. The sign used to be shoulder high. Now it’s knee high.
Another trail covered in sand and silt. Not all of this came from the mine; some came from river erosion. But the serious problems first appeared after the mine.

How to Tell Mine from River Sedimentation

Charlie Fahrmeier who first discovered the most recent breach said that when he discovered it, water and sediment was streaming out of the mine. The water color was distinctly different from the color of water coming down Caney Creek. If the creek were responsible for all the sedimentation, the colors would have been reversed.

Caney Creek Now Averages 1.7 Feet Deep

In a future post, I will examine the growing mouth bar on the East Fork. That’s right. The East Fork and Caney Creek are barely navigable now. John Alberson took his jet boat up Caney Creek today and noted giant sand bars stretching across the river below the pit. He said the deepest part of the creek was 1.7 feet. The more sand there is in the creek and East Fork, the less room there is for water, so the higher the water rises during a flood.

How to File a Complaint With Mine Safety Authorities

I encourage everyone to file a Hazardous Condition Complaint with MSHA.  You can do it online at https://lakmshaegov01.msha.gov/HazardousConditionComplaint.aspx.  If they get enough complaints it could elevate the review. 

Here’s some information you’ll need to file:

  • Mine ID: 4104950
  • Mine Name: Triple PG Sand
  • Mine Operator: Triple PG Sand Development LLC
  • Mine is in two zip codes but breaches appear to be in 77365.
  • Location of Breach #1: Long 30.102968°, Lat -95.171932°
  • Location of Breach #2: Long 30.055360°, Lat -95.104712°
  • Location of Breach #3: 30.065451°, Lat -95.102904°

Please help shut this mine down. It’s dumping its process water loaded with sediment and chlorides into your drinking water. Moreover, the City doesn’t have enough money to dredge the East Fork and its tributaries every time we get a big rain. Let’s stop this problem at the source. We need sand for concrete, but we don’t need it from this mine.

Posted by Bob Rehak on 9/29/2019

761 Days since Hurricane Harvey

The thoughts expressed in the post represent my opinions on matters of public interest and safety. They are protected by the First Amendment of the US constitution and the Anti-SLAPP statute of the great State of Texas.

Crenshaw Donates Perry Homes’ Campaign Contribution to First Baptist Flood Relief Fund

Today, rumors sprung up on social media about a campaign contribution from Perry Homes to Congressman Dan Crenshaw. Some people new that he had accepted the check from Perry Homes back in November of 2018. Most people did not know, however, what Crenshaw had done with it. A quick call to Sue Walden, a Crenshaw aid, cleared up the confusion.

Congressman Crenshaw talks with flooded Elm Grove residents shortly after the September 19th flood about where the water came from.

After touring the devastation in Elm Grove this week, Crenshaw did two things.

  • He called Perry Homes and told them “firmly” that they needed to fix the drainage in Woodridge Village so that Elm Grove residents did not flood again.
  • Crenshaw wrote a check for $2500 to the flood relief effort being sponsored by First Baptist Church of Kingwood. The amount of the donation matches the 2018 campaign contribution that Perry Homes made to his campaign.

I think this shows class, compassion, and integrity. It eliminates any appearance of a conflict of interest. It also helps the people who need it most, flood victims, rather than putting the money back in the hands of the people suing them.

If you can help, please donate at:

https://tithe.ly/give_new/www/#/tithely/give-one-time/665161

In the drop down box at top of the page, make sure you select, Flood Recovery Kingwood.

Posted by Bob Rehak

760 Days after Hurricane Harvey and 10 days after Imelda

Why Some People Flooded on May 7th or September 19th, But Not During Harvey

After May 7th and September 19th storms, reports started pouring in about homes that flooded that had not flooded during Harvey. How could that be? Harvey dumped more rain than any storm in history of the continental U.S. The short answer: When you look closely at the rainfall statistics, its comes down to totals versus intensities. Even though Harvey brought more rain, its peak intensity never came close to the other storms’. Those higher peaks can create street flooding miles from any river. And they did.

Those looking for a more detailed explanation can read below.

Let’s start by looking at three local rainfall gages on the West and East Forks. Then we’ll compare statistics.

Where To Find Statistics

Using the Harris County Flood Warning System, you can find historical rainfall data for any date or gage in the region. Here’s what I found for three local gages and three storms.

Comparison of Storm Totals, Peak Intensities and Durations

During Harvey, we received:

  • 33.04 inches at the West Fork/US59, with a peak 2.36 inches in one hour.
  • 27.44 inches at the East Fork/FM1485, with a peak 1.4 inches in one hour.
  • East Fork/FM2090 – no data reported.

On May 7th, we received:

  • 6.76 inches at the West Fork/US59 with a peak 3.64 inches in one hour
  • 9.84 inches at the East Fork/FM1485 with a peak 3.16 inches in one hour
  • 6.76 inches at the East Fork/FM2090 with a peak 1.6 inches in one hour

On September 19th, we received:

  • 11.56 inches at the West Fork/US59 with a peak 4.56 inches in one hour
  • 18.88 inches at the East Fork/FM1485, with a peak 9.4 inches in three hours.
  • 19.68 inches at the East Fork/FM2090, with the peak of 3.24 inches in one hour.

Comparing Totals and Intensities

From this data, several things become immediately apparent.

  • Harvey dropped the most rain, but had the lowest peak intensity.
  • Compared to May 7th, the September 19th storm dropped roughly 2-3X more rain at each gage.
  • Comparing gage locations, you can also see tremendous variability over just a few miles for any given storm. For instance, on September 19th, 63% more rain fell on New Caney than the Humble/Kingwood area.

Comparing All 3 Storms to Precipitation Frequency Estimates

The next question: How do these numbers compare to the hypothetical 100- and 500-year rainfall events? Here are the updated precipitation frequency estimates for this area from NOAA Atlas 14.

Take the totals and peak intensities from the gage information above. Then locate them in the table below. Here’s what you find.

Frequency Estimates for Harvey – August 25-30, 2017

US59 at West Fork during Harvey
  • 500-year event based on 5-day total
  • 2- to 5- year event based on peak hour.
FM1485 At East Fork during Harvey
  • 200-year event based on 5-day total
  • 1-year event based on peak hour.
FM2090 at East Fork during Harvey
  • No data available

Frequency Estimates for May 7 Storm

US59 Gage on May 7
  • 5-year storm based on 24-hour totals
  • 25-year storm based on the 1-hour peak

Street and minor yard flooding in an event like this is normal. But it should not have entered your house if the house is above the 100-year flood plain. (Most homes are at least two feet above.)

If you’re near this gage and your home flooded on May 7th, it probably wasn’t because of the peak rainfall intensity or total. You should be looking for clogged or broken storm drains, fallen trees/sediment blocking ditches, or upstream development, like Woodridge Village, that overtaxed the capacity of drainage systems.

FM1485 Gage on May 7
  • 25-year storm based on rainfall total
  • 10-year storm based on peak intensity (1-hour rate).

Again, this should be well within the capacity of infrastructure to handle. If your home flooded, look for other causes like those above.

FM2090 Gage on May 7
  • 5-year storm based on rainfall total
  • 1-year storm based on peak intensity.

Infrastructure should have handled that easily. If your home flooded, look for one of the possible causes listed above.

Frequency Estimates for September 19 Storm

US59 Gage on September 19
  • 25-year storm based on 24-hour total
  • 100-year storm based on peak intensity.

Storm drains are designed to handle about 2 inches per hour, but when we got 4.56 inches between 9 and 10 a.m., we clearly pushed infrastructure capacity to the limit. It’s no accident that Jeff Miller’s security camera witnessed a huge surge of muddy water from Woodridge Village coming down his street at 10:10 a.m.

Most infrastructure, homes, and businesses are built to handle a hundred-year rain event. Even homes surrounded by 100-year flood plains are usually raised above them.

If you flooded in this event, it may have been because of the extreme rainfall or because your slab wasn’t elevated two feet above the 100 year flood plain like most building regs require.

Other causes may have factored in also. When there’s little margin for error, a partially clogged storm drain or ditch, or upstream development could have made the difference between flooding and not flooding.

A massive 268-acre, clear cut area with only 25% of the detention installed immediately upstream from you would quickly turn a marginal situation hopeless.

FM1485 Gage on September 19
  • 100- to 200-year storm based on 24-hour totals.
  • 100- to 200-year storm based on 3-hour peak intensity.

It easily surpassed the design capacity of infrastructure. Events like this make a good case for flood insurance if you don’t have it.

FM2090 Gage on September 19
  • 200-year event based on 24 hour total
  • 10-year event based on peak intensity.

Again, think flood insurance. You’re way past the design capacity of infrastructure.

River Flooding Vs. Street Flooding

Peak intensity usually affects streets first. Storm totals usually affect rivers later.

From the frequency estimates above we can see that Harvey was extreme in its totality, but did not reach the peak intensity that either the May 7th or September 19th storms did. In fact…

The highest one-hour total for the May 7th and September 19th storms at all three gages exceeded the highest one-hour measurement during Harvey.

The real story of Harvey: how much rain KEPT falling for days and days. And how much water was released from the Lake Conroe Dam at the peak of the storm. Harvey was not about street flooding. It was about river flooding.

River Flooding Versus Street Flooding

Rainfall totals, intensities and durations affect flooding differently.

Street Flooding

Intense bursts of rain like we saw on September 19th create street flooding. Short bursts quickly exceed storm drain capacity, and the storage capacity of sewers and streets. Water comes up in the streets quickly and goes down quickly. This could be miles from a river, long before river flooding. Rainfall just can’t get out of the neighborhood quickly enough.

River Flooding

It can take days for water to migrate to a river and for large rainfall totals to force the river out of its banks. River flooding usually happens long AFTER street flooding, when the storm totals exceed the conveyance capacity of the river.

Importance of Location

During Imelda, New Caney received 20 inches of rain, while Lake Conroe received only 2. So there was no need to release water from Lake Conroe. For the most part, West Fork flooding was minor. But it was a totally different event on the East Fork where heavy rain piled up for two days.

Harvey – Classic River Flooding

During Harvey, the rainfall intensity only briefly surpassed the carrying capacity of infrastructure. But when the rain piled up in rivers for days and the SJRA released 80,000 cubic feet per second from Lake Conroe, tens of thousands of people flooded.

  • As the river rose, the water in ditches had nowhere to go.
  • As the ditches rose, the water in storm drains had nowhere to go.
  • As the water in storm drains backed up, the water in streets had nowhere to go.
  • And when the rain kept coming…you know the rest.

Summary

I hope this helps explain why some people flooded on May 7th and/or September 19th and not during Harvey. Different intensities and different durations produced different types of flooding.

Posted by Bob Rehak on 9/27/19 and dedicated to my old friend David Lyday

759 Days since Hurricane Harvey

Kingwood Docks Development Submerged

During Imelda, most of the new Kingwood Docks development in Town Center went underwater and stayed that way for days. Much of it is still underwater. Many people have expressed concerns about the development of this area in recent months. It frequently floods. They worry about the potential for the development to increase flood risk for surrounding homes and businesses.

Let’s look at this property, its history, and the plans for it.

Repetitive Flooding

When the site was apartments for the first 30 years of Kingwood, it had a history of flooding repeatedly. It still does. It went underwater during Harvey, May 7th, and Imelda – three times in the last two years.

Here’s what the site looked like before redevelopment into commercial space. Note the triangular area at the far right.
Here’s what it looked like a couple years ago. Lovett started clearing the land on the end.

Entire Property in Flood Plain

FEMA’s National Flood Hazard Layer Viewer shows the entire development is in the 100 year flood plain (aqua). Brown areas represent the 500 year flood plain. Unshaded areas (top right) are not in a known flood hazard zone.

Restaurants with a River View

Since 1998, this site went through a series of five owners. All chose not to develop it once they discovered the site’s problems … until now.

Lovett Commercial bought this property in 2014 under the name Kingwood Retail Partners LTD. They intend to develop this area into a strip of restaurants. During heavy rains, those restaurants will have a river view. Except no one will be able to park by them.

Here’s what the area looked like from Kingwood Drive on 9/19 as rains for Imelda receded. Photo courtesy of Josh Alberson.

How High the Water Got

The debris on this sign shows how high the water got in what will become the parking lot/entry area. Docks! A prophetic name if ever there was one. Perhaps someone was trying to turn a negative into a positive.
What the parking area looked like the day after the storm. Water stayed like this for days. Part of it is still under water a week after Imelda.
Photo taken 9/21/19 shows erosion to pad site. The restaurants themselves will be built up 6-7 feet. Get out your climbing gear. That’s going to be one hell of an ADA ramp.

More Restaurants Planned

Lovett will build twin 14,000 sf structures on that elevated portion (right). They hope to squeeze five restaurants into them. Each structure will measure 200 ft x 70 ft according to their plans.

This shows part of what will become a detention pond around the eastern perimeter of the site. Note how it’s much lower than the creek next to it.
Another view of the “mitigation” area. Photo taken Saturday 9/21/2019. Two days after Imelda, it still had not drained.

The parking will be underwater when it rains. So think seafood restaurants. (Sorry.) Crawfish anyone?

Lessons of History

The current owners bought this property in 2014, about the time that the adjacent apartments were cleared to make way for the HEB center. Lovett began clearing its land in 2016, as HEB and Memorial Hermann Convenient Care Center began construction. By Hurricane Harvey in August 2017, they knew something was terribly wrong.

Lovett knew that its land was lower than the adjacent shopping center as you can clearly see from this Google Earth photo dated 8/30/2017, one of the last days of Harvey. Look where all the water ponds!

Lovett clearly saw the catastrophic flooding during Harvey. Torchy’s, adjacent to them, flooded to the rafters during Harvey. So did every other building in the center.

Despite all that, Lovett started developing the property in earnest this year. Their sign promised that retail space would be available by Fall of 2019. It’s now Fall, and from the photos above, I doubt the owners will have it ready in the next three months.

Ain’t No Arguing with Mother Nature

I spent the last two years writing about flooding. One thing has become perfectly clear to me. We have flooding because people don’t respect the power of water. They think they can win arguments with Mother Nature. So in the name of science, engineering, free enterprise and private property rights, they build in areas where they should not. Confident that they will have the National Flood Insurance Program to bail them out when Mother Nature puts her foot down.

The Simple Solution to Flooding

If we want to stop flooding, we have to stop pushing the envelope into questionable areas. We pay lip service to that idea, but, here we go again. It’s death by a thousand cuts. One parcel at a time.

Posted by Bob Rehak on 9/26/2019

758 Days after Hurricane Harvey

All thoughts in this post represent my opinions on matters of public policy and safety. They are protected by the First Amendment of the US Constitution and the Anti-SLAPP statute of the Great State of Texas.