Sprint Sand & Clay, the company hired by Harris County Flood Control to excavate 500,000 cubic yards of dirt from Woodridge Village, began hauling some of it to the controversial Laurel Springs RV Resort near Lakewood Cove this morning.
Wake-Up Calls
My phone started blowing up before breakfast with dozens of complaints about Sprint truck traffic. So, I began investigating. I first went to the Woodridge Village site. Drone photos and on-the-ground observations revealed that Sprint was indeed hauling dirt from the Woodridge Village excavation site.
SW corner of Woodridge Village taken Wednesday 2.9.22. Sprint trucks line up to haul off dirt.
I followed one of the trucks all the way to Laurel Springs Lane where I observed it dumping its load. Along the way and at each end, I saw many more Sprint trucks – up to four at a time. There was a veritable parade of dump trucks making round trips along Woodland Hills Drive, Kingwood Drive, Chestnut Ridge, and Laurel Springs Lane.
Orange truck from above enters RV site several minutes later and turns toward detention pond.The orange truck dumps its load just north of the pond near an area marked as the 500-year floodplain. Other equipment spreads it out.
Will Storm Drains Be Adequate?
Sprint trucks had also dumped dirt near a new “north entrance” to the site.
In the shot above, note the ponding water from 0.2 inches of rain more than a week ago. The contractor’s Stormwater Pollution Prevention Plan describes this soil as “silty sand” to a depth of 18 inches (Page 18).
They may want to recheck that before installing more storm drains.
Other Issues Noted Today
Most trucks that I observed used what has now become the “south” entrance. The fresh load of bullrock laid down days ago has already been covered with mud. That accounts for all the dirt tracked into the street. While the storm sewers were still unprotected from dirt, at least a street sweeper was onsite today.Another unprotected storm sewer and contractor taking water from City fire hydrant. Photo courtesy of Robin Seydewitz.All the dump trucks I observed were this large size, not the kind that holds 10 cubic yards.
Good News/Bad News
The start of serious excavation at Woodridge Village comes as welcome news to the people of Elm Grove and North Kingwood Forest who flooded twice in 2019. However, it’s equally worrisome to the people of Forest Cove and Lakewood Cove. Many expressed concerns about potential flooding.
Risks from Building Up Land
Should existing residents be concerned about that? Yes, was the answer I got from one respected hydrologist who spoke on condition of anonymity. He likened the built-up area to a berm and said that “You don’t want a berm to stop overland sheet flow.”
The elevation survey shown below comes from the RV park’s Stormwater Pollution Prevention Plan. It shows that the land naturally slopes from northeast to southwest. Building up the RV property would definitely prevent water from the NE from flowing in that direction. Sheet flow would divert south along Laurel Springs and put an evacuation route at risk.
Survey shown in developer’s Stormwater Pollution Prevention Plan shows elevation going from 83.1 in the NE to 61.4 in the SW, a difference of more than 20 feet.
East to west along the southern boundary, the elevation drops from 67 feet at Laurel Springs to 61 feet near the railroad tracks.
Another risk is that sheet flow with nowhere else to go could back up Lakewood Cove storm sewers at the same time that the RV park is trying to pump water into them to compensate for its undersized detention pond.
If someone sustains water damage on their property due to a neighbor’s property, questions as to who may be liable may arise. Surface water runoff — most often caused by excess rainwater — is the common culprit. Texas law holds landowners responsible for damage to neighboring property due to diversion of surface water.
I received a copy of the RV Park’s SWPPP plan today from the TCEQ. Parts of it made me laugh out loud. For instance, the section about “Receiving Waters, Wetlands and Special Aquatic Sites” said:
“No existing wetlands or other special aquatic sites have been identified at or near this site [Emphasis added].”
Page 18 of Laurel Springs RV Park SWPPP prepared by Construction Eco Services
Obviously, they didn’t glance across the southern property line or consult the National Wetlands Database. I can’t wait to read the rest of this plan to uncover more gems.
From US Fish & Wildlife Service National Wetlands Inventory Mapper. The RV Park is going in just above the large green area labelled PF01A Future Edgewater Park.
Posted by Bob Rehak on 2/9/22
1625 Days since Hurricane Harvey
https://i0.wp.com/reduceflooding.com/wp-content/uploads/2022/02/20220209-DJI_0838-e1644458655903.jpg?fit=1200%2C799&ssl=17991200adminadmin2022-02-09 20:26:572022-02-09 23:01:35Dirt Excavated from Woodridge Being Used to Build Up Laurel Springs RV Resort
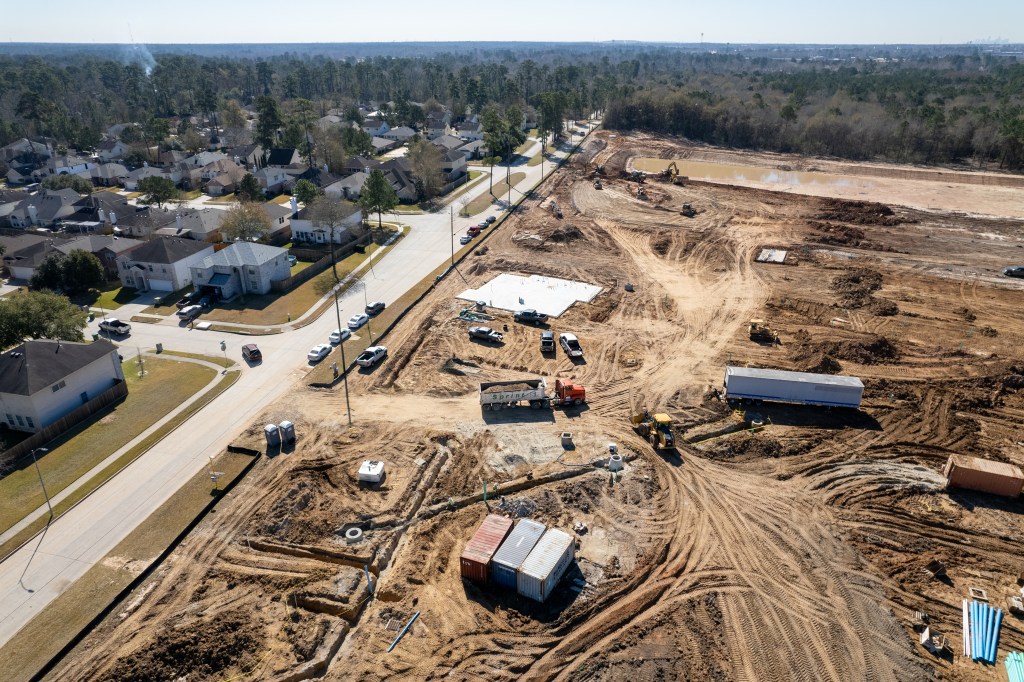
In the afternoon of 1/27/22, Harris County Flood Control District (HCFCD) contractor Sprint Sand & Clay began excavation of additional detention pond capacity on Woodridge Village. Woodridge is the former Perry Homes property implicated in the flooding of Elm Grove Village and North Kingwood Forest twice in 2019. Numerous factors contributed to the flooding. But insufficient detention pond capacity led the pack. The volume excavated by Perry contractors fell about 40% short of Atlas-14 requirements.
Initial Work Will Improve Access
The initial work will improve access to the site. Sprint says it hopes to begin excavation in earnest next week. By comparing the picture and map below, you can see that the task will be immense.
Looking NE at main portion of Woodridge Village Site as excavation of new detention pond begins. It will extend to the pond in the upper right.Excavation off the green area above will more than double the detention pond capacity on the Woodridge Village Site.
History of Project and Contract Details
In February last year, HCFCD purchased Woodridge Village with the intention of creating additional detention pond capacity. Fast forward to November 2021. HCFCD and Sprint signed an E&R contract. E&R stands for Excavation and Removal. Under the terms of their contract, Sprint Sand & Clay will excavate material as needed.
Taxpayers generally like E&R contracts, but anxious homeowners may worry about the “as needed” clause. That can slow work down if market demand falters. Nevertheless, Sprint has an obligation to remove at least 5,000 cubic yards a month. That’s enough to fill 500 dump trucks. In total, they’ll fill 50,000 before the job is done.
Covid Delayed Start
The project could have started in December, but Covid-related absences slowed the contractor. This afternoon, however, the contractor began a) clearing an access road for trucks into the site and b) clearing space for a construction trailer near the excavation. The contractor hopes to begin excavation in earnest next week. But again, they make no guarantees on that point.
Pictures Taken 1/27/22
Regardless, signs of progress are welcome. Here are pictures taken of the project just hours into it.
Sprint began by clearing a two-lane road for their trucks opposite the entrance to the Northpark Recreation Area on Woodland Hills Drive. The company plans to work around the high school’s schedule (upper right).The company began by clearing an area near the entrance to the largest portion of the site.Dirt from the initial excavation is being stockpiled near the Woodland Hills entrance opposite Kingwood Park High School for the moment.
The contractor appears to be shuttling dirt from the excavation area toward the entrance. It’s not immediately clear whether that dirt will be used to build up a construction road or hauled offsite.
Posted by Bob Rehak on 1/27/2022
1612 Days since Hurricane Harvey
https://i0.wp.com/reduceflooding.com/wp-content/uploads/2022/01/20220127-DJI_0534.jpg?fit=1200%2C799&ssl=17991200adminadmin2022-01-27 17:24:592022-01-27 17:26:50More Woodridge Village Excavation Started Today
Yesterday, 1/25/22, Harris County Commissioners Court named Dr. Christina Petersen as the new head of the Flood Control District. That position had been open for seven months since Russ Poppe resigned last July. Below is a brief bio of Petersen distributed by David Berry, the new Harris County administrator.
Dr. Christina Petersen, new head of Harris County Flood Control District
Petersen Background
“Dr. Christina “Tina” Petersen will serve as the first female Director of the Flood Control District in its 85-year history. She joins Harris County from the Harris-Galveston Subsidence District, where she has served as Deputy General Manager for the past 3 years and oversaw the District’s Regulatory Planning, Scientific Research, and Water Conservation Programs. She earned her Bachelor’s degree in Biology and Environmental Studies from Baylor University and her Master’s and doctoral degrees in Environmental Engineering from the University of Houston. She is a registered Professional Engineer in Texas and has over 15 years of experience working with local city governments as well as water authorities, State agencies, and cities across Texas to deliver complex water supply and water quality projects.”
I’m trying to learn more about Dr. Petersen’s background. What I didn’t see in this was any mention of hydrology experience. Nor did I see any mention of private-sector experience. More news to follow.
Other Related Appointments
Meanwhile, Berry’s press release also listed:
Dr. Milton Rahman, who will serve as the new County Engineer. Dr. Rahman is a Professional Engineer, Project Management Professional, and Certified Floodplain Manager.
Lisa Lin, the first director of the Sustainability for Harris County.
Daniel Ramos, the new Executive Director of the Office of Management and Budget.
Posted by Bob Rehak based on a press release by Dave Berry, Harris County Administrator
1611 Days since Hurricane Harvey
https://i0.wp.com/reduceflooding.com/wp-content/uploads/2022/01/Tina-Petersen.jpg?fit=468%2C624&ssl=1624468adminadmin2022-01-26 12:01:582022-01-26 13:27:08Harris County Names Dr. Tina Petersen New Head of Flood Control District
Correction: Original plans called this development Madera. Subsequently, the developer named it Mavera. I have changed all mentions of the former to the latter because of confusion it caused as time went by.
A new 1700-acre development called Mavera at FM1314 and SH242 claims it will have “no adverse impact” on surrounding areas. However, to determine this, the authors of the drainage impact analysis used a controversial technique permitted by Montgomery County drainage regulations. It’s called “hydrologic timing.” The technique doesn’t take into account drainage from other developments in surrounding areas. Nor did it factor in the destruction of wetlands.
Outline of Mavera Development (dotted line) just north of SH242 at FM1314). For reference, Artavia (mentioned below) lies under the legend.
The Problem with Hydrologic Timing
The theory behind hydrologic timing is that if you can get your water to the river before the peak of a flood arrives, then you aren’t adding to the peak. This might have “no adverse impact” if you were the only development in a watershed. But when you’re:
Artavia, for instance, claimed that its drainage plan would get water to the West Fork 35 hours before upstream peaks arrived. Meanwhile, Mavera (literally a few hundred feet away on the other side of SH242), claims it will get its peak to Crystal Creek 28 hours before that stream’s peak arrives. Crystal Creek empties into the West Fork just upstream from Artavia’s drainage.
Natural and man-made peaks for 100-year storm on left. Engineers will get water to creek twice as fast as nature.
So you could have potentially one peak on top of another and another, etc.
Neither development accounts for peak changes induced by the other in analyses.
Now multiply that times a hundred or a thousand developments and you see the danger.
As far as I can see, the drainage impact analysis supplied by engineers makes no attempt to compare the amount of natural detention to man-made detention.
When Does Real Peak Happen and Why Does It Matter?
Engineers claim they aren’t adding to discharge; they’re just shifting the peak. But because of all the development in MoCo in the last 40 years, it’s not clear when that peak from outside the development will really happen.
In fairness, Mavera plans do show a number of detention ponds. But even with those, Mavera will still add 16,300 cubic feet per second to the West Fork in a 100-year storm. And that’s just for Phase 1 of the development! That’s why engineers say below, “will not likely have an impact on peak flows…”
From documentation supplied to MoCo engineer’s office by Torres & Associates on 2/19/21
To put that volume in perspective, during the peak of Harvey, the SJRA says the nearby West Fork carried 115,000 CFS. So Mavera will contribute 14% of Harvey’s volume at that point on the West Fork. And most people consider Harvey far more than a 100-year storm.
Problem with Higher Peaks
The hydrograph below shows how the peak on Brays Bayou shifted over time with upstream development. On the West Fork, this may already be happening.
Time of accumulation in Brays Bayou was cut in half over time, leading to higher flood peaks.From HCFCD, FEMA and Tropical Storm Allison Recovery Project.
In the last 20 years, HCFCD and its partners have spent more than $700 million on flood mitigation in the Brays Bayou watershed.
The safest strategy is for new developments to “retain their rain” until the peak of a flood has passed and then release it slowly. “Retain Your Rain” is the motto of most floodplain managers. If everyone did that, there would really be “no adverse impact.”
Delaying stormwater discharges, not accelerating them, is the safest strategy.
Faster Runoff, Faster Erosion
As stormwater approaches Crystal Creek, it will encounter a steep drop that requires the use of check dams and other measures to slow water down.
Mavera runoff as it approaches Crystal Creek (left) encounters a drop that could increase erosion if not mitigated properly.
Wetlands no more. Looking east from over FM1314. Area in upper left has not yet been cleared but will be.
Land Consists Primarily of Wetlands
The hundreds of pages supplied by the Montgomery County Engineer’s Office in response to a FOIA Request show that this development tract consists “…primarily of evergreen and mixed forest and woody/herbaceous wetlands.” [Empasis added.] Yet the drainage analysis never again mentions that when it claims the development will have no adverse impact.
Looking west toward FM1314, which runs through middle of frame and US242 (upper left) Note drainage and clearing activities moving west. Area in upper right will also eventually be cleared. Note West Fork San Jacinto beyond SH242.Looking north across drainage ditch. that bisects development (see below). Many of those trees will soon be gone. The northern half of the subdivision will look like the cleared area in the foreground.Building homes over a swamp can lead to foundation shifting and cracking. Drainage from the eastern half of Mavera will flow through the concrete box culverts under FM1314 to the western half.Looking west. Note standing water in forest between ditch and SH242 (out of frame on left).Western half of development is now in initial clearing phase.Map of development showing location of drainage ditch, Crystal Creek and San Jacinto (lower left). Virtually all cleared areas to date are below the blue dotted line which represents the drainage ditch. Area below the drainage ditch appears to represent less than half of the total area.
HCFCD Position on Hydrologic Timing
Harris County Flood Control has long lobbied to eliminate hydrologic timing in drainage analyses for the reasons mentioned above. However, Montgomery County Commissioners have not acted on the proposal.
Posted by Bob Rehak on 1/23/2022
1608 Days since Hurricane Harvey
The thoughts expressed in this post represent opinions on matters of public concern and safety. They are protected by the First Amendment of the US Constitution and the Anti-SLAPP Statute of the Great State of Texas.
https://i0.wp.com/reduceflooding.com/wp-content/uploads/2022/01/20220122-DJI_0513.jpg?fit=1200%2C799&ssl=17991200adminadmin2022-01-23 17:24:002025-08-19 22:20:20New 1700-Acre MoCo Development Claims “No Adverse Impact,” But Doesn’t Study Other Areas
On Sunday morning, Jeff Miller, an Elm Grove resident who lives near Woodridge Village, reported 5.5 inches in his rain gage. That compares to a 6.24 inch rain that fell on Woodridge on May 7, 2019, when hundreds of homes in Elm Grove and North Kingwood Forest flooded. Also, Woodridge falls about 40% short of current Atlas-14 standards required to hold back floodwater from a 100-year storm.
Other important factors came into play last weekend that should relieve some of residents’ anxiety and help explain what happened.
First, remember that on May 7, 2019, Perry Homes’ contractors had clearcut 268 acres, but had barely begun work on detention ponds. Only one of five was complete.
Second, the intensity of the May 7, 2019 rain was higher than last weekend’s. On May 7, 6.24 inches fell in 5 hours. Last weekend, 5.5 inches fell in 9 hours.
Third, in 2019, the S2 detention area had been partially excavated but didn’t have any outflow control restrictions installed yet. So it didn’t really function as a detention pond.
Fourth, contractors had destroyed a berm between Elm Grove and Woodridge, and filled in a natural stream on Woodridge. Both have since been replaced.
I took the photos below Sunday morning between periodic sprinkles, several hours after heavy rain stopped. They show how the current Woodridge Village detention handled the storm. All ponds were well within their banks. One was empty.
The triangular pond on the left is N2. N1 is out of sight above it. The two ponds on the right are S1 (foreground) and S2 beyond it. N3 is out of sight at the top of the frame.
S2 was about halfway to two-thirds full.
The tail of S2 is already silting in but had plenty of room to spare.
N3 Pond on eastern edge of property was supposed to have had an outflow control device but never got one.
The Junction where water from all five ponds comes together before flowing into Taylor Gully. N3 is at top of frame.
Reverse angle shot of the Junction with Taylor Gully in the background. Note how high the detention ponds are compared to the gully.The areas that flooded so badly in 2019 are just beyond the ponds.
Water coming from the big trianglar N2 pond now has to go through these twin culverts which were almost completely inundated.
Wider shot shows volume of water backed up in N2.
Only N1 in the NW corner of Woodridge was totally dry. The outflow capacity is much greater than the inflow. So this pond provides no detention benefit whatsoever. Local resident Jeff Miller says he has NEVER seen standing water in this pond.
The thoughts expressed in this post represent opinions on matters of public concern and safety. They are protected by the First Amendment of the US Constitution and the Anti-SLAPP Statute of the Great State of Texas.
https://i0.wp.com/reduceflooding.com/wp-content/uploads/2022/01/20220109-DJI_0370-2.jpg?fit=1200%2C799&ssl=17991200adminadmin2022-01-11 16:46:412022-01-11 17:14:16Woodridge Village Detention Ponds Passed Sunday Test, But…
Ever wonder where your tax and flood-bond dollars go? Harris County Flood Control District shows all its active projects on one page. You can review those projects in tabular form or on a map. You can even click on links to learn more about each project. Or explore it in depth by going to its related “watershed” page.
Active maintenance (orange) and capital (purple) flood mitigation projects in Harris Countyas of 1/4/22 shown against backdrop of precinct boundaries adopted on 10/28/21.Purple = P1, Green = P2, Red = P3, Yellow = P4.
Paragon of Transparency
HCFCD’s Active Projects page is a paragon of government transparency. You can even switch out base maps to see where the projects fall in terms of the old or new precinct boundaries approved on October 28, 2021.
One side benefit of the two base maps is that they give you a clear, unambiguous view of the redistricting boundaries.
Zoom far enough in on the map and you can even see your street, home, and the drainage features around you (streams, channels, storm sewers, etc).
Physically seeing work in progress is difficult. Construction zones are dangerous and often fenced off or hidden behind trees. They’re also so large that seeing them from an entrance at ground level is almost impossible.
The good news: the projects almost always include hike and bike trails, like the one below, which you can enjoy upon completion.
However, if you want to monitor work in progress, your best bet is a drone.
Good News from Commissioners Court Today
Commissioner Tom Ramsey introduced a motion to affirm Commissioners’ intentions to complete all projects in the flood bond. Despite several previous attempts to cancel projects and change bond priorities, commissioners voted unanimously to complete the entire bond package. Ramsey will be the new commissioner for the Lake Houston Area if the Ellis-3 redistricting plan survives court challenges. See the sprawling red area on the map above.
Posted by Bob Rehak on 1/4/2022
1589 Days since Hurricane Harvey
https://i0.wp.com/reduceflooding.com/wp-content/uploads/2022/01/HCFCD-Actived-Project-Map-12.21.jpg?fit=1200%2C793&ssl=17931200adminadmin2022-01-04 16:43:232022-01-04 16:48:56How to Find HCFCD’s Active Projects in Your Area
Making conclusions based on hearsay or a glance at a chart could be self-defeating. There is more to the story.
Partner Funds Make It All Possible
We anticipated 43% of the dollars in the flood bond would come from partners such as FEMA, HUD and the TWDB. We also anticipated it would take another 16% in local matching funds to attract the 43%. So 59% of the flood bond revolved around partner funds. Only 41% was local cash to pay for projects totally out of pocket.
From the project spreadsheet approved by voters in 2018.
Excluding Partner Funds Could Accelerate Construction in LMI Neighborhoods, Deny Others
David Berry, the County Administrator, proposed the partnership exclusion to accelerate construction of projects in Low-to-Moderate Income (LMI) watersheds, such as Halls. Halls, in particular, has waited on grant awards from the US Department of Housing and Urban Development (HUD) longer than most.
A HUD decision is expected sometime in January, according to the Texas General Land Office, which distributes HUD grants in Texas. So it’s not clear how much residents gain by Berry’s proposal. And they could lose big.
Most of the HUD grant applications for Halls are on a 90:10 basis, meaning the local share is only 10%. So excluding these grants means increasing the local contribution for that portion of the budget by 9X. That could cost local taxpayers hundreds of millions of dollars. For instance, HCFCD budgeted $500 million for Halls drainage alone. 90% of that is $450 million…to cover 2.4% of the county!
The effect would be to take money from affluent watersheds – which don’t qualify for HUD 90:10 grants – and shift it to LMI watersheds. No one then would get the grants and something would have to give somewhere down the road.
One Third of Way Through Flood Bond: Good Time to Take Stock
At the end of this month, exactly one third (3 years, 4 months) of the 10-year flood bond will have expired. So this is a good time to review spending versus projections.
Thirty-three percent of the way in, we’ve expended a little more than 16% of the flood-bond funds. While that may sound like a slow start, one must consider project lifecycles. Projects start with studies (feasibility, preliminary engineering, final engineering, design). These determine and validate cost projections. They also form the basis for grant applications, a plan and bids. But they are the least expensive part of a project. Together, they comprise only one eighth of project costs.
The expensive parts follow. They include right of way acquisition and construction. Those comprise more than three-quarters of all project costs. See the pie chart below which shows averages for the last two decades.
Average percent of costs in various project stages since 2000. ROW (Right of Way) Acquisition includes purchase of land upon which projects will be built.
For most flood-bond projects, we’re just now getting to the expensive phases. So I wouldn’t worry too much about that 16% overall average right now.
Spent/Unspent Funds by Watershed Gives Greater Insight
You can gain more insight by looking at spent and unspent dollars in each watershed.
Height of bars shows total amount budgeted per watershed in flood bond. Blue areas show dollars spent to date. Does not include any funds spent prior to flood bond.
From the charts above and below, you can see that spending rates vary widely among watersheds. Brays has consumed 57% of its budget already. On the opposite end of the spectrum, Sims has consumed just 1.6% of its. Why the wide variation?
To understand, we need to look at unique circumstances in each watershed. The chart below makes it easier to see actual spending as a percent of the budget that voters approved for each watershed in the flood bond.
Percentages represent the portion of budget spent to date. See discussion below for explanations of ranks.
The height of some of the bars above could be “predicted” by referring to the flood bond equity prioritization framework. Brays and Greens Bayous, for instance, are two watersheds with high percentages of LMI residents (58% and 57% respectively).
But others cannot. More than half the residents in Goose Creek/Spring Gully, Hunting, White Oak, Halls, Vince and Sims Watersheds also qualify as LMI. But dollars spent to date in those watersheds are far lower as a percent of the total budget. To see why, you need to put the numbers in a bigger context that includes:
Investment Prior to Flood Bond
Size of Total Budget for Each Watershed
Percentage of Partner Funds
Grant Application Status
Stage of Project Lifecycle
Bigger Context Shows Reasons for Variance
Brays and Greens had a large number of shovel-ready projects that had already been studied and approved when the flood bond passed. They were just waiting for dollars to become available. So they had head starts.
Other factors explain LMI watersheds further down the curve:
Sims received $380 million in federal funding for 23 Army Corps projects that finished construction by 2015. As a result, Sims was the only bayou in Harris County that stayed within its banks during Harvey. None of that spending shows up in the Bond Program charts. Because it’s already done!
White Oak received full funding in the Bi-Partisan Budget Act of 2018. The Army Corps also started addressing many projects there before the flood bond.
Vince lies wholly within the City of Pasadena and is primarily the City’s responsibility.
Halls is the poorest watershed (71% LMI) and has only spent 6% of its projected budget to date. Lest you attribute this to racism, understand that the bond allocated more than HALF A BILLION DOLLARS to Halls. In percentage terms, the $29 million dollars spent to date looks small. But in absolute dollars, it outranks 15 other watersheds.
Far more affluent watersheds – such as Buffalo Bayou, Cedar Bayou, the San Jacinto River, Barker, Willow Creek, Armand Bayou, Galveston, Luce Bayou and Jackson Bayou – have each received fewer dollars from the flood bond than Halls.
HCFCD had just finished a watershed plan for Halls Bayou in 2018 when the flood bond passed. That explains the size of the watershed budget as well as the late start compared to Brays, White Oak, Greens, and Sims.
Other factors also explain affluent watersheds further up the spending curve, such as Little Cypress. HCFCD started working on that watershed long before the flood bond, too. Dollars spent to date on Little Cypress primarily reflect right-of-way acquisition costs, not construction. It’s also important to understand that the total budget for Little Cypress is only 37% of the total budget for Halls.
Creating a Win-Win For Everyone
In another three years and four months, these charts will look totally different than the ones you see today. Construction costs will surge for some and be long gone in the rear view mirror for others.
In my opinion, we need to stop creating chaos with endless tinkering in the bond program. The people have spoken. Leaders should listen. Let’s stop changing the allocation formula, focus on construction, and work like hell to win those grants. Then everybody wins.
Posted by Bob Rehak on 12/28/2021
1582 Days since Hurricane Harvey
https://i0.wp.com/reduceflooding.com/wp-content/uploads/2021/12/Flood-Bond-Allocation.jpg?fit=1200%2C804&ssl=18041200adminadmin2021-12-27 20:18:272021-12-28 13:28:32“Excluding” Partner Funds Could Lead to Shortfalls in Flood-Mitigation Funding
Harris County Flood Control District (HCFCD) has a large active construction project underway in Tomball. Phase I of the project stretches about two-thirds of a mile from SH249 to FM2920 on a tributary of Willow Creek as it arcs around a major shopping center near downtown Tomball and Lone Star College/Tomball. The project includes channel widening and deepening; dry and wet stormwater detention basins; and opportunities for recreational trails.
Limits of Phase 1 are within red oval. Additional improvements (M124-00-00-E002) will extend further south to Willow Creek itselfas additional money becomes available.
Willow Creek: A Study in Contrasts
The Willow Creek watershed is located in northwest Harris County. It drains about half of the City of Tomball. The tributary highlighted above flows through densely developed shopping and medical center areas on the northern end to agricultural and oil and gas interests on the lower end.
Looking SW at southern limit of construction toward agricultural and rural areas beyond.FM2920 leads into distance.
Looking NE in opposite direction toward area of channel widening and detention basins. SH249 cuts left to right across top of frame. FM2920 cuts through upper right corner.Tomball in upper right.
HCFCD contractors were hard at work on Christmas Eve afternoon when I took these shots.
Closer shot of detention ponds north of shopping center out of frame on the right.
Willow Creek: Present and Future
Willow Creek flows into Spring Creek just upstream of where Spring Creek crosses under I-45. The Willow Creek watershed covers about 54 square miles. The downstream end of the watershed is within the floodplain of Spring Creek.
Willow Creek Watershed and current HCFCD projects in various stages of completion. This post is about the one near the top center of the frame ending in E001.
Willow Creek watershed is mostly undeveloped. Significant development is limited to the City of Tomball and a few residential subdivisions in the lower end. The development rate has not been very rapid. However, officials expect it to increase as the City of Tomball continues to expand and urbanization from Houston stretches northwest.
This project will directly benefit mostly areas on the northwest side of the county. However, it may provide some downstream benefit by holding back water in major floods.
Goal: Contain Runoff from 100-Year Event
Phase 1 of this project began construction activities in January 2021. As funding becomes available, future phases of the M124-00-00 project will continue channel conveyance improvements and construct several more stormwater detention basins from F.M. 2920 to the confluence with Willow Creek. Phase II will also deepen the channel improvements from Phase 1 that you see above.
The overall goal of the M124-00-00 project is to enable the channel to contain the 1-percent (100-year) storm event within the channel banks based on existing watershed conditions.
HCFCD
The total project focuses on conveyance improvements of stormwater in the area, as well as reducing flood risk through construction of stormwater detention basins. Stormwater detention basins reduce flooding risks by taking in and temporarily storing stormwater during heavy rain events and releasing the water back into the waterways when the threat of flooding has passed.
Multiple new detention basins along the M124-00-00 channel will add approximately 390 million gallons of storage capacity (an approximate 2,164 percent increase in current storage capacity) to benefit the Willow Creek watershed. That’s enough to contain a foot of water falling on 1200 acres.
Posted by Bob Rehak on 12/26/2021based on info from HCFCD.org
1579 Days since Hurricane Harvey
https://i0.wp.com/reduceflooding.com/wp-content/uploads/2021/12/20211224-DJI_0258.jpg?fit=1200%2C799&ssl=17991200adminadmin2021-12-26 12:35:472021-12-27 11:40:39Willow Creek Widening and Stormwater Detention Basins Improving Tomball Drainage
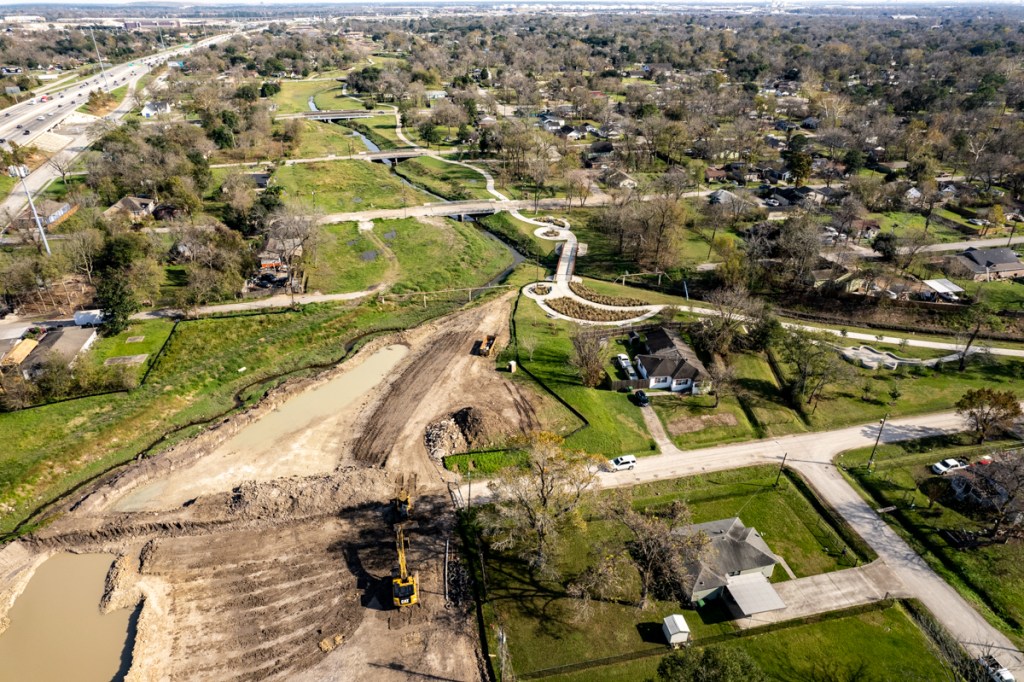
Widening of Hunting Bayou, one of the poorest and most flood-damaged watersheds in the county, is kicking into high gear.
Annual Rate of Spending Almost Quadruples since Harvey
According to data obtained as part of a Freedom of Information Act (FOIA) request, Harris County Flood Control District and its partners (mainly the Army Corps and City of Houston), spent $44 million on flood mitigation in the Hunting Bayou watershed between 1/1/2000 and Hurricane Harvey.
That averaged $2.4 million per year for those 18 years. However, in the 4 years since Harvey, HCFCD has spent $37 million – more than $9 million per year.
That rate of spending averages 3.75X higher after Harvey than before.
HCFCD Spending Data Obtained via FOIA Request
Here’s a breakdown.
From FOIA Request.Hunting Bayou flood-mitigation expenditures by time period and category since 1/1/2000 through end of third quarter 2021.
Focus of Current Construction Activities
The upstream portion of Hunting Bayou parallels the south side of Loop 610 for most of its length. Where North Loop 610 turns south, Hunting cuts under it between McCarty and Wallisville Roads. From there it continues east. It then turns southeast at San Pedro Street and eventually joins Buffalo Bayou and the Ship Channel.
Note width of floodplains in red box. HCFCD is now widening Hunting between the left and right boundaries of the box.From Harris County Flood Education Mapping Tool. Blue = 100-year. Green = 500-year floodplain.
The Hunting Bayou watershed has the second highest percentage of low-to-moderate income (LMI) residents in the county (69%) after Halls Bayou (71%) immediately to the north.
Hunting also is heavily industrialized with rail yards, tank farms, manufacturing, and shipping companies. The highest points of land are the railroad tracks. Within the red box above, you can see how they affect the flood plain.
After driving around the neighborhoods along Hunting Bayou for an entire day, it appears that the worst storm damage is in the red box above. Many homes are boarded up and abandoned in this area. Others have been elevated. Some have been renovated and are waiting for the next flood.
Current Construction Photos of Bayou Widening Efforts
HCFCD bayou-widening efforts focus on this area right now. They extend from US59 on the west to approximately Wayside Drive on the east. Bayou widening may be an understatement. HCFCD appears to be creating a long series of connected detention basins, some more than 450 feet wide and several city blocks long that narrow at bridges.
This should help drain water from nearby neighborhoods during heavy storms. See pictures below all taken on Sunday, 12/19/2021. They generally trend from west to east, starting at US59 and heading downstream.
Looking east at first of numerous ponds along channel of Hunting Bayou. Photographed from over US59. Loop 610 is in upper left.
Looking east over Hunting Street. Loop 610 on left.Note new hike and bike trails in this and other pictures below.
Looking east from Kashmere Street at a previously excavated area now covered with grass and newly excavated areas beyond it.
Looking east from over Wipprecht Street at work in progress.
Looking east toward Lockwood from Pickfair Streetand one of the constrictions mentioned above.
Closer shot of constriction at Lockwood.
Looking east from Hutcheson Park
Opposite angle. Looking west over expanse of Hutcheson Park. Loop 610 on right.
Looking NE from the eastern end of Hutcheson Park, where Hunting cuts under 610.
Looking NE from over Loop 610 toward Homestead Detention Pond in background.Kelly Street cuts left to right through top of frame.s
Looking east from over Homestead at limit of current downstream work.
Funding Flows to Damage
Altogether, the current excavation work stretches 3.33 miles.
In the last five major storms (Allison, Tax Day, Memorial Day, Harvey, Imelda), 15,763 structures have flooded along Hunting Bayou. That ranks 7th among all Harris County Watersheds. But one must remember, that Hunting, comprises only 31 square miles. That ranks it 19th in size out of 23 watersheds. The damage per square mile ranked #2 (508.5 structures).
Another reason spending has accelerated here is political policy – namely the Equity Prioritization Framework implemented a year after the flood bond passed.
https://i0.wp.com/reduceflooding.com/wp-content/uploads/2021/12/20211219-DJI_0152.jpg?fit=1200%2C799&ssl=17991200adminadmin2021-12-19 20:53:442021-12-19 23:31:42Widening of Hunting Bayou Kicks into High Gear
For years now, certain Commissioners have argued that poorer watersheds should get more help because their residents are financially less able to recover from floods. But none has ever said what a fair split should be. They just incorrectly assert that rich neighborhoods like Kingwood get all the money to justify shifting even more money toward poorer neighborhoods.
Where Money Really Goes
So let’s look at where the money is really going. Via a Freedom of Information Act (FOIA) request, I obtained Harris County Flood Control District (HCFCD) spending data by watershed dating back to 2000. The numbers below go through the end of the third quarter this year.
LMI Watersheds Already Receive 61% of All Spending
Because of damage patterns during floods and “equity guidelines” established by Commissioner’s Court, eight LMI watersheds have received 61% of all flood-mitigation spending since 2000. Fifteen other watersheds cover twice as much area but receive only 39%.
LMI = residents earning less than half of average income for region. An LMI watershed is one where more than half the residents qualify as LMI.
But the lopsided spending is even more dramatic when you look at the distribution within the LMI category. Just four watersheds have received more than half of all spending since 2000.
Spending by watershed since 2000.Includes HCFCD plus partners.
The top four LMI watersheds alone (Brays, White Oak, Sims and Greens) have received 53% of all flood-mitigation spending since 2000 even though they comprise just one quarter of the square mileage in the county.
HCFCD spending data through end of q3 2021.
Proposed Changes in Allocation Formula Could Accelerate Spending in LMI Watersheds
The changes being considered tomorrow would let projects in poorer neighborhoods move forward immediately before the status of $750 million in HUD funding becomes clear – reportedly in January. They would also let flood-bond money be used to cover street flooding, something never contemplated in the flood-bond project list and something that is not part of HCFCD’s charter.
These changes could ultimately leave projects in more affluent watersheds without enough money to complete them. For a fuller discussion of the impacts, see this post. What’s Fair?
As certain commissioners seek to increase spending in LMI neighborhoods even more, the question arises: “Are others getting their equitable share?” I’ve asked that question many times and can never get an answer. I’m always met with silence. Regardless, tomorrow, certain commissioners will try to tilt the scales even further. I’ll be watching to see how they try to justify it.
To comment on the proposal (Item 17 on the agenda), you must sign up to speak before 10:00 a.m. on Tuesday, December 14, if you attend the meeting in person. If you attend virtually, you must sign up to speak no later than 8:00 a.m. at https://appearancerequest.harriscountytx.gov/. If you sign up to speak, you will be placed in a queue and called when it is your turn.
Posted by Bob Rehak on 12/13/2021
1567 Days since Hurricane Harvey
The thoughts expressed in this post represent opinions on matters of public concern and safety. They are protected by the First Amendment of the US Constitution and the Anti-SLAPP Statute of the Great State of Texas.
https://i0.wp.com/reduceflooding.com/wp-content/uploads/2021/12/Screen-Shot-2021-12-13-at-2.58.23-PM.png?fit=1708%2C1120&ssl=111201708adminadmin2021-12-13 16:19:242021-12-13 16:22:39Should Already Lopsided Flood-Mitigation Spending Tilt Even More Toward LMI Neighborhoods?