Tag Archive for: HCFCD

Of Active HCFCD Bond Construction Spending Totaling $226 Million, Lake Houston Area Has $2 Thousand

Harris County Flood Control District (HCFCD) delivered its March 2022 Flood Bond Spending Update yesterday to Commissioners Court. It shows $226,476,745 dollars worth of active capital construction projects underway throughout the county. But only two of those valued at a grand total of $2,000 are in the Lake Houston Area.

That’s less than one-tenth of one percent, despite the fact that the Lake Houston Area was one of the most heavily damaged in the county during Harvey.

Maintenance Costs Harder to Determine

The update also includes active maintenance projects. However, those are grouped in ways that make it difficult to determine the exact cost of each. The Lake Houston Area had 3 out of 36 of those. At least one of the three is now complete. It consisted of cleaning a block-long stretch of the drainage ditch that parallels Stonehollow Drive in Kingwood. Judging by the group costs, none of the three qualifies as major.

The update does not disclose the value of past projects. Nor does it break out the value of studies, right-of-way acquisition, or future improvements.

For the full update, click here. I compiled the numbers above from the last two pages in the PDF. To see the location of projects, check the HCFCD’s Flood Education Mapping Tool. It shows the number of every ditch and stream in Harris County.

Other Insights

The report yields many insights.

  • 19.7% of the bond work has been completed as of the end of March. That’s up from 19.4% at the end of February. That percentage should increase faster as HCFCD completes more preliminary studies and moves into the expensive phases of projects, such as right-of-way acquisition and construction.
  • Of 1175 buyouts identified, 457 have completed – 39%.
  • Biggest winners to date in the flood-bond, mitigation-funding sweepstakes have been:
    • Brays Bayou – $173.1 million
    • Cypress Creek – $87.4 million
    • Greens Bayou – $82.7 million
    • Addicks Reservoir – $75.4 million
    • Little Cypress Creek – $53.7 million
    • White Oak Bayou – $53.2 million
    • Clear Creek – $38 million
    • Halls Bayou – $35.4 million
    • Hunting Bayou – $34.1 million
    • Willow Creek – $33.5 million
  • The San Jacinto River watershed has received $20.7 million despite being the largest in the county.
  • HCFCD completed two projects during the month and began construction on one other.
  • Eight other projects changed stages, i.e., from feasibility study to preliminary engineering.

“Partner Funds” To Date Virtually Equal “Bond Funds”

Virtually half of flood bond spending through the end of March 2022 came from partner funds. Local funds plus grants totaled $483 million. Money spent out of the bond itself has totaled $492 million. So, 49.5% of spending to date came from partner funds. It has gone largely to watersheds supposedly disadvantaged by partnership requirements. A popular political narrative claims low-to-moderate income watersheds get no partner funding and more affluent watersheds get it all. But that simply isn’t true.

The narrative is being used to accelerate the start of projects in LMI neighborhoods by decoupling grant approval and project initiation. However, as these numbers show, turning our backs on partnership funds could potentially double the cost of flood mitigation.

49.5% of mitigation dollars to date have come from partners. 50.5% came from the bond itself.

Glaring $750 Million Omission

Although the March update contained a discussion of several partnership grants, it failed to mention $750 million allocated to Harris County by HUD and the GLO for flood mitigation on March 18. The March update did, however, discuss several smaller grants, earmarks and partner funds. Those took up two and a half pages.

The $750 million, together with the flood resilience trust approved last year, would fully fund the flood bond. That means that no watershed should have to wait on partner funding for construction projects to begin once engineering is completed.

Only one step remains before Harris County can start using the money – approval of a “method of distribution.” That’s a final plan for how and where the money will be used.

Posted by Bob Rehak on May 11, 2022

1716 Days since Hurricane Harvey

The thoughts expressed in this post represent opinions on matters of public concern and safety. They are protected by the First Amendment of the US Constitution and the Anti-SLAPP Statute of the Great State of Texas.

TWDB grants HCFCD $2,208,906 to Expand Lauder Basin

Last month, the Texas Water Development Board (TWDB) approved a $2,208,906 grant from the State’s Flood Infrastructure Fund (FIF) to the Harris County Flood Control District (HCFCD) for expansion of the Lauder Stormwater Detention Basin.

The detention basin will eventually hold 1,260 acre-feet of stormwater in Aldine along Greens Bayou. The project will help reduce repetitive flooding in that area. It is one of dozens of such projects under construction in the watershed.

Map showing phases and location of Lauder basin.

The 86th Texas Legislature created the Flood Infrastructure Fund with voter approval through a constitutional amendment in 2019. The fund helps develop drainage, flood mitigation, and flood control projects. State Senator Brandon Creighton sponsored the bill that created the fund.

About Phase 2 of Lauder Project

This particular TWDB grant will help enable Phase 2 of the Lauder Stormwater Detention Basin project (Bond ID C-34).

“We are extremely thankful for this funding and for the support of the Texas Water Development Board to improve flood resilience for residents in the Greens Bayou Watershed,” said Tina Petersen, Harris County Flood Control District Executive Director.

HCFCD finished Phase 1 of the Lauder Stormwater Detention Basin project in the fall of 2021. Phase 2 will provide additional stormwater detention in the former Castlewood development. Homes built there have been bought out.

HCFCD estimates the total cost of Phase 2 will be approximately $20.5 million. The additional capacity in Phase 2 will hold excess stormwater during heavy rain events and then release it slowly back to the channel when the threat of flooding has passed.

Phase 2 will be broken into two compartments.

  • Compartment 1 will bid later this month. Construction will start later this year and finish in 2024.
  • Compartment 2 (which TWDB is funding) is currently will be in design until 2023. Construction will begin in April 2024 and complete in early 2025.

Photos of Areas Involved

Phase 1 included a wet-bottom stormwater detention basin, with a permanent pool and features designed to improve stormwater quality.

Lauder Detention Basin on Greens Bayou as of 10/12/2021
Lauder Detention Basin Phase 1 on Greens Bayou (right) as of 10/12/2021. Looking SSW toward Lauder Road.

Phase 2 will be a dry-bottom stormwater detention basin with opportunities for recreational development by other entities. It will be in the wooded area (top center) of the photo below.

Lauder
HCFCD will construct Phase 2 of the HCFCD Lauder Detention Basin in the wooded area (top center) along Greens Bayou (upper right). Looking northwest toward Greenspoint area.

Garcia Lauds Lauder Progress

“Reducing chronic flooding has been my main priority since taking office. This Lauder Stormwater Detention Basin project represents the kind of progress residents expect and need to see, and we are grateful for the Texas Water Development Board’s support in making this critical project possible,” said Harris County Precinct 2 Commissioner Adrian Garcia. 

“Making Harris County businesses and homeowners safer from flood events requires a commitment to make smart investments, like the TWDB’s. If we want to see our community thrive, we have to ensure families and companies can confidently grow in areas where their businesses and homes are free from flood fears,” he continued.

Relief from Repetitive Flooding

TWDB Chairwoman Brooke Paup said, “We’re proud to provide grant funding for this much-needed project, which has been a team effort, and to partner with our good friends at the Harris County Flood Control District. The TWDB works diligently to help communities across the state, but it’s especially fulfilling to be a partner in helping an area see some relief after experiencing repetitive flooding.”

Absorbs a Foot of Rain Falling Over 2 Square Miles

The two basin phases will hold at least 1,260 acre-feet, or 391 million gallons, of excess stormwater that might otherwise flood homes and businesses.

To visualize an acre foot, think of a football field with a foot of water on it. Now imagine that water extending upwards 1260 feet!

Another way to think about that is to visualize water spreading out horizontally. 1260 acre feet would would be a little less than two square miles. (A square mile comprises 640 acres.) So the two basins would hold a foot of rain falling over two square miles!

Looking at the Atlas 14 Rainfall Probability table below, the two phases would hold a 24-hour, 25-year rain falling over 2 square miles.

atlas 14 rainfall probabilities
Atlas 14 rainfall probabilities for northern Harris County

Flood-Risk Reduction Status

But the service area for the basins is bigger than 2 square miles. So the ponds won’t be enough by themselves to provide protection in a 25-year flood. That’s when other Greens Bayou projects will help. Together, the projects in the Greens Bayou Mid-Reach Program, when all are complete, should protect residents in a ten-year rain. See 10-year column in table above.

The two phases of the Lauder basin by themselves should reduce the risk of flooding for more than 4,500 structures in the 100-year floodplain. Learn more about the Lauder Basin at www.hcfcd.org/C34.

Overall, the flood bond allocated $280 million for Greens Bayou improvements. So far, HCFCD has spent $104 million in bond funds on those projects. So 63% the planned budget remains.

Posted by Bob Rehak on 5/10/22

1715 Days since Hurricane Harvey

Mitigation Update: 3rd Anniversary of First Elm Grove Flood

Back in 2019, portions of Elm Grove and North Kingwood Forest Villages flooded twice. The first time occurred on May 7th. According to Harris County Flood Control District’s (HCFCD) report on the storm, “A 30-min rate of 2.9 inches was recorded at US 59 and the West Fork of the San Jacinto River and a 1 hour rate of 4.0 inches.”

“380 structures were flooded in the Elm Grove Village subdivision and other nearby subdivisions in the northern portions of Kingwood.”

Investigation by HCFCD the following day revealed that “… the flooding was potentially caused by development upstream in Montgomery County that sent large volumes of sheetflow into the subdivisions and Taylor Gully.” This video shows the sheetflow pouring out Perry Homes’ Woodridge Village property into homes along Village Springs Drive.

Perry contractors had clearcut 267 acres without installing the required detention ponds when the rain hit.

In the three years that followed, I posted 242 reports about every aspect of that flood and a second one during Imelda. The second flood affected two to three times more homes in the same areas.

The floods triggered multiple lawsuits which Perry Homes, its subsidiaries and contractors finally settled late in 2021.

What It Looked Like

Shady Maple the night of the May 7 2019 flood
Escape. In Elm Grove on Shady Maple the night of the May 7, 2019 flood.
High water rescue
Rustling Elms Bridge in Elm Grove underwater as school bus tries to cross it.
Water in Keith Stewart's home on Shady Maple after May 7th flood in 2019.
Water rising at night in Keith Stewart’s home on Shady Maple after May 7th flood in 2019.

Catalog of Flood Mitigation Efforts

Ever since the Elm Grove floods, Harris County, HCFCD, the City of Houston, Congressman Dan Crenshaw’s team and others have worked diligently to reduce future flood risk.

On this Mother’s Day weekend, it may bring flooded families comfort to understand how far we have come. Much remains to do, but much has already been done, or at least started.

Major Maintenance on Taylor Gully

Even before the second flood, HCFCD undertook a major maintenance project on Taylor Gully to remove accumulated sediment and restore channel conveyance.

The project began in 2019. Work extended downstream to the natural portion of the channel. It finished in 2021.

Taylor Gully maintenance
HCFCD working to remove sediment buildup in Taylor Gully near the Maple Bend Bridge in January of 2021. The work began upstream near Rustling Elms in July 2019.

Kingwood Area Drainage Analysis and Taylor Gully Study

In 2019-20, HCFCD, Lake Houston Redevelopment Authority (TIRZ 10), and City of Houston teamed up to conduct a drainage analysis for all streams in the Kingwood area. A recommendation to prioritize engineering of drainage improvements along Taylor Gully (including Woodridge) came out of that study.

The Flood Control District began preliminary engineering study on the Taylor Gully improvements in 2021. HCFCD anticipates presenting results during late summer or early fall this year.

Purchase of Woodridge Village By County and City

In early 2021, the Flood Control District and the City of Houston partnered to acquire the 267.35-acre Woodridge Village property for approximately $14 million.

They closed on the purchase of Woodridge Village in March 2021.

Houston Mayor Pro Tem Dave Martin lobbied the City to purchase about 70 acres of the property.

HCFCD will use the remaining 194.35 acres of the Woodridge site for stormwater detention. That will help reduce flood risk.

Crenshaw Earmarks

Congressman Dan Crenshaw secured an earmark for $1.6 million for engineering of flood mitigation improvements along Taylor Gully. The engineering should shrink the floodplain. That will effectively remove 387 structures from the floodplain and has the potential to remove another 62.

Crenshaw also has another earmark pending for $10 million to actually construct the improvements recommended by the study.

Local groups must spend earmarks during the fiscal year in which Congress approves them. So funding can’t get too far ahead of the engineering.

Taylor Gully Preliminary Engineering Study

The Taylor Gully study will look at Woodridge in conjunction with other potential Taylor Gully improvements. However, HCFCD must perform additional preliminary engineering to further evaluate specific alternatives for Woodridge and determine the best. 

During each study, HCFCD will hold Community Engagement Meetings to present alternatives and gather feedback.

Excavation & Removal Contract

In January 2022, HCFCD began work on a Woodridge Excavation and Removal (E&R) project.

Start of the new floodwater detention basin that could double the capacity on Woodridge Village.This pond should ultimately expand beyond the lone trees in the middle of the frame near the top. Photo taken 4/30/22.

E&R projects provide a head start on the excavation process and risk reduction. They can start before the design of a stormwater detention basin. Contractors excavate a set amount of material within an agreed-upon timeframe and general area.

The excavation can also potentially provide interim stormwater storage while awaiting the design and construction of the final stormwater detention basin.

As of April 30, 2022, 36,421 cubic yards of material has already been removed from the site. See photo above taken that day. The project will remove as much as 500,000 cubic yards of soil and other material.

Woodridge will remain an active construction zone for up to three years.

Have a Happy Mother’s Day this weekend.

Posted by Bob Rehak on 5/6/2022

1711 Days since Hurricane Harvey and 1096 Days since May 7, 2019

The thoughts expressed in this post represent opinions on matters of public concern and safety. They are protected by the First Amendment of the US Constitution and the Anti-SLAPP Statute of the Great State of Texas.

Progress Report New Woodridge Village Floodwater Detention Basin

A new floodwater detention basin that will ultimately more than double the capacity of Woodridge Village is expanding slowly but steadily. To date, 33,159 cubic yards have been excavated! The pictures below show progress since the start of work in late January.

Photos showing Progress

Harris County Flood Control District (HCFCD) announced the project on 11/24/2021. Excavation started on 1/27/22.

beginning of Woodridge Village excavation
First truckloads of of excavated material leave the southwest corner of the site on 1/27/22. Looking SW.
Wider shot taken on same day looking NE looking in opposite direction. The new basin will eventually expand to cover most of the area within the road, tree-line on the left, and the ditch that bisects the property from left to right.
Photo taken on 2/14/22 shows the excavation expanding. Looking SW.
Four days later. 2/18/22. Looking SW toward entrance.
Another three days later, on 2/21/22.
3/10/22
3/22/22 after a 2.26 inch rain.
3/28/22. Looking NE.
4/17/22. Looking SW.
Basin will ultimately expand to green boundary.

About Vendor’s Contract

The stormwater detention basin still has a long way to go before it reaches its ultimate size. HCFCD is excavating it under the terms of an E&R (Excavation and Removal) contract with Sprint Sand and Clay.

Sprint has agreed to remove up to 500,000 Cubic Yards of dirt for only $1,000. However, it has the right to sell the dirt at market rates to make a profit. But the dirt can only elevate structures outside of current floodplains.

Three Months Into Contract, Beating the Minimums

When Perry Homes finished its planned floodwater detention basins, it had enough capacity to hold a hundred year rain as defined by pre-Atlas-14 standards. But capacity fell 40% short of Atlas-14 requirements.

The addition of the new detention basin should take capacity well beyond Atlas-14 requirements and create a safety margin that accommodates additional upstream development.

Excavation under an E&R contract can have ups and downs. When construction booms, excavation moves along quickly. But when construction slows, excavation can, too. However, the contract does have minimum excavation requirement of 10,000 cubic yards per month written into it.

At 36,000 cubic yards after roughly 2.5 months, Sprint exceeds the minimum. But if that rate continues, it could take another four years to reach 500,000 cubic yards.

At some point, the county may choose to step in and pay market rates for excavation to speed things up. But until then, every truckload hauled out of Woodridge Village by Sprint will reduce the ultimate cost.

Posted by Bob Rehak on 4/18/2022

1693 Days after Hurricane Harvey

Flood Bond Progress: 35% Time Elapsed, 19.4% Money Spent

A February update by Harris County Flood Control District (HCFCD) on the status of the 2018 Flood Bond showed that 35% of the way into the program (42 out of 120 months), 19.4% of the funds from all sources (including grants and partnerships) had been spent. That percentage was based on $967 million spent out of $5 billion projected.

Cost of Studies vs. Construction

While one percentage seems to lag the other by a factor of almost 2X, HCFCD estimates it is virtually on schedule. That’s because studies conducted up front cost far less than construction. And only 44 of 181 Bond program projects have entered construction at this point (24%). As more projects enter the construction phase, the pace of spending should accelerate.

From High-Level Summary to Nitty-Gritty Detail

The 13-page update features three major sections:

  • Summary statistics for the entire bond program
  • Project flow charts showing status of all projects
  • Watershed maps showing the amount spent to date; funded to date; and the values of all active maintenance and capital projects.
Spending by watershed on HCFCD flood bond projects through the end of February 2022.

Skewed Distribution of Capital Improvement Projects

Out of 75 active capital improvement projects, I counted only 13 in Precincts 3 and 4 which have Republican commissioners. Those contracts totaled only about $82 million out of about $249 million. That’s a testament to how thoroughly the Democrat-controlled Commissioners Court has relentlessly tweaked the Equity Prioritization Framework. For instance…

In northeastern Harris County, the update shows only two active capital projects valued at a whopping $1,000 each.

Of the 13 active capital projects in Precincts 3 and 4, six are E&R contracts valued at just $6,125 altogether. See page 13. The report lists no E&R contracts in Precincts 1 and 2.

Excavation and removal contracts let contractors sell dirt they remove from a site as a way of making back their normal profit margin. They’re a good deal for taxpayers as long as the demand for fill dirt remains high. But if demand slows, excavation progress could stall. In other words, they come with uncertainty attached.

Breakdown of San Jacinto Watershed Projects

Of ten bond projects listed in the San Jacinto Watershed, schedules show:

  • 4 in the feasibility-study phase
  • 2 in preliminary-engineering reviews
  • 1 in construction
  • 3 not yet started.

To see the full February Update presented at the March 22, 2022 Commissioner’s Court Meeting, click here.

The February report did not address a method of distribution for $750 million allocated by HUD and the GLO for flood mitigation to Harris County. The award happened on March 18, 2022 and will likely be covered next month.

Posted by Bob Rehak on 3/30/2022

1674 Days since Hurricane Harvey

Severe Weather Threat Increasing for Tomorrow, Up to 7″ Now Possible

Severe Weather, Flash Flood Likelihood Increasing for Monday Afternoon into Early Tuesday

Updated at 7:30 PM:

According to Jeff Lindner, Harris County Meteorologist, a powerful storm will move into Texas over the next 24 hours bringing multiple hazards to the area. The chances of severe weather and heavy rainfall by Monday afternoon and evening continue to increase. They are also expanding over a wider area. Since the original post, Harris County’s Meteorologist, Jeff Lindner has raised concerns about rises on the San Jacinto River West and East Forks to flood stage over the next few days. Rises on other creeks and bayous in Harris County also look likely, especially where we experience cell training and higher rainfall totals. Lindner advises to monitor weather closely on Monday and Monday night.

Outlook tomorrow for severe weather from the NWS Storm Prediction Center.

Higher Likelihood of Severe Weather Including Tornados Starting Monday Afternoon

There were some doubts yesterday about the likelihood for supercells to develop. But as we get closer to the storm’s arrival and certainty increases, supercell formation looks increasingly likely. “All severe modes will be in play including tornadoes, large hail, and damaging winds,” says Lindner. “There could be a few strong tornadoes, especially for locations north of I-10.” Yesterday, the main likelihood was north of SH105.

The National Weather Service Storm Prediction Center has expanded the enhanced risk (3 out of 5) outline to include more of Southeast Texas. The severe threat will begin in the mid-afternoon hours on Monday and continue into the late evening hours.

6-7 Inches, Flash Flooding Possible 

While the heaviest rainfall will likely occur over North Texas, the potential for high-precipitation supercells to develop and train across Southeast Texas is increasing for Monday afternoon and evening. As the front slows over Southeast Texas Monday night, Lindner expects the severe threat to gradually shift toward heavy rainfall and possible flash flooding throughout the night.

The greatest threat will generally be along and north of I-10. A slow-moving line of supercells will raise the flash-flood threat. If you get caught under one that’s training across your area as we saw back in January, be prepared.

Lindner has virtually doubled his rainfall predictions since yesterday. Instead of widespread 0.5-2 inches across the area, he now sees widespread 3-4 inches. And whereas yesterday he saw isolated rainfall totals up to 4 inches, today he estimates up to 6-7 inches.

Hourly rainfall rates of 2-3 inches will be possible leading to rapid onset flash flooding over urban areas. Street flooding will be the primary threat, but under corridors of excessive rainfall, significant rises on creeks and bayous will be possible.

Jeff Lindner, Harris County Meteorologist

In an update at 7:30 PM Sunday night, Lindner specifically mentioned the possibility of the East and West Forks of the San Jacinto rising to flood stage if we receive the higher rainfall totals in the forecast.

The NWS Weather Prediction Center has upgraded the area north of the I-10 corridor to a moderate risk for flash flooding.

National Weather Service outlook tomorrow for excessive rainfall.

Monday afternoon and evening will be active over the area. So have multiple ways to receive warnings. Make sure you have fresh batteries in your weather radio and flashlights; it could be a long night.

Putting Forecast in Perspective

To put this in perspective:

  • The supercells that spawned tornadoes over Kingwood in January dumped approximately 5 inches of rain. I talked with a lady on Facebook this morning whose home was destroyed by a tornado in that storm. She said she received warnings seconds before the tornado struck. She barely had enough time to get to an interior hallway before her home started crumbling around her.
  • The May 7th, 2019, storm that flooded more than 200 homes in Elm Grove dumped 7 inches of rain. But less than 20% of the floodwater detention capacity on Woodridge Village had been built at that point.
  • The City announced at 5:15 this afternoon that it will lower Lake Houston by 1 foot starting tonight. A forecast greater than 3 inches triggers the Lake Houston lowering protocol.

How To Get Warnings

NOAA broadcasts warnings on weather radio in a continuous loop during emergencies.

The National Weather Service lets you sign up for watches and warnings for your address.

Harris County’s Flood Warning System also lets you sign up to receive rainfall or flooding alerts for your location. The site also contains maps that show real-time rainfall, and river-channel monitoring and forecasting at gages throughout the region.

USGS has a web app called Water On the Go that shows water elevations at flood gages wherever you go in Texas.

Harris County Flood Control District’s Storm Center can connect you to a wide variety of preparedness articles and ways to summon help in an emergency.

A number of companies offer good apps for cell phones that offer warnings. I especially like one called Dark Skies that bills itself as “hyper-local” weather. It frequently tells me to the minute when a storm will arrive at my exact location…wherever I am.

You can also find links to dozens of other weather related apps and sites on my Links Page. Check them out before the storm arrives. You never know when a storm will knock out a web site, a cell tower, or power. So be prepared with multiple backups.

Posted by Bob Rehak on 3/20/2022 based on input from the NWS, HCFCD and City of Houston

1664 Days since Hurricane Harvey

April 7 Meeting on Spring Creek Flood Control Dams

Spring Creek Flood Control Dams are back in the news. The San Jacinto River Authority (SJRA) recently announced the first of three meetings related to a feasibility study. So save the date – April 7.

According to Matt Barrett of the SJRA, this feasibility study is a continuation of the Spring Creek Siting Study which came out of the San Jacinto Regional Watershed Master Drainage Plan project (SJMDP). The Harris County Flood Control District (HCFCD) and multiple partner agencies including SJRA developed the Master Drainage Plan. 

Overview of Feasibility Study 

The Spring Creek Siting Study from December 2020 explored multiple alternative locations that could provide flood-mitigation benefits to the Spring Creek watershed. Two of the more cost-effective were dams on Walnut and Birch Creeks.   

The Spring Creek Flood Control Dams Feasibility Study will include:

  • A conceptual design for each dam
  • Benefits and costs for each dam and a combination of the two dams.  

The goal: to determine the most feasible and economical alternative(s) for possible future design and construction. 

The cost of the study is estimated at $1 million. The Texas Water Development Board (TWDB) Flood Infrastructure Fund (FIF) grant program will provide half.  City of Humble, HCFCD, and five (5) Municipal Utility Districts will fund the other half.  SJRA is performing in-kind services to reduce the local match amount to be funded by the Partners. 

One Crucial Step of Many

This project is currently only in the feasibility phase. Construction of one or both dams, if feasible, would likely not occur for several years. Partners still need to identify a project sponsor and funding. They also need to perform final design, obtain environmental permits, and acquire land.

Details of Public Input Meeting

Public input and participation are critical components of this study, and SJRA wants to hear from you.  A public meeting related to the study will be held on/at the following date and location:

Thursday, April 7, 2022 

6:00 p.m. to 8:00 p.m. 

Fields Store Community Center 

26098 FM 362 

Waller, Texas  77484 

The meeting will be in an open-house format, allowing members of the public to come and go at their convenience at any time between 6:00 p.m. and 8:00 p.m.  A five-minute, high-level, project-summary presentation will be given at 6:00 p.m., 6:30 p.m., 7:00 p.m., and 7:30 p.m.  

Between these presentations, project team members will answer questions and collect input.  If you can’t attend in person, you can view the summary presentation on SJRA’s Facebook page following the meeting. You may also submit questions via email and the project team will answer them. 

Project Location

Below, see preliminary maps.  These project areas could change based on the results of study efforts. 

The proposed Spring Creek Flood Control Dams would lie in far northeastern Waller County, a few miles west of Magnolia in Montgomery County.

The next map shows parcels of land that partners would need to acquire to develop the project(s).

Preliminary map of Birch and Walnut Creeks flood control dams. Extent of inundation limits subject to change during study.
One more public engagement meeting will be held this summer. The third will happen after partners release the draft report in February, next year.

Projected Benefits of Projects

As presently conceived, the Birch Creek dam could reduce water surface elevations by a half foot in a 100-year storm for almost 26 miles downstream. The larger Walnut Creek dam could produce a similar benefit for 41 miles downstream.

Each would cut the annual chance of exceedance (ACE) in half for the people in the affected areas. Thus, a hundred year storm would only have the impact of a 50-year storm.

Barrett currently estimates that the Birch Creek Dam could remove 815 structures from the 100-year floodplain and the Walnut Creek Dam could remove 1205. However, he also points out that those numbers will likely change as a result of updated modeling in the current study now underway.

How much would these dams benefit people in the Lake Houston Area? Barrett admits the impact would be small that far downstream. But he also points out that these represent the first two of 16 similar projects proposed in the Master Drainage Plan, and that they could have a major cumulative impact.

Every little bit helps. Even if you can’t attend the meeting, I hope you submit a public comment via email in support of the project.

How to Learn More and Provide Public Comment

For a fact sheet on each of the two proposed dams, click here.

For more information about the Spring Creek Flood Control Dams Feasibility Study, please visit www.SpringCreekStudy.com.

You can submit comments at the public meeting and throughout the duration of the study. Email comments to floodmanagementdivision@sjra.net, or submitted online at www.SpringCreekStudy.com

Posted by Bob Rehak on 3/18/2022

1662 Days since Hurricane Harvey

Next Challenge For City: Ditch Clean Out in Right of Way Under Kingwood Drive West of High School

About a half block west of Kingwood High School, G-103-36-03, a small drainage ditch without a name, cuts under Kingwood Drive. More than a hundred homes near this ditch flooded during Harvey. Before Imelda, Harris County Flood Control District did an emergency “de-snag” on the ditch. That means they cleaned out fallen trees that were forming “beaver dams” and backing water up.

But the right of way under Kingwood Drive has remained about half blocked by sediment. That’s what those red warning signs represent in the picture below. Clearing the right of way is the City of Houston’s responsibility.

Now, would be a good time to clean out this ditch while the City has crews working a block east of here at Kingwood High School.

Location of Blockage

Screen capture from HCFCD’s Kingwood Area Drainage Assessment. The purple in the upper right is Kingwood High School.

When I clicked on the upper warning sign, I found a link to this image from 2019.

Sediment and vegetation half blocking twin culverts under Kingwood Drive in 2019. Photo by HCFCD looking south from north of westbound lanes.

Pictures Taken Today Show Same Blockages

Here’s how the same scene looked on 3/8/22. The ditch stops before it even reaches the culvert.
Closer shot of same culverts shows sediment and vegetation blocking culvert entrances.
Still looking south, but across the median toward the eastbound lanes.
Looking north from eastbound lanes at sediment and vegetation blocking the ditch as it goes through the median of Kingwood Drive.

I’ve brought this issue to the attention of Mayor Pro Tem Dave Martin and his staff. I’m confident this was just an oversight and look forward to doing another positive story when they complete this job, too.

Posted by Bob Rehak on March 8, 2022

1652 Days since Hurricane Harvey

City De-Silting Channel Under Kingwood Drive Near High School

Last week, the City of Houston started clearing debris from the culverts under Kingwood Drive near Kingwood High School. Local flood-fighter Chris Bloch has been working for years behind the scenes to document drainage issues such as this one and convince local officials to address them.

Un-named and Long-Forgotten Tributary Finally Getting Attention

One of Bloch’s latest investigations has been an uncatalogued and long-ignored channel under Kingwood Drive. It helps drain Kingwood High School into Bens Branch. But it doesn’t show up anywhere on Harris County Flood Control District maps.

HCFCD’s Flood Education Mapping Tool. Red oval indicated approximate area of uncatalogued ditch.

Two Feet of Sediment Block Culverts Under Kingwood Drive

Bloch says, “The channel originates at Kingwood High School’s athletic fields. The ditch is narrow and full of sediment and vegetation. Side channels, which empty into this ditch, are also full of sediment and vegetation. This is the only ditch providing storm water drainage from the high school campus.”

The high school building suffered $67 million in damages during Harvey and lost another $10 million in contents.

The ditch in question passes through three culverts under the Westbound lanes of Kingwood Drive. They are obstructed by 24 inches of sediment and debris. See below.

Blocked culverts under Kingwood Drive are finally being cleared. Photo courtesy of Chris Bloch.

“Debris indicates stormwater runoff from the campus passes over Kingwood Drive due to the poor conveyance capacity of this ditch.”

Chris Bloch, Kingwood Resident and Retired Engineer

“If cleared of sediment, the cross section area of the three culverts would total 60 square feet.

More Blockages Downstream

After crossing under Kingwood Drive, the ditch funnels water into a 24-inch corrugated plastic culvert. That carries it across the Kingwood Country Club Driving Range. “This cross-sectional flow area of this culvert is only about 5% of the total area of the three culverts that pass under Kingwood Drive,” says Bloch.

Later, as the ditch crosses two fairways on its way to Bens Branch, sediment and vegetation again partially block it. They also partially block the three culverts under Centerpoint’s easement near Bens Branch.

Bloch believes, “Maintenance and improvement of this ditch upstream of these outfalls would significantly improve drainage of the high school campus.”

Ensuring Long-Term Maintenance

“Although the Harris County Flood Control District (HCFCD) has no property rights for this channel, the District may be willing to partner with property owners to improve drainage,” says Bloch. “The original channel was reported to have been installed by Humble ISD (HISD) prior to the existence of the driving range.”

Bloch says he has been communicating with HISD, HCFCD and the City of Houston about the poor condition of this ditch since 2020. “I recently communicated with Mayor Pro Tem Martin’s office about this ditch and spoke with Mayor Pro Tem Martin himself about it. The de-silting is another small step forward for flood mitigation in Kingwood. I appreciate the involvement of Mayor Pro Tem Martin.”

“Recently, HCFCD indicated they would be willing to partner with the property owners of this ditch to improve drainage. Hopefully, once the City completes the sediment removal of the channel on the Kingwood Drive right of way, HISD and the Country Club can get together with the HCFCD to improve drainage across the Country Club property to Bens Branch,” says Bloch.

To see Bloch’s full report, click here.

Posted by Bob Rehak with thanks to Chris Bloch and Mayor Pro Tem Dave Martin

1650 Days since Hurricane Harvey

Latest Flood-Mitigation Funding Trends

New data obtained from Harris County Flood Control District via a FOIA Request breaks down flood-mitigation funding by watershed through the end of 2021. It shows where your flood-bond money is going. It also debunks some popular myths. Those include the oft repeated:

  • Rich watersheds get all the funding; poor watersheds get none.
  • Partner funding favors rich watersheds because home values are higher.
  • HCFCD has historically discriminated against low-to-moderate income (LMI) watersheds.

Eight out of 23 watersheds in Harris County have a majority of residents that fall into the LMI category. That means a majority make less than the average annual income for the region. As the data below shows, those eight LMI watersheds get the vast majority of county, partner, and total funding. In fact, four have received 54% of total flood-mitigation funding since 2000.

Funding now correlates more highly with LMI population than damage!

Data also calls into question why some feel compelled to tweak the equity prioritization framework endlessly.

Improved Basis for Reporting

Before I dive into the data, though, let me point out that between the 3Q21 and the end of last year, the county changed the way it compiles historical data. Instead of using the start/stop dates in project management software and reporting only completed projects, the county is now using invoice dates. This produces much higher accuracy. Dollars do not spill over from one period into another. The new data also reflects spending on projects that are ongoing, but still open.

In response to my FOIA Request, the county provided spending using both the old and new methods. They differ by roughly $615 million. Of that, approximately $215 million reflects actual fourth-quarter spending and $400 million reflects the change in when expenses are recognized.

Spending by Watershed

The rank order of spending by watershed has not changed much since last year. Several watersheds moved up or down by a place or two.

The top four are still the top four in the same order. But some of the amounts changed radically, mostly due to the change accounting. For instance, White Oak increased from $387 million to $521 million. But out of the $134 million difference, $102 million comes from when expenses are recognized.

Because this gets so confusing, and because the rank order did not change much, I will use only the new totals compiled by invoice date from now on. I will not compare old and new totals based on the different accounting methods.

Spending by watershed between 1/1/2000 and 12/31/2121 broken down by county and partner contributions, and LMI/Other watersheds.

Graphs of Spending

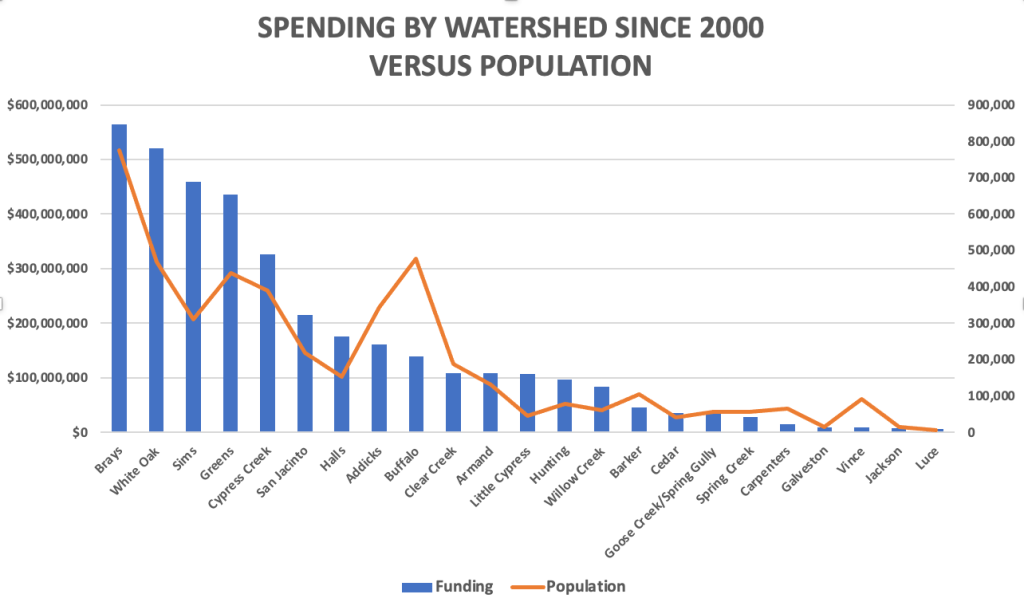
Here’s a graph of total funding by watershed since 2000, arranged from highest to lowest.

Watersheds rank ordered by amount of flood-mitigation funding received between 1/1/2000 and 12/31/2121.

Funding correlates with population. But you can see notable exceptions below. Some watersheds get far more funding than their proportion of the population, i.e., White Oak, Sims and Greens. Others get far less.

Spending is not allocated proportionately to population in all cases. Six out of eight LMI watersheds received more funding than their population alone would justify.

But population alone does not tell the whole story. Some watersheds are huge and some small. So I also looked at population density per square mile. The curves correlated even less.

Graphing population density vs. total spending shows more variance. Of the eight LMI watersheds, four (Brays, White Oak, Sims, and Greens) get far more than their population density alone would dictate.

As we saw last year, funding flows primarily to damage. The chart below plots funding versus the total number of structures in each watershed damaged in five major storms (Allison, Tax Day, Memorial Day, Harvey, and Imelda). The slope of the curves closely match. But several major exceptions exist.

Historical Discrimination?

Many community groups from LMI neighborhoods have alleged historical discrimination in the distribution of flood-mitigation funding. I just don’t see it. All of the pie charts below take into account all funding between 1/1/2000 and 12/31/2021 based on invoice dates.

The county itself sent almost 60% of its flood-mitigation funding to one third of the watersheds with majority LMI populations.
An even larger percentage came from partner funding.
Whether you look only at county funding, partner-funding, or the total, the picture is still roughly the same. One third of the watersheds get almost two thirds of the funding.
Top 4 include Brays, White Oak, Sims and Greens. All have an LMI percentage higher than 50%.

LMI Population Now Correlates Higher with Funding than Damage

A coefficient of correlation of 1.0 is considered perfect. A good example: between gallons of gas in your car and the distance they will take you.

As a result of the constant tweaking of the equity funding formula, “Population” and “LMI Population” now correlate more highly with “Funding” than “Damage.” The correlation between “Funding since 2000” and:

  • Population Density = .54
  • Damage = .85
  • Population = .87
  • LMI Population = .89

Statisticians consider all of the last three very high.

With all the rhetoric flying around these days, it’s more important than ever to have facts to base your decisions on. To see all the original data from my FOIA Request, click here.

Posted by Bob Rehak on 2/26/2022

1642 Days since Hurricane Harvey