Tag Archive for: City of Houston

October 2020 Gate Update

On Friday, October 16, 2020, stakeholders in the Lake Houston Spillway Improvement Project met at the dam to review gate alternatives and progress on the project. The main item of interest: a review of options still under consideration to increase the outflow during major storms, such as Harvey.

History of Project

Shortly after Harvey, representatives from the Lake Houston Area identified “increasing outflow” as one of the main strategies to reduce flooding. Harris County Flood Control District even conducted a pilot study. Flood Control included $20 million for the project in the 2018 bond fund (CI-028). With matching funds identified, grants were then written.

FEMA approved the project. And in April of this year, the clock started ticking on the first of two phases.

Phase One Includes…

Phase One includes preliminary engineering and environmental permitting. It should take 18 months and is on schedule at this point. A key deliverable for phase one is verification of the benefit/cost ratio. But, of course, to determine that, you need to know the cost.

Alternatives Still Under Consideration

FEMA allotted 18 months for Phase 1. We’re six months into that. Work to date has focused on determining the optimal alternative. Five remain:

  1. Expanding the existing spillway by adding new tainter gates
  2. Adding a new gated spillway within the east embankment
  3. Creating a new uncontrolled spillway within the east embankment
  4. Building crest gates within the east embankment
  5. Developing crest gates within the existing spillway

Tainter gates lift up from a radial arm. The tainter gates on Lake Conroe have 15X more release capacity than the lift gates on Lake Houston.

Crest gates flop down from a bottom hinge.

Above: the current conditions at the Lake Houston Dam. Looking slightly upstream. East is on the right.

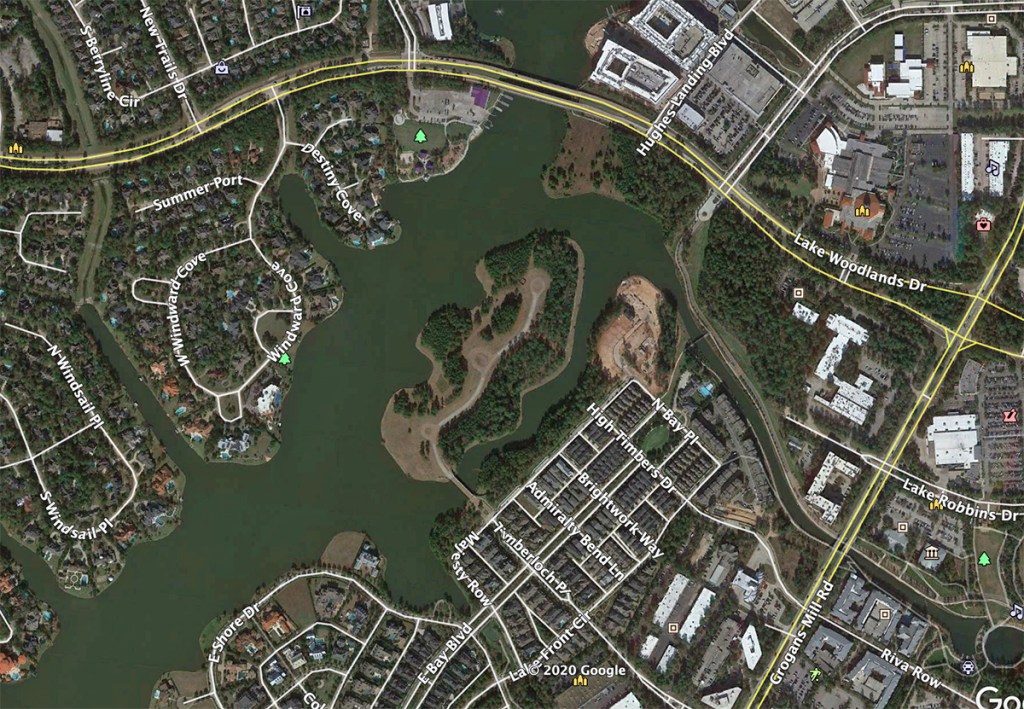
The east embankment is a solid earthen area 2800 feet long east of the spillway and existing gates. Water cannot get over it in a storm. By adding various structures in this area, engineers could widen the current spillway capacity, allowing release of more stormwater.

One main benefit: additional gates would reduce uncertainty associated with pre-releases. Operators could wait longer until they were certain an approaching storm would not veer away at the last minute. That would avoid wasting water.

Reverse angle. Note the difference in height between the east embankment (left) and the spillway (right). Looking downstream toward Galveston Bay.
Looking west toward Beltway 8. This shows the major segments of the dam.

Benefit/Cost Ratio Must Be > 1.0

The lake-level reduction benefits of these gate alternatives during major floods range up to roughly 8x. The costs also vary by roughly 4x. Those are order-of-magnitude, back-of-the-envelope estimates and far from final. Much hard work remains to develop tighter costs and tighter estimates of flood-level reductions. The latter will determine flood-prevention savings in a storm. And the benefits divided by the costs will determine the benefit/cost ratio.

In FEMA’s eyes, the benefit/cost ratio must exceed 1.0 to justify the project. Said another way, it must produce more benefits than it costs.

FEMA allotted 18 months for phase 1. We’re six months into that phase with a year left. Project partners expect results of the alternatives analysis before the end of the year.

Benefit/Cost Calculation

Given the ballpark costs of some of these gate alternatives, we will need very tight estimates of the benefits.

Potential Benefits include:
  • Upstream flood risk reduction
  • Reduced maintenance (debris management) for CWA
  • Improved Water Quality (post storm)
Potential Impacts include:
  • Increased scour and erosion potential to wetlands downstream
  • Increased water surface elevations to structures downstream
Calculating Benefits

Benefit Cost Ratio = (Net Present Value of Benefits)/(Project Costs)

Project Costs = (Capital costs) + (Net Present Value of Operations and Maintenance Costs)

Major Tasks Remaining in Phase 1

Barring surprises, the preliminary engineering report is due in February 2021 and environmental permitting should be complete by the Fall of 2021. Other tasks that must be completed by then include:

  • Hydrologic modeling of flows into and out of Lake Houston using the latest Atlas 14 data
  • Hydraulic modeling of Lake Houston, its Dam, and the San Jacinto River downstream of the dam to Galveston Bay
  • Calibration of models to historic storms
  • Examination of upstream benefits to residents/businesses removed from flood impacts
  • Examination of downstream impacts associated with additional flow release scenarios

It’s important to understand that not everyone who flooded in the Lake Houston Area did so because of the lake level. Some on the periphery of the flood flooded because water backed up in streams leading to the lake. If you got two feet of water in your living room, it doesn’t automatically mean a lake level reduction of two feet would eliminate your flooding by itself.

Congressman Dan Crenshaw (left) reviews the project with team members at the Lake Houston Dam and listens to their needs.

Phase 2 Still Not Certain

Assuming all goes well in the planning, accounting, and conceptual validation, FEMA will make a go/no go decision on construction at the end of next year or the beginning of the following year. Construction should take another 18 months.

Credits

Funding for this project comes from FEMA, Texas Division of Emergency Management, City of Houston and Harris County Flood Control. Other stakeholders include the Coastal Water Authority, Harris County, Fort Bend County, Baytown, Deer Park, and other communities adjacent to Lake Houston.

Posted by Bob Rehak on 10/17/2020

1145 Days since Hurricane Harvey and 394 since Imelda

HUD Orders State to Take Over CoH’s Harvey Relief Funds

With Hurricane Delta behind us, now we face a political storm. KPRC Channel 2 News reported earlier this week that the US Department of Housing and Urban Development (HUD) is putting the State of Texas back in charge of the City of Houston’s $1.3 billion Harvey relief dollars. That wouldn’t happen unless something was seriously wrong with City’s program.

Home destroyed by Harvey and rebuilt by owners/friends. No insurance. And no government help so far.

HUD Eliminates Direct Funding to City

According to KPRC, Acting HUD Assistant Secretary John Gibbs said this “… eliminates direct allocation funding to the City of Houston. The City’s sub-recipient agreement will be terminated, and the funding used for State-run programs to support recovery efforts within the City. The General Land Office (GLO) will administer homeowner assistance, rental, and economic revitalization programs to serve eligible City of Houston residents.”

The switch will not affect whether the $1.3 billion dollars allocated to the City will be distributed, just who will distribute it.

One Home per Week

The state said the City has only been able to address 163 homes to date that Harvey damaged. That’s exactly one per week since the storm. Even considering that the City didn’t get the money immediately, the rate still averages less than two per week.

3+ Years in a Black Hole then a Start Over

I know one family – neighbors – who applied for a grant to help rebuild their home after Harvey. They waited more than 18 months for a call back. When one didn’t come, they called the State’s General Land office, the agency taking over the funds. With a nudge from the GLO, the City finally returned the family’s calls. The City requested more information which the family supplied. Then came another long wait. The case fell into another black hole. The neighbor called two or three times a day, then learned that the lady managing the case was no longer in her job. They had to start over with another case worker. Now it appears they will have to “start over” again – three years after Harvey.

The lengthy wait for help has been doubly disappointing for my neighbors.

Not only were their lives destroyed; now their hopes are dashed.

The family cashed in their kids’ college funds and 401Ks to rebuild their home when help never materialized. Those kids will soon be in high school. And how the family will pay for their college is another source of worry.

The family is still waiting with a shoebox full of receipts and photographs of the damage – for a call that may take years to come.

Unanswered Questions

In trying to figure out why this happened, I talked to several sources familiar with City government. The answers I usually got involved “complex process,” “under-qualified staff,” “set up in a hurry,” and “inadequate supervision,” “contractor issues,” and “lack of accountability.”

One went so far as to predict, “Most of this money will never get to recipients. It will get ground up in overhead.” Meanwhile…

“Many poor families don’t have college funds to tap. Many still live in mold-infested homes without wallboard. Or they’ve just abandoned their homes.”

As I said in 2018 – 276 Days after Harvey – there’s definitely an opportunity for business-process re-engineering here. Simplifying the process will help more people.

Posted by Bob Rehak on 10/10/2020

1138 Days since Hurricane Harvey

Bald Eagle Joins Protest of New Woodlands Development

Last Saturday morning (9/26/2020), Sally and JG Geis were out walking around Lake Woodlands. They came across a gathering of people protesting a proposed new development on Mitchell island in the lake.

The Woodlands Land Development Company, L.P., a subsidiary of Howard Hughes Corporation seeks to re-plat Mitchell Island in the center of the photo.

The protesters’ concerns centered around the re-platting of the development. They feared it would bring an increase in traffic, create demands on local infrastructure, and impact nesting eagles. The majestic raptors in The Woodlands have attracted birders and tourists for decades.

Higher Density Now Planned in Sensitive Area

The 23-acre island was originally platted for 19 homes with a minimum size of 7,000 square feet. The new plan consists of 58 high-end residential homesites, which will reportedly start at $1 million.

According to nearby residents, the new plan will affect a pair of nesting bald eagles which visit the area every year.

As if on cue, one of the eagles flew into a nearby tree to watch the protest.

Cell phone photo of bald eagle watching protest at entrance to Mitchell Island on Saturday. By Sally Geis.
Enlargement of eagle within previous photo. By Sally Geis.

Notice of October 1 Online Public Hearing

Public Notice of Project. Photo by Sally Geiss. According to the sign, the Planning Commission will hear virtual testimony starting at 2:30PM on October 1.

From 1+ acre lots to 10 foot lot lines. Note the credit line near the bottom. LJA Engineering! Wherever there is controversy, we seem to find LJA Engineering.

Trying to Beat the Clock on New Regs and Flood Maps?

After LJA rushed to get their plans for Woodridge Village approved before new Atlas-14 rainfall statistics went into effect, hundreds of homes in Elm Grove flooded. Is LJA trying to beat the clock once again before new regulations and floodplain maps go into effect?

This island sits within the extra-territorial jurisdiction of the City of Houston (CoH). So it must meet CoH floodplain requirements. The City and Harris County are trying to harmonize their floodplain regulations. Changes in those regulations could affect development on the island. Most of the island currently lies in the .2%-annual-chance floodplain. But portions lie in the 1%-annual-chance floodplain. See below. When new flood maps are redrawn, parts of that .2% floodplain could be reclassified as 1%.

Cross-hatched = floodway. Aqua = 1% annual chance of flooding. Brown = .2% annual chance. Source: FEMA National Flood Hazard Layer Viewer. Note: These zones could soon change because flood insurance maps are being redrawn.

Chapter 19 of the City Code currently requires minimum flood protection elevation of 2 feet above the 0.2 percent flood. However, the new plat does not show any retention ponds that could provide fill.

Proposed layout shows larger lots facing lake and smaller lots facing east where smaller homes already exist. For a high-resolution PDF of the entire plat, click here.

Elevating 58 homes will take lots of fill to meet the CoH minimum elevation requirement. Where will that fill come from? Outside the development? How will that affect the floodplain for surrounding homes? So many questions!

Let’s hope that the people in the City’s Planning and Development department have eyes as good as that eagle’s.

Posted by Bob Rehak on 9/29/2020

1127 Days since Hurricane Harvey

The thoughts expressed in this post represent opinions on matters of public concern and safety. They are protected by the First Amendment of the US Constitution and the Anti-SLAPP Statute of the Great State of Texas.

Construction of Northeast Water Purification Plant in High Gear

During a flyover of the City of Houston’s Northeast Water Purification Plant Expansion project on 9/11/2020, I counted 13 construction cranes operating simultaneously on different parts of the site. The site stretches a full two miles from the start of the plant near the northeast corner of Beltway 8 to the tip of the water intake platform in Lake Houston. Here are photos that show the scope of this massive construction project.

The water intake platform stretches approximately 1100 feet out into Lake Houston.
The 108-inch intake pipes are larger than some pieces of construction equipment.
Looking NE toward Lake Houston along the path that the intake pipes will take through Summerwood.
Looking west toward the main treatment plant, with Beltway 8 in the background. Construction began in 2018.
Looking SW across the eastern portion of the new plant.
Looking SW across the western portion. The site is divided into about 10 sections each as large or larger than a city block.
A close up of construction activity in just one of the sections.
Looking straight east back toward Lake Houston from the western edge of the plant. Note the current water treatment plant in the foreground. It produces about 80 million gallons per day of fresh water.
Looking north over the center of the site.
Looking WNW. Note the NE corner of Beltway 8 in the top left. The plant expansion will provide another 320 million gallons per day.
For scale, note the size of the man on the scissor-lift in the red circle.

The plant expansion will supply 320 million gallons per day of treated water capacity in addition to the current 80 million gallons per day. So capacity will quintuple by completion in 2024.

Converting Area to Surface Water to Reduce Subsidence

The expansion of capacity will allow more water systems in the region to convert from groundwater to surface water. That should reduce subsidence and help avoid flooding.

Improved Techniques

According to the City, “The expansion will include conventional treatment processes like the existing plant that help coagulate, settle, filter, and then disinfect water.” Quality will exceed requirements set forth by the Texas Commission on Environmental Quality.

In addition, says the City, an advanced oxidation process called ozonation will disinfect water to help ensure that harmful organisms such as Giardia and Cryptosporidium are eliminated. Ozonation also helps eliminate taste and odor causing compounds, which improves the aesthetic quality of the water supplied by the plant.

Receive Updates

This construction update by the City of Houston shows additional ground-level and drone photos of the construction. You can sign up to receive future updates here.

Contractor Portal

Here is the main procurement portal for the project. Contractors looking for work on the site can sign up here.

Posted by Bob Rehak on September 17, 2020

1115 Days since Hurricane Harvey

City Making Good Progress on Forest Cove Ditch Rehabilitation Project

In late July, the City of Houston’s Stormwater Action Team began a ditch rehabilitation project in Forest Cove. The City predicted the project would take until November 24, weather permitting.

Forest Cove Ditch Rehab project location.

The project area includes Cypress Lane and Palmetto Lane. The map above shows the project limits highlighted in red. 

Scope of Work

The scope of work for the ditch rehabilitation project includes: 

  • Regrading and re-establishing of the roadside ditches
  • Replacing of the culverts and resetting them to match the flow line of the ditch
  • Replacing the driveway where the culverts are replaced
  • Increasing the capacity of any culverts less than 24 inches in diameter
  • Removing any unpermitted culverts or other encroachments in the City Right of Way. 

Project Approximately on Schedule

I drove by the project earlier in the week and it appeared that the City had completed approximately a quarter to a third of the project in about a quarter of the time. That means they are on schedule or slightly ahead.

Ditch rehab already completed in Forest Cove

From the looks of things, it appears the City is doing exactly what it promised.

For More Information

For more information, please contact Mayor Pro Tem Dave Martin’s office at (832) 393-3008 or via email at districte@houstontx.gov.

Posted by Bob Rehak on 9/10/2020

1108 Days after Hurricane Harvey

Woodridge Village Still Silting Up Taylor Gully

Despite countermeasures, such as silt fences and rock baskets designed to catch erosion, Woodridge Village is still silting up Taylor Gully. And this comes shortly after Harris County Flood Control just cleaned out the ditch to restore its conveyance.

Nicole Black-Rudolph captured these two photos downstream from Woodridge. They show the water in Taylor Gully at the Turtle Bridge in Woodstream. The first shows what the water normally looks like. The second shows what it looks like now.

Normal/Now Photos by Nicole Black-Rudolph showing increased silt in Taylor Gully.

Where Did Silt-Laden Water Come From?

Following Taylor Gully upstream, you come to 268 clear-cut acres – Perry Homes’ Woodridge Village. All pictures below show Woodridge Village on the morning of September 7, 2020. A nearby Elm Grove resident, Jeff Miller, reported .7 inches of rain fell in his gauge on 9/5 and 9/6. That wasn’t enough to cause flooding, but it was certainly enough to erode sediment as the pictures below show.

Looking SSW across Woodridge from the top of the N3 detention pond on the eastern border. Elm Grove is at top. Everything slopes toward Taylor Gully in the upper left.
Woodridge Village, looking NW from over Taylor Gully
Looking north at N3 detention pond day after rainfall. Silty water is still flowing out of the pond.
Looking east at the concrete lined portion of Taylor Gully on the Woodridge site where water exits the site and crosses into the open channel on the Harris County side of the county line, out of frame to the right (see below).
Looking south at Taylor Gully immediately south of the county line. Note how color of water in ditch matches the color of water on the right in the side-by-side comparison photo above.

Political Ping Pong

Perry Homes’ troubled development in Montgomery County has been caught in a political ping-pong match that has delayed either its ultimate build out or conversion into a regional detention facility. The match started in February when the City of Houston said Harris County should pay for the conversion. It has continued until now. Harris County Precinct One Commissioner Rodney Ellis keeps heaping one new condition after another on the sale of the property to Harris County Flood Control District.

Woodridge contributed to flooding Elm Grove Village in Kingwood (immediately to the south and across the Harris County line) twice last year. Perry contractors had clear cut 268 acres and filled in natural streams and wetlands that criss-crossed the property before fully installing detention ponds. When major rains stuck on May 7th and September 19th last year, sheet flow from Woodridge, coupled with water backing up in the streets of Elm Grove, flooded hundreds of homes. The area is still recovering.

Harris County Flood Control immediately started a project to restore the conveyance of the ditch which was badly silted, in part due to construction activities.

Now, despite best efforts to reduce erosion with conventional countermeasures, the exposed surface washes downstream with each rain. This re-deposits more sediment, which the Flood Control District just removed. (See two photos below from 2019.)

Taylor Gully Before 2019 Clean out.
Taylor Gully After 2019 Clean Out

Pray there’s movement on this deal soon. Perry Homes should plant grass on their property until the ping-pong match is over. Silt fences and rock baskets alone just don’t do the job.

Posted by Bob Rehak on 9/8/2020 with photos from Nicole Black-Rudolph and Rain Data from Jeff Miller

1106 Days since Hurricane Harvey and 355 since Imelda

The thoughts expressed in this post represent opinions on matters of public concern and safety. They are protected by the First Amendment of the US Constitution and the Anti-SLAPP Statute of the Great State of Texas.

City of Houston Map Shows Extent of Water Flood Hazards for Many Smaller Ditches, Streams

If you fear flooding from a small stream and you live inside the Houston City limits, this is THE resource for you. It’s the City’s Water Flood Hazards Viewer. And it’s incredibly detailed. It even shows the extent of flood hazards around many unnamed temporary streams and man-made ditches.

Water/Flood Hazards within the City of Houston

The image above shows Ben’s Branch where it cuts across the Harris/Montgomery County Line. Many homes and businesses in this area flooded during Harvey and Imelda despite being three miles from the nearest river.

The different shadings and cross-hatchings represent floodways, 100-year and 500-year floodplains. I checked around neighborhoods near me where I was familiar with the extent of flooding. The map seems to be very accurate. I only found one or two properties that I would have reclassified.

Impressive Gallery of Base Maps and Other Features

The City’s Water Flood Hazards site contains an impressive gallery of 25 different base map options. They range from customary street maps and satellite views to topographic maps and more.

You can also measure distance and direction with the built in tools. And unlike many such maps, this one contains built in drawing tools that let you make notations and share them with your friends or associates.

Of course, it includes information on flood zones near major rivers, too. It even includes information on hurricane evacuation zones near the coast.

You can see the outlines of Harris County in the extent of the waterways. The bright areas near the coast represent hurricane evacuation zones and zip codes.

Incredible Flexibility

Because the system is built on a geographic information system database, you can even add data from other databases. That makes the map reflect additional types of information. But warning: this can get very technical.

Great Tool for Research

If you’re considering buying a property or flood insurance, and you live in the City or Harris County, this is definitely a map you should bookmark. The Water Flood Hazards Map is an incredible research tool. For ease of future reference, I have listed the map on the Links page of this website under Floodplain Maps and Elevation.

Posted by Bob Rehak on 9/6/2020

1104 Days after Hurricane Harvey

Tetra Tech Study Provides Clues To Possible Mouth Bar Dredging Strategies

FEMA has agreed to dredge another million cubic yards from the the area near the San Jacinto West Fork Mouth Bar. A report produced for the City of Houston by Tetra Tech helped convince FEMA. The report relied on sonar, LIDAR, and core sample data to estimate the total volume of sand deposited by Hurricane Harvey in that area: approximately 1.4 million cubic yards.

Need for Ruthless Efficiency

While another million cubic yards may sound like a lot, the area is huge. Dredging the whole 4.3 million square yard area would add only about 8 inches of water depth and leave an underwater mesa between the West Fork and the Lake. According to local geologists Tim Garfield and RD Kissling, who have studied the problem extensively, that would create a sediment trap that accelerates accumulation of sand from future storms.

So, what to do?

Three Strategies Discussed to Date

Those close to the project have discussed several strategies to date.

  • The Corps’ initial strategy: Dredge upstream from the mouth bar. They said 1D modeling showed that would accelerate water flowing into mouth bar and give it the velocity needed to push sand from the mouth bar farther out into the lake.
  • Another strategy: dredge downstream from the mouth bar and let the river push the mouth bar into the dredged area.
  • A third strategy: reconnect the river and the lake with a narrow channel that accelerated the flow of water and carried suspended sediment out into the broader lake south of the 1960 bridge.

2019 Tetra Tech Report

Stephen Costello, the City’s flood czar, says that new survey and modeling work has yet to be completed. That will ultimately determine where new dredging happens. However, he also added that consulting Tetra Tech’s exhibits would help provide clues as to where dredging might be most effective, based on knowledge accumulated to date.

The first chart in Appendix A showed the coring locations and transects (survey lines) of the lake’s bottom profile.
The second chart shows what they found in various coring locations. The feet indicate the thickness of the top layer.

Composition of the core samples provides clues as to what was laid down when. Sand (the yellow dots) is generally laid down during floods which have the energy to transport the heavy particles. However, clay and silt (the green and blue dots) are smaller. So they tend to drop out of suspension when water is calmer.

Finding sand above silt in a core sample indicates that a storm like Harvey likely laid down the sand.

The third chart is the most crucial. It’s a difference map that shows areas of deposition and scour pre- and post-Harvey. This shows two things: where most sediment fell out of suspension and where the main flow of the river tried to churn a path through the mounting muck.

From the difference map above, you can see that the river tried to scour its way through the sediment along a path from LH-16 to LH-21 to LH-23. You can see another area of scour to the far right from LH-15 to LH-25 to LH-26.

Where River Flowed Before Lake Was Impounded

Interestingly, the area of scour to the left follows the river’s relic channel.

San Jacinto River map before Lake Houston was impounded

Note how the West Fork hugged what is now Atascocita Point – the thumb of high land that sticks up in the Tetra Tech illustrations.

Harnessing Natural Energy of the River

From the third and fourth illustrations above, one might conclude that excavating a channel near Atascocita Point represents the best way to harness the natural energy of the river. That’s the shortest channel where scour is deepest.

Given the million cubic yard limit, that path also represents a chance to dig the deepest, widest channel possible within the budget. When technicians compiled the difference map above, most of that path was already at or below its 2011 level.

500,000 square-yard path outlined in yellow would let dredgers excavate six feet. Average bottom depth is already 5.5 feet in that area.

Following that path also lets you funnel future sediment through the FM1960 causeway and disperse it out into the wider, deeper lake.

Next Steps and Timing

At this point, we don’t know what Imelda did to this area. Imelda struck shortly after the Army Corps completed its post-dredging survey in this area last year.

Before the additional dredging can begin, several things must happen.

  • Completion of a new survey
  • Model different scenarios
  • Identify best strategy
  • Locate suitable placement area
  • Compile scope of work
  • Bid job
  • Mobilize

Based on past experience, that could take months to a year or more. It took 13 months after Harvey for the Corps to put equipment in the water for its Emergency West Fork Dredging Project. However, we don’t have as many unknowns this time.

Posted by Bob Rehak on 9/5/2020

1103 Days since Hurricane Harvey

How Much Will Dredging Another Million Cubic Yards Reduce the West Fork Mouth Bar Area?

Earlier this month, the City of Houston announced that FEMA would pay to dredge another million cubic yards of sediment from the West Fork Mouth Bar. What does that mean in practical terms? What are the objectives of the program? How wide and deep will they go? Neither the objectives, nor a dredging plan, have yet been released.

The official plan will hopefully rely on new survey work and hydraulic modeling. A survey boat has been seen on the lake for several weeks now.

Since January of this year, the City of Houston has been trying to reduce the above water portion of the mouth bar with mechanical dredging, a much slower process than hydraulic dredging. Note how shallow the water is in the foreground.

How to Play Armchair Engineer

In the meantime, since fall football is in doubt due to COVID, here’s a simple way to keep your armchair quarterbacking skills finely honed. What would you do if you were the project engineer or manager? Play what if and experiment with different scenarios.

  • Download and open Google Earth Pro. It’s free.
  • Zoom in on the West Fork Mouth Bar.
  • Select the measuring tool.
  • Click on the polygon tab.
  • Select square yards for the unit measurement for the areas you will define.
  • Now start second guessing the project engineers. Play “what if” by defining an area that you would like to see dredged.
  • Readjust the points that define the area by dragging them in, out, up or down.
  • Watch the total square yards recalculate as you move the points.

Examples of Different Scenarios

Here are some examples to show you what I’m talking about.

4.3 Million Square Yard Area, Roughly 8 inches Deep
Largest area. This scenario takes in everything between where the Corps stopped dredging in its Emergency West Fork Program and the FM1960 Bridge.

The scenario above takes in the mouth of Ben’s Branch, plus all the other drainage ditches that empty Fosters Mill, Kings Point, and Atascocita north of the FM1960 Bridge.

The scenario above covers 4.3 million square yards. But with a budget to dredge only 1 million cubic yards, you would divide 1/4.3 = 0.23 yards of depth. That’s less than a third of a yard. It works out to about 8 inches.

3 Million Square Yard Area, 1 Foot Deep
In the next scenario, I pulled the boundaries in so that the area equaled 3 million square yards.

This scenario is a little more intuitive. You’re dredging 1 million cubic yards across an area of 3 million square yards. Within this bounding box, you could reduce the level of sediment roughly a foot.

2 Million Square Yard Area, 18 inches Deep
If you reduced the area to be dredged to 2 million square yards, you could reduce the level of sediment by half a yard or 18 inches.
1 Million Square Yards, 3 Feet Deep
Path followed by the relict channel before Lake Houston was built.

If you reduced the area further, to 1 million square yards, you could dredge to 3 feet. With the five feet of depth already there, you could have an eight foot channel connecting the river and the lake. Make it narrower and you could even go deeper. And perhaps, just perhaps, keep sediment from accumulating so rapidly upstream of the FM1960 bridge.

Difficult Choices Ahead

As you can see, engineers have some difficult choices ahead. They must chose between unblocking channels and streams, or dredging a channel roughly the size of the upstream west fork all the way to the 1960 bridge.

Last year, the Corps reduced the 600-acre area between the mouth bar and Atascocita Point to an average depth of 5.5 feet. So we have a good head start. But there are other considerations:

The West Fork was roughly 22 feet deep where the Corps stopped dredging just west of the mouth bar. Because of scouring, it’s at least that deep where the west fork passes under FM1960.

As a result, water coming down the west fork hits an underwater mesa that still blocks off three quarters of the conveyance.

Prominent area geologists, such as Tim Garfield and RD Kissling, theorize that that wall traps sediment and is rapidly diminishing the value of previous dredging programs. They believe that the most important objective for this phase of dredging should be to “reconnect the West Fork with the Lake.”

But Advancing Delta Now Blocks Major Streams, Channels

Meanwhile, consider this, too. In 2014, Bens Branch and the drainage ditch that empties large parts of Fosters Mill and Kings Point had a clear path to the river. Today, both are blocked by the mouth bar and an advancing delta within the lake. Compare the two images below.

Google Earth view from 2014 shows steams could still easily connect with relict channel.
Today, however, an advancing delta within the lake blocks them.

These are some of the real world trade offs that engineers and project managers must deal with every day.

So to return to the football analogy, do you send your receivers wide or deep? Do you have them hug the sidelines or cut for the goal post?

Understand that this isn’t a game, however. It’s a struggle to return a community to prosperity.

What would you do? And why?

Posted by Bob Rehak on 8/31/2020

1098 Days since Hurricane Harvey

New Flood-Map Timetable and How It Affects New Development

Because of low interest rates, new developments seem to pop up weekly around the Lake Houston Area. The question often arises, “How will the development of new flood maps affect the development of new subdivisions?” Most people by now have heard that City building code revisions now require elevation at least two feet above the .02-percent-annual-chance flood (formerly known as 500-year flood). But does that mean two feet above the old floodplain or the new? Due to a little-known provision in the City’s floodplain regulations, it means the new floodplain even though the new floodplain maps are not official yet.

Developments in various stages in the northeast Houston Area and the City’s ETJ (extra territorial jurisdiction). From City of Houston Plat Tracker Plus.

Timetable for Updating Flood Maps

Here’s what you need to know if you’re concerned that someone may be building future buyouts next to your neighborhood. First the timetable for new flood maps.

Remaining timetable for new Harris County Flood Maps

Even though FEMA won’t release the new flood maps officially for approximately another five years, developers should still be building to the higher standards associated with newly acquired data (in other words, the data on which the new maps are being built). See below.

Floodplain Regs Authorize City Engineer to Use Data Behind New Flood Maps

Section 19-4 of the City’s Floodplain regulations address Use of other flood hazard data to supplement the effective Flood Insurance Rate Map (FIRM). It states, “New elevation and flooding studies are undertaken by or under the auspices of FEMA and local political subdivisions, such as the Harris County Flood Control District. Upon determination that the data generated by such a study appears to be reliable and based upon sound engineering and surveying practices and further that the study’s data indicate that the effective FIRMs are FIRM is materially inaccurate, the city engineer may cause the study data to be administered for purposes of this chapter as though it were a part of the effective FIRM. Any such determination shall be issued in writing and a copy shall be placed on file in the office of the city secretary. The city engineer is authorized to utilize updated information from FIS and floodplain models in administering this chapter.”

Basically, that means even though the new maps have not yet been adopted, the City Engineer can require developers’ plans to reflect the new underlying data as though it were part of the current map. In this case, the new underlying data is already in hand.

MaapNext Website Describes New Data Improvements

Current floodplain maps will change greatly according to Harris County Flood Control. The district has already started releasing information on a new website called MaapNext (Modeling, Assessment and Awareness Project).

Components of the MaapNext program. A $3.5 million FEMA grant made MaapNext possible.

According to the MaapNext site, we now have updated data based on:

  • County-wide impervious data developed from 2018 aerial imagery
  • Completed flood risk reduction projects
  • NOAA’s recently-released Atlas 14
  • Updated terrain data

We also have new and better ways to model that data since the last survey after TS Allison:

  • 2-Dimensional Hydraulic Modeling
  • New hydrology method that better accounts for a watershed’s conveyance capacity
  • Rain-on-Grid analysis that identifies previously unmapped urban flood risk.

And, we are beginning to develop better maps:

  • Modeling results in GIS (Geographic Information Systems)
  • New flood-risk data sets describe results in a variety of useful ways

Reportedly, the City is already requiring developers to act on the new “best available data” instead of waiting five years for the next maps.

Chapter 19 of the City Ordinances deals with dozens of other requirements for building in floodplains. But more on those in future posts.

Posted by Bob Rehak on 8/29/2020

1096 Days (Three Years) since Hurricane Harvey

The thoughts expressed in this post represent opinions on matters of public concern and safety. They are protected by the First Amendment of the US Constitution and the Anti-SLAPP Statute of the Great State of Texas.