RV Resort Contractor Cut Down Trees in County’s Edgewater Park
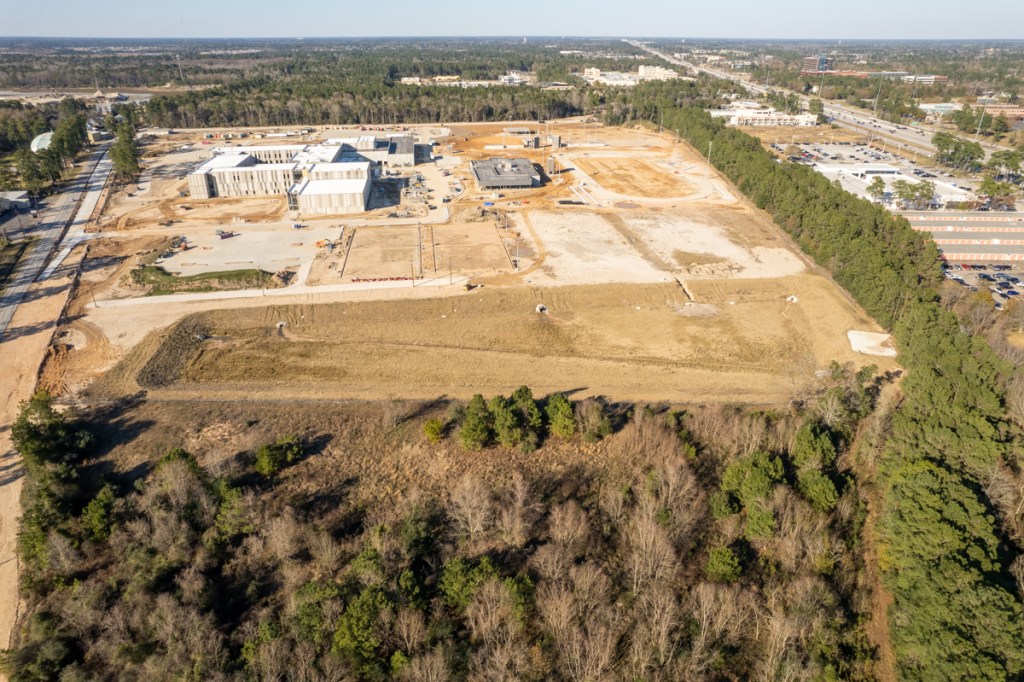
The contractors for the Laurel Springs RV Resort west of Lakewood Cove got a little overzealous with bulldozers. They killed up to 50 feet of mature trees in Harris County Precinct 4’s Edgewater Park along the entire property line. TCEQ and County inspectors visited the site last week and documented problems. According to one resident, the City also had inspectors there. Ever since, the contractors have been scrambling to correct problems, such as erosion, and to install pollution-prevention measures that should have been there months ago.
Mature Trees Hard to Replace
But some problems, like the trees will be hard to correct. It could take decades for newly planted trees to reach the height of the old ones.
It’s hard to say exactly how many square feet of trees were lost beyond the property. The distance varies along the southern perimeter of the RV site. But another resident and I, using a tape measure and eyeballs, estimated the damage extended into the park for up to 50 feet south of a surveyor’s stake at the southern property line. If the estimates are close, that would mean the contractor harvested almost an acre of County trees.
Attempts to Clean Up Site
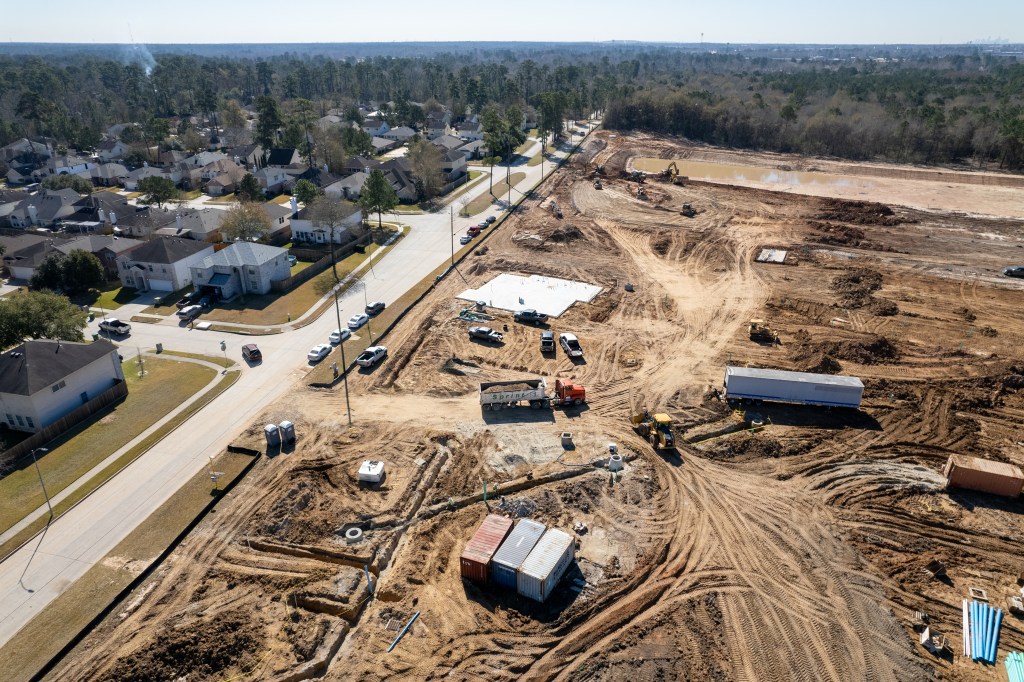
Since a two-day shutdown after the discovery of contractors flooding Edgewater Park with silty stormwater, the construction site has bustled with activity. Some employees have continued laying pipe, spreading fill, and grading. Meanwhile, others try to fix problems pointed out by inspectors.
Yesterday, contractors tried to retrieve dirt that eroded into or was placed in Edgewater Park. Last night, they erected silt fence along most of the southern perimeter. The muck-retrieval team was still working this morning. The contractors created a new entrance with fresh bullrock. And they also placed silt filters in front of storm-sewer grates along Laurel Springs Lane.
Photos Show Extent of Tree Loss
The orange stake below represents the southernmost stake of the developer’s RV park. It lines up roughly with the southerns edge of the detention pond’s bank. Edgewater Park is to the left.

The position of the orange stake in this wider shot lines up a little bit north of the left end of this traffic island in Laurel Springs Lane.


Had the silt fence been installed from the start of construction – as the Stormwater Pollution Prevention Plan said it should have been – perhaps contractors would not have cut down the trees.
Pipe Apparently Still Buried
After digging a trench in the southern wall of the pond to discharge silty stormwater into Edgewater Park at the top of the frame, contractors then buried a pipe to create a permanent conduit. They still have not removed it to my knowledge. I visit this site every day and would likely have noticed people working on that. But all I saw was some dirt placed in front of the inlet and outlet. If still embedded, leakage through the pipe could explain the continued presence of silty water below the pipe in the trees at the top of the frame.

Sometimes trying to take shortcuts can cost you more money in the long run than you save. Developers and contractors often get away with things because neighbors rarely read plans and watch to make sure they are followed. The assumption is that regulators inspect these sites daily. They don’t. We just don’t have enough of them.
Tomorrow…details of the developer’s Stormwater Pollution Prevention Plan filed with the TCEQ. You definitely don’t want to miss that one.
Posted by Bob Rehak on 2/12/2022
1628 Days since Hurricane Harvey
The thoughts expressed in this post represent opinions on matters of public concern and safety. They are protected by the First Amendment of the US Constitution and the Anti-SLAPP Statute of the Great State of Texas.