In two weeks, approximately 40 acres timber has turned into toothpicks at the new Northpark South development. Clearing is now about two-thirds to three-quarters complete.
The development lies between Sorters-McClellan Road and the West Fork San Jacinto at the end of Northpark Drive. The developer, Century Land Holdings of Texas, LLC, hopes to build 236 homes, driveways, roads, and an 11.2 acre stormwater detention basin on a total of 54.4 acres.
If that sounds like a lot, Century has already applied for a variance from the City of Houston Planning Commission to create lots less than 5,000 square feet. Regardless, RG Miller Engineering still claims impervious cover will not exceed 66%. But that’s not the only curious takeaway from the RG Miller report.
No Mention of Wetlands
To achieve such density, Century will pave over wetlands. But the RG Miller report makes no mention of wetlands.
National Wetlands Inventory shows wetlands in middle on far right.
USGS has documented wetlands on this property since at least 1961, as you can see in this topographic map viewer.
However the developer apparently has not received a wetland development permit from the Army Corps.
In addition, the imagery showing the wetlands (the empty crescent-wrench-shaped area in middle right of blue outline) is misdated.
The caption in the drainage analysis says the image is from 2018. But the homes in the top left of the frame were not built until late 2020. And the image itself is from late 2021. So why would the image below be dated two years earlier.
Compare a Google Earth image taken on 2/23/2019 – before the onset of drought. When you zoom in a bit, you get a clearly different impression.
Scrolling back through 30 years of historical images in Google Earth shows evidence of periodic pondingin this location and distinctly different vegetationfrom the surrounding area.
Was the RG Miller image accidentally mislabeled or an attempt to show drier conditions that didn’t scream “wetlands”? We’ll probably never know.
According to one environmental expert I consulted, developers very often have consultants who assert that there are no wetlands on property. Therefore, they feel, there’s no need to involve USACE “because a permit isn’t necessary.”
The expert said, “In my mind, they are betting on not getting caught. They can save a lot of money by avoiding permits and those savings are apparently worth the risk.”
It’s also possible that the latest Supreme Court ruling on “Waters of the U.S.,” removed federal government protection for these wetlands. In that case, these wetlands would not require permitting.
Problems Building over Wetlands
The expert continued, “Comparing this information to the plans, it looks like there will be residential streets and houses on top of the historic wetlands. I would NOT feel safe living on top of a former wetland this close to the river. NO WAY! The land has a memory, deep in its soils, and I would expect future issues.”
Current Status of Clearing
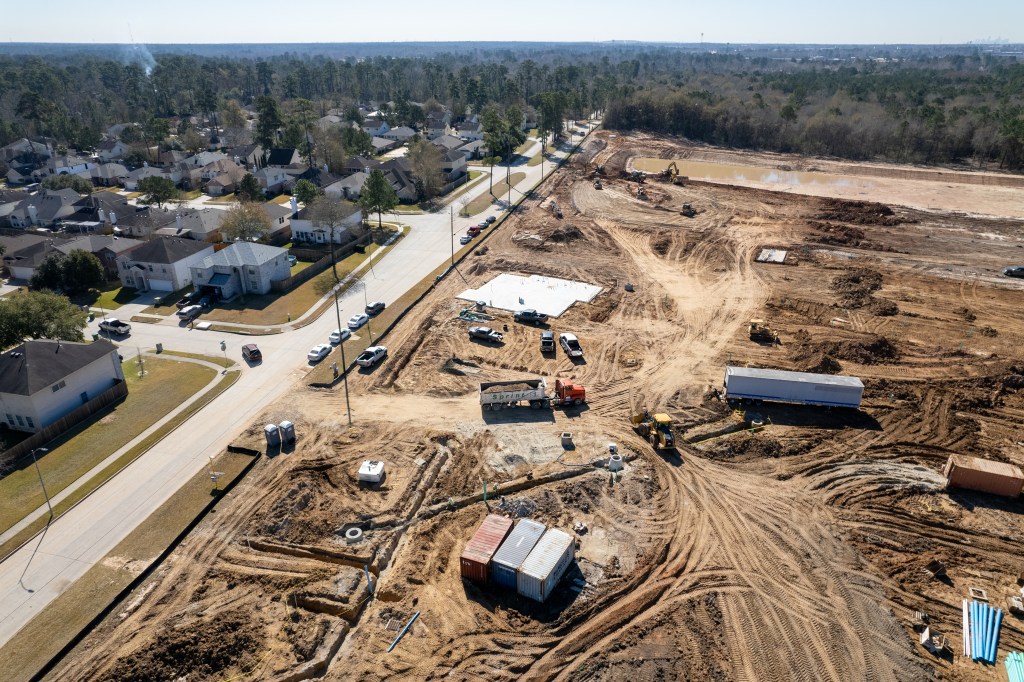
I took the photos below on the afternoon of Friday, 11/24/23.
Looking west at extent of clearing in last two weeks. West Fork is beyond sand pits near top of frame.NorthPark Drive runs off bottom of frame.Looking E toward Kingwood. Detention basin will stretch between the woods on left and the road on right in the area close to camera.Basin will drain into pond in lower right foreground.Looking N toward a sister development (Northpark Woods) by same developer. Sand pit middle left belongs to another company.
High-Water Mark Shows Potential Danger
The image below shows where the new development sits in relation to the river and the high-water mark during Harvey.
Extent of flooding during Harvey relative to new development, according to nearby resident.Looking west down Northpark toward San Jacinto West Fork.
While Harvey was an extreme storm, keep in mind that pre-Harvey flood maps show inundation potential across most of Northpark South. And the new post-Harvey flood maps, which have not yet been released, will take in even more of the new development.
Buyer beware. There’s plenty here to chew on. Toothpick anyone?
Posted by Bob Rehak on 11/25/23
2279 Days since Hurricane Harvey
The thoughts expressed in this post represent opinions on matters of public concern and safety. They are protected by the First Amendment of the US Constitution and the Anti-SLAPP Statute of the Great State of Texas.
https://i0.wp.com/reduceflooding.com/wp-content/uploads/2023/11/20231124-DJI_0134.jpg?fit=1100%2C733&ssl=17331100adminadmin2023-11-25 13:51:352023-11-25 14:22:0840 Acres of Timber Turned into Toothpicks
Colorado-based Century Land Holdings of Texas, LLC has started clearing land for Northpark South in Porter along the West Fork of the San Jacinto River at the west end of Northpark Drive.
Documents from the Houston Planning Commission, USGS, and FEMA; eyewitness accounts from nearby residents and flood professionals; and aerial photos indicate:
Most of the area is in floodplains defined decades ago and not updated since.
The entire area – and then some – went underwater during Harvey.
The entrance to the property near Northpark Drive and Sorters-McClellan Road sits in a bowl that rescue trucks could not get through during Harvey. That would make evacuation difficult in the event of another large flood.
Wetlands dot the property.
Abandoned sand mines may pose safety threats.
The same developer just completed a sister development called Northpark Woods across a drainage channel from this one. But so far, the gutsy developer has avoided any consequences for its risky gamble thanks in large part to a multi-year drought and interminable delays at FEMA releasing the new post-Harvey flood maps.
All Underwater During Harvey
Eyewitness accounts and damage reports indicate that Harvey floodwaters stretched about a third of a mile east of Sorters-McClellan to Northpark and Kingwood Place Drive. That’s on the high side of Sorters-McClellan; the new development will be on the low side.
Floodwaters in this area stopped at about 83 feet above sea level. However, the entrance to the new subdivision is at 75 feet, according to the USGS National Map. That means the water was an estimated 8 feet deep at the entrance.
One long-time resident in the area said, “The intersection of Sorters and Northpark sits in a bowl. It was not passable by Montgomery County Precinct 4 constables in an Army deuce and a half [used for high-water rescue]. Water from the river came right up past that intersection and continued up Northpark to just past the intersection of Kingwood Place Dr.”
Also on the high side of Sorters-McClellan, six of nine buildings at nearby Kingwood College flooded during Harvey. Restoration cost: $60 million!
Documents obtained from the Houston Planning Commission indicate that RG Miller is the engineer of record for Northpark South.
Bordering River and Sand Mines
During Harvey, 160,000 cubic feet per second rampaged down the West Fork behind this property.
Looking west past Sorters-McClellan Road toward what will become Northpark South.Note clearing starting in the middle in what used to be wetlands(see below).From the National Wetlands Inventory.Dark green area on right corresponds to cleared area above.Looking NW. Intersection of Northpark and Sorters-McClellan in lower left. Another subdivision called Northpark Woods by the same developer is in the upper right. West Fork San Jacinto and sand mines at top of frame.
Here’s what they hope to build on this property.
General plan submitted to Houston Planning Commission in 2021.
Current Floodplains Will Soon Expand
Most of the property already sits in floodway or floodplains. But the FEMA map below has not yet been updated to reflect new knowledge gained as a result of Memorial Day, Tax Day, Harvey and Imelda floods.
In fact, the 2014 date on the map below is misleading. It reflects an update of the base map, but the data that determines the extent of floodplains has not been updated since the 1980s, according to an expert familiar with Montgomery County flood maps.
FEMA and Harris County Flood Control have warned people that when new “post-Harvey” flood maps are released in the next year or two, floodplains will expand 50-100%. The floodway (striped area above) will likely expand into the 100-year floodplain (aqua). In turn, the 100-year will expand into the 500-year (tan). And the 500-year floodplain will extend past any of the colored areas.
That’s consistent with eyewitness accounts. And that could potentially put the entire property in floodplains.
Taking Advantage of Map-Update Window
The developer seems to be taking advantage of a window between post-Harvey flood surveys and release of the new maps.
I’m sure the developer’s lawyers would argue that they are complying with all current, applicable laws. But an ethical question arises. Will the new development expose unsuspecting homebuyers to greater-than-expected risk?
If so, why aren’t officials pushing to update maps and floodplain regs faster?
Could some officials be prioritizing economic development now over public safety later?
Certainly not all are. But many flood professionals worry about that.
Next to 5-Square Miles of Sand Mines
The new development sits next to the largest sand-mining complex on the San Jacinto West Fork. Sand mines in this area occupy almost five square miles. However, not all the mines are active. But they still show signs of heavy sediment pollution.
Looking E toward Sorters-McClellan from over West Fork. Northpark South is at top of frame beyond the sand pits.The operator of this mine decided not to fish its equipment out when they abandoned the site.More colors than Crayola. No telling what’s growing in these ponds.
Will routing drainage from Northpark South through these sand mines pose a safety risk for people downstream?
Will it be safe for kids to play or fish near these steep-sided pits?
Floodplain Development Called New Form of Redlining
Owner financing often accompanies floodplain developments. Such financing can bypass many flood-risk detection procedures that accompany traditional bank financing.
Then, when floods come, the people who can least afford to repair homes suffer the most and longest. Neighborhoods decay faster. And that makes it harder for people to recover their investments.
Years later, the public is left holding the bag. We are asked to fund expensive flood-mitigation projects that would not be necessary had the developer built in a safer area.
Posted by Bob Rehak on 11/11/2023
2265 Days since Hurricane Harvey
The thoughts expressed in this post represent opinions on matters of public concern and safety. They are protected by the First Amendment of the US Constitution and the Anti-SLAPP Statute of the Great State of Texas.
https://i0.wp.com/reduceflooding.com/wp-content/uploads/2023/11/20231109-DJI_0802.jpg?fit=1100%2C733&ssl=17331100adminadmin2023-11-11 12:04:192023-11-11 17:53:15Northpark South Starts Clearing Wetlands, Floodplain
In northeast Houston, where residents and activists frequently chant “historic disinvestment,” I accidentally stumbled onto a much more likely cause of the frequent flooding than systemic racism. It happened while browsing a GIS database with hundreds of layers containing a broad range of information. The instant I saw it, it unlocked a mystery. Tumblers suddenly aligned that unlocked the mystery. But let’s start this story with accusations that made no sense to me.
Accusations of Systemic Racism Not Supported by Spending Data
Three years ago, I joined the Harris County Community Flood Resilience Task Force. Ever since, I have heard a constant drumbeat of “historic disinvestment” by many members who believe they are victims of systemic racism by Harris County Flood Control District (HCFCD).
They claim that they aren’t getting their fair share of flood-mitigation funds when, in fact, financial analysis reveals the opposite. They get the lion’s share.
LMI vs. Non-LMI flood-mitigation funding through Q3 2021.
Eight watersheds with a majority of low-to-moderate income residents have received almost two thirds of the funding going back to 2000. That’s out of a total of 23 watersheds. The money has flowed to damage – as it should.
Many people, however, don’t believe that. The loudest complaints have come from the Northeast Action Collective. They waged a battle to remove flood-control executives from office who were working tirelessly on their behalf.
Regardless, falsehoods repeated often enough eventually rose to the level of “accepted truth.” Even experts can be fooled. Jim Blackburn, the renowned professor of engineering at Rice, repeated the “historic disinvestment” claim without presenting any proof in a Houston Chronicle story last week.
He claimed residents of Halls and Greens Bayou watersheds weren’t getting their “fair share” of flood mitigation money. In fact, Greens Bayou ranks #2 in terms of money received. Only Brays Bayou has received more.
Spending by Watershed from 2000 through 2023Q1. Source: Harris County Flood Control District via FOIA request.
And tiny Halls Bayou ranks #2 in spending per capita. Together, the two bayous have received more than $390 million to date.
And they could soon receive another $466 million out of the $750 million that the GLO and HUD recently granted Harris County for flood mitigation. If HUD approves the recommended projects totaling $466 million, Halls and Greens will have received $856 million – far more than any other watershed. (Technically Halls is a sub-watershed of Greens, but HCFCD tracks spending as if it were separate.) This is hardly historic disinvestment.
More Likely Cause of Flooding Overlooked by Critics Crying Racism
Today, while learning a new (to me) geographic information system, I randomly clicked on a “wetland” layer. Boom! Guess where the largest concentration of wetlands in Harris County is. The northeast!
Note Lake Houston in the upper right, once home to untold acres of wetlands before the dam was built in the 1950s.
As a reminder of what these wetlands once looked like, see the photos of Emily Murphy who kayaks along the shores of Lake Houston.
Photo Courtesy of Emily Murphy
Regulations discourage building in wetlands for good reasons. Water collects there. The soil is less permeable. They are low, poorly drained, and unstable.
In addition, USGS points out the many positive benefits of wetlands. “Wetlands provide habitat for thousands of species of aquatic and terrestrial plants and animals. Wetlands are valuable for flood protection, water quality improvement, shoreline erosion control, natural products, recreation, and aesthetics.”
But because they’re cheap land and available, some less-than-scrupulous developers often try to build in them. I’m told by engineers I trust that that has always been the case and always will be.
Back in the 1950s, farms and ranches occupied most of the northeast Houston area. Here’s what it looked like then.
Note the San Jacinto River in the upper right in this 1953 pre-Lake Houston aerial image from Google Earth.
And here’s what the same area looks like today.
Note the presence of Lake Houston in the upper right in this 2022 image.
There are still big undeveloped areas in the image above. But many developments have also filled in large parts of the northeast that were once wetlands in the 1950s image.
Dangers of Building Over Wetlands
According to USGS, “Wetlands are transitional areas, sandwiched between permanently flooded deepwater environments and well-drained uplands, where the water table is usually at or near the surface or the land… The single feature that most wetlands share is soil or substrate that is at least periodically saturated with or covered by water.”
Four years ago, I posted about the disadvantages of building over wetlands. Pictures of the Woodridge Village property, then under development by Perry Homes, dramatized how unstable the soils were. Dangers of building over wetlands include shifting slabs, cracked driveways, mold, erosion, clogged storm drains, flooding and more.
Unsuspecting buyers of former wetlands can literally get sucked in by low prices. Seventy years later, the original builders and buyers are long gone. And pre-digital soil samples and drainage analyses (if they were ever done) have long since disappeared into the fog of history or a dusty warehouse.
Wetland-mitigation banks near a development should raise red flags to buyers today. There’s one on the northeast corner of Beltway 8 along, you guessed it, Greens Bayou. There are also two in Colony Ridge: the Houston-Conroe and Tarkington Bayou Mitigation Banks.
In conclusion…
Today’s residents in such areas pay for previous owners’ lack of knowledge – not because of historic disinvestment.
I’m not saying early owners didn’t exercise due diligence. We just didn’t know then what we know now.
Posted by Bob Rehak on 9/22/23
2215 Days since Hurricane Harvey
The thoughts expressed in this post represent opinions on matters of public concern and safety. They are protected by the First Amendment of the US Constitution and the Anti-SLAPP Statute of the Great State of Texas.
https://i0.wp.com/reduceflooding.com/wp-content/uploads/2023/09/20230922-Screenshot-2023-09-22-at-12.29.43-PM.jpg?fit=1100%2C717&ssl=17171100adminadmin2023-09-22 17:58:482023-09-22 18:17:41GIS Data Reveals Likely Source of NE Houston Flooding Unrelated to Historic Disinvestment
A new study estimates that Louisiana lost approximately 750 square miles of wetlands between 1984 and 2020. Using a first-of-its kind model, researchers quantified those wetlands losses at nearly 21 square miles per year since the early 1980s. Even after accounting for gains in some areas due to sediment transported by rivers, the net loss was still 484 square miles.
Jet Propulsion Lab Study Points to Role of Coastal and River Engineering
A new study, titled “Leveraging the historical Landsat catalog for a remote sensing model of wetland accretion in coastal Louisiana” was published in the Journal of Geophysical Research: Biogeosciences. Authors of the 2022 study include D. J. Jensen, K. C. Cavanaugh, D. R. Thompson, S. Fagherazzi, L. Cortese, and M. Simard. I quote liberally from their work below which is reproduced under a Creative Commons Open-Source license.
To compile the data, the authors used NASA/USGS Landsat satellite records to track shoreline changes across Louisiana.
Some of those wetlands were submerged by rising seas. Others were disrupted by oil and gas infrastructure and hurricanes. But…
The primary driver of losses was coastal and river engineering.
Such engineering can have positive or negative effects depending on how it is implemented, say the authors.
Opposing Forces at Work
Centimeter by centimeter, wetlands are built by slow accumulation called “accretion.” Rivers and streams carry both mineral sediment and organic materials. Accretion uses those materials to make new soil. It counters erosion, the sinking of land, and the rise of sea level.
According to the authors, human intervention and engineering often hold back or divert the flow of sediments that naturally accrete to build and replenish wetlands.
For instance, reinforced levees and thousands of miles of canals and excavated banks have isolated many wetlands.
The levees and canals have cut off the wetlands from the Mississippi River and the network of streams that course through its delta. In a few cases, engineering projects have added sediment to delta areas and built new land.
The researchers mapped land change in coastal Louisiana from 1984 to 2020. Basins that failed to build new soil, such as Terrebonne and Barataria, experienced the most land loss – more than 180 square miles (466 square kilometers). Credit: Jensen et al, Journal of Geophysical Research: Biogeosciences
By analyzing Landsat imagery with tools from cloud computing, the researchers developed a remote sensing model that focused on accretion or the lack of it.
Restoration Possible
Basins that failed to build new soil, such as Terrebonne and Barataria, experienced the most land loss over the study period—more than 180 square miles (466 square kilometers). Other areas gained ground, including 33.6 square miles (87 square kilometers) of new land in the Atchafalaya Basin and 43 square miles (112 square kilometers) in the area known as the “Bird’s Foot Delta” at the mouth of the Mississippi River.
“The Louisiana coastal system is highly engineered,” said Daniel Jensen, lead author and postdoctoral researcher at NASA’s Jet Propulsion Laboratory in Southern California. “But the fact that ground has been gained in some places indicates that, with enough restoration efforts to reintroduce fresh water supply and sediment, we could see some wetland recovery in the future.”
Economic Importance
Understanding wetland dieback and recovery is critically important because the Mississippi River Delta, like many of the world’s deltas, drives local and national economies through farming, fisheries, tourism, and shipping. “For the 350 million people who live and farm on deltas around the world, coastal wetlands provide a key link in the food chain,” said JPL’s Marc Simard, principal investigator of NASA’s Delta-X mission and co-author of the paper.
A map of soil accretion in coastal Louisiana showing higher buildup in parts of Atchafalaya and the “Bird’s Foot Delta,” where the Mississippi River system deposits mineral-rich sediment during flood periods. Credit: Jensen et al, Journal of Geophysical Research: Biogeosciences
Seventh Largest Delta on Earth
In several airborne and field campaigns since 2016, the Delta-X research team has been studying the Mississippi River Delta, the seventh largest on Earth. The team uses airborne sensing and field measurements of water, vegetation, and sediment changes in the face of rising sea level. The Landsat analysis builds on this airborne mission. Delta-X is part of NASA’s Earth Venture Suborbital (EVS) program, managed at NASA’s Langley Research Center in Hampton, Virginia.
Pioneering Technique
The new model by Jensen and colleagues is the first to directly estimate soil accretion rates in coastal wetlands using satellite data. Working with ground-based accretion records from Louisiana’s Coastwide Reference Monitoring System, the scientists were able to estimate amounts of mineral sediment from water pixels in the Landsat imagery and organic material from the land pixels.
The researchers said their approach could be applied beyond Louisiana because wetland loss and resiliency is a global phenomenon. From the Great Lakes to the Nile Delta, the Amazon to Siberia, wetlands are found on every continent except Antarctica. And they are declining in most places.
Wetlands are Most Vulnerable Ecosystems on Planet
The researchers called wetlands some of the “most vulnerable, most threatened, most valuable, and most diverse” ecosystems on the planet.
But they also said a new generation of spaceborne tools, such as synthetic aperture radar, can increasingly inform conservation policies on the ground. This is because satellites support near-continuous mapping of ecosystems at a scale and consistency that is nearly impossible through traditional surveys and field work.
50% Less Carbon Being Buried
The futures of our wetlands and coastal communities are intertwined with climate change, so sustainable management is critical. They store decomposing plant matter in soil and roots. Thus, wetlands act as “blue carbon” sinks. They prevent some greenhouse gases (carbon dioxide and methane) from escaping into the atmosphere.
But when vegetation dies, drowns, and fails to grow back, wetlands can no longer bury carbon in soil.
At current rates of wetland loss in coastal Louisiana, carbon burial may have decreased 50% from 2013 estimates.
“Forty percent of the human population lives within a hundred kilometers of a coast,” Simard said. “It’s critical that we understand the processes that protect those lands and the livelihood of the people living there.”
https://i0.wp.com/reduceflooding.com/wp-content/uploads/2022/11/Gain-Loss.jpg?fit=1200%2C610&ssl=16101200adminadmin2022-11-11 15:47:052022-11-11 15:59:58Louisiana Loses Hundreds of Square Miles of Wetlands
Wetlands provide free stormwater retention. They also provide valuable habitat that supports a remarkable level of biodiversity. In terms of the number and variety of species supported, wetlands rival rainforests and coral reefs. Trouble is, they also provide cheap land for developers. That brings people into direct conflict with wildlife.
Nesting waterfowl make a pretty good biologic indicator of wetlands.
Property Rights vs. Right to Life and Right to Information
By law, it’s illegal to disturb migratory birds such as herons and egrets while they are nesting. But the contractors in question did not respect that law even though they could have waited a month or two.
Don’t get me wrong. I’m all for property rights. And I support responsible development. But that means finding balance. Balance sustains life. It also provides beauty that supports property values. Would you rather raise your kids in biological barrens? Or in close to nature in a place teeming with life?
Finally I believe in the right to information that helps people make informed decisions and markets self-regulate. For instance, if people fully knew the flood risk on a piece of property before buying it, that knowledge could reduce demand, perhaps moderate prices, and discourage future development of wetlands.
But sadly, flood potential is often the last thing buyers look at. At closing, they’re probably provided with a survey that shows they’re above the base-flood elevation (aka the 100-year or 1%-annual-chance floodplain). Then it’s “Where do I sign?” And, “When can I move in?”
But a little investigation with free apps or on public websites, might help buyers drive harder bargains that would pay for the foundation leveling they will probably need eventually.
FromU.S. Fish and Wildlife Service National Wetlands Mapper.This shows the wetlands that used to exist in the area where the birds were killed and maimed.1944 Aerial Photo of same area from Google Earth Pro.Cherrywood Bend Drive is where contractors were clearing land when they encountered the nesting egrets and herons.
The thoughts expressed in this post represent opinions on matters of public concern and safety. They are protected by the First Amendment of the US Constitution and the Anti-SLAPP Statute of the Great State of Texas.
https://i0.wp.com/reduceflooding.com/wp-content/uploads/2022/05/20220519-Screen-Shot-2022-05-19-at-11.12.49-AM.jpg?fit=1200%2C680&ssl=16801200adminadmin2022-05-19 14:58:262022-05-20 12:17:52Wetlands Once Covered Area Where 138 Nesting Birds Were Slaughtered, Maimed
How soon we forget. Hurricane Harvey was just 4.5 years ago. Since then I have documented dozens, if not hundreds of questionable practices that erode margins of flood safety.
It Didn’t Have to Be That Bad
Harvey was the largest rainfall event in the history of North America. However, with better regulations and construction practices, it didn’t have to be as destructive as it was.
Lax regulations;
Willful blindness;
Development and construction practices that pushed the safety envelope;
Relentless destruction of forests and wetlands near rivers and streams;
And homebuyers who didn’t realize their true flood risk…
…made Harvey’s destruction worse than it otherwise would have been.
No one factor by itself would explain Harvey’s destruction. But put them all together, and it’s like “death of a thousand cuts.”
The sheer volume of material – more than 1,000,000 words on this site – makes it difficult for people to see the big picture sometimes. To put 1,000,000 words into perspective, the average novel contains only about 100,000. So I’m condensing the website into a book that includes the themes below.
No One Wins Arguments with Mother Nature
During an interview with Milan Saunders and his daughter Lori, Milan said, “No one wins arguments with Mother Nature.” How profound! It doesn’t matter how many surveys, studies and engineer stamps you have on your home’s title. If you don’t:
Large islands built up during Harvey blocked both drainage ditches and rivers. Below, you can see a large sand island (top) built up at the confluence of the Kingwood Diversion Ditch where it reaches the San Jacinto West Fork at River Grove Park. This sand bar reached 10-12 feet in height above the waterline and helped back water up into Trailwood, the Barrington and Kingwood Lakes and Kings Forest. Before the Army Corps dredged this island, River Grove flooded five times in six months. It hasn’t flooded since.
The Kingwood Diversion Ditch and West Fork San Jacinto were almost totally blocked by sediment dams deposited during Harvey.
The second photo above was taken a few hundred yards downstream on the West Fork from the first. It shows “Sand Island” – so nicknamed by the Army Corps. It took the Corps months to dredge this island which they say had blocked the West Fork by 90%.
A certain amount of this sedimentation can be explained by natural erosion. But mankind also contributed to the sheer volume by other practices which I will discuss below.
Influence of sand mines of West Fork San Jacinto water quality.
End the War on Wetlands
Wetlands are nature’s detention ponds. During storms, they hold water back so it won’t flood people downstream. But we seem to want to eradicate wetlands. The images below show the Colony Ridge development in Liberty County. Wetlands (right) are being cleared (left) to make way for the world’s largest trailer park. The acceleration of runoff wiped out FM1010 during Harvey. The road still has not been repaired.
Colony Ridge in Liberty County.
Conservation Costs Much Less than Mitigation
Halls Bayou at I-69 near Fiesta. Image on left shows whole subdivisions that that to be bought out before detention ponds on right could be built.
Respecting Individuals’ Property Rights While Protecting Others’
In Texas, it sometimes feels that an individual’s right to do what he/she wants with property trumps others’ rights NOT to flood. You may think you’re protected by all those public servants reviewing and approving plans. But what happens when developers and contractors decide to ignore the approved plans? Here’s a prime example: the Laurel Springs RV Resort near Lakewood Cove.
About 10% of all the water coming down the West Fork at the peak of Harvey came from Crystal Creek in Montgomery County. But the wetlands near the headwaters of Crystal Creek are currently under development. And the developer is avoiding building detention ponds with a “beat-the-peak” survey. This loophole allowed by Montgomery County says that if you get your stormwater to the river faster than the peak of a flood arrives, then you’re not adding to the peak of a flood and you don’t have to build detention ponds. So developers conduct timing surveys to reduce costs and maximize salable land.
What happens when upstream areas develop without consideration for the impact on downstream property owners.
Of course, speeding up the flow of water in a flood is the opposite of what you want to do. To reduce flooding, you should hold back as much water as possible.
The graph on the right shows what happened on Brays Bayou without suitable detention upstream. Floodwaters peak higher, sooner. Harris County has spent more than $700 million in the last 20 years to remediate flooding problems along Brays.
How much will we need to spend when more areas like Mavera get built upstream on the West Fork?
How Quickly We Forget!
FEMA’s Base-Flood-Elevation Viewer shows that in that same area, developers have already built homes that could go under 1-5 feet of water in a 100-year flood. These homes are actually in a ten-year flood zone. And yet more homes are being built nearby. On even more marginal land!
In recent years, the price of land as a percent of a new home’s cost has risen from a historical average of 25% to approximately 40% today. This puts pressure on developers to seek out cheaper land in floodplains, reduce costs by avoiding detention pond requirements, pave over wetlands, and reduce lot sizes resulting in more impervious cover. All contribute to flooding.
Of course, smart homebuyers would not make such risky investments. But few lack the expertise to gauge flood risk. Educating such homebuyers will be one of the major objectives of the book I hope to write.
Posted by Bob Rehak on 2/23/2022
1639 Days since Hurricane Harvey
The thoughts expressed in this post represent opinions on matters of public concern and safety. They are protected by the First Amendment of the US Constitution and the Anti-SLAPP Statute of the Great State of Texas.
https://i0.wp.com/reduceflooding.com/wp-content/uploads/2019/11/RJR_4245.jpg?fit=1500%2C1000&ssl=110001500adminadmin2022-02-23 18:55:302025-08-19 22:13:53How Soon We Forget!
Sprint Sand & Clay, the company hired by Harris County Flood Control to excavate 500,000 cubic yards of dirt from Woodridge Village, began hauling some of it to the controversial Laurel Springs RV Resort near Lakewood Cove this morning.
Wake-Up Calls
My phone started blowing up before breakfast with dozens of complaints about Sprint truck traffic. So, I began investigating. I first went to the Woodridge Village site. Drone photos and on-the-ground observations revealed that Sprint was indeed hauling dirt from the Woodridge Village excavation site.
SW corner of Woodridge Village taken Wednesday 2.9.22. Sprint trucks line up to haul off dirt.
I followed one of the trucks all the way to Laurel Springs Lane where I observed it dumping its load. Along the way and at each end, I saw many more Sprint trucks – up to four at a time. There was a veritable parade of dump trucks making round trips along Woodland Hills Drive, Kingwood Drive, Chestnut Ridge, and Laurel Springs Lane.
Orange truck from above enters RV site several minutes later and turns toward detention pond.The orange truck dumps its load just north of the pond near an area marked as the 500-year floodplain. Other equipment spreads it out.
Will Storm Drains Be Adequate?
Sprint trucks had also dumped dirt near a new “north entrance” to the site.
In the shot above, note the ponding water from 0.2 inches of rain more than a week ago. The contractor’s Stormwater Pollution Prevention Plan describes this soil as “silty sand” to a depth of 18 inches (Page 18).
They may want to recheck that before installing more storm drains.
Other Issues Noted Today
Most trucks that I observed used what has now become the “south” entrance. The fresh load of bullrock laid down days ago has already been covered with mud. That accounts for all the dirt tracked into the street. While the storm sewers were still unprotected from dirt, at least a street sweeper was onsite today.Another unprotected storm sewer and contractor taking water from City fire hydrant. Photo courtesy of Robin Seydewitz.All the dump trucks I observed were this large size, not the kind that holds 10 cubic yards.
Good News/Bad News
The start of serious excavation at Woodridge Village comes as welcome news to the people of Elm Grove and North Kingwood Forest who flooded twice in 2019. However, it’s equally worrisome to the people of Forest Cove and Lakewood Cove. Many expressed concerns about potential flooding.
Risks from Building Up Land
Should existing residents be concerned about that? Yes, was the answer I got from one respected hydrologist who spoke on condition of anonymity. He likened the built-up area to a berm and said that “You don’t want a berm to stop overland sheet flow.”
The elevation survey shown below comes from the RV park’s Stormwater Pollution Prevention Plan. It shows that the land naturally slopes from northeast to southwest. Building up the RV property would definitely prevent water from the NE from flowing in that direction. Sheet flow would divert south along Laurel Springs and put an evacuation route at risk.
Survey shown in developer’s Stormwater Pollution Prevention Plan shows elevation going from 83.1 in the NE to 61.4 in the SW, a difference of more than 20 feet.
East to west along the southern boundary, the elevation drops from 67 feet at Laurel Springs to 61 feet near the railroad tracks.
Another risk is that sheet flow with nowhere else to go could back up Lakewood Cove storm sewers at the same time that the RV park is trying to pump water into them to compensate for its undersized detention pond.
If someone sustains water damage on their property due to a neighbor’s property, questions as to who may be liable may arise. Surface water runoff — most often caused by excess rainwater — is the common culprit. Texas law holds landowners responsible for damage to neighboring property due to diversion of surface water.
I received a copy of the RV Park’s SWPPP plan today from the TCEQ. Parts of it made me laugh out loud. For instance, the section about “Receiving Waters, Wetlands and Special Aquatic Sites” said:
“No existing wetlands or other special aquatic sites have been identified at or near this site [Emphasis added].”
Page 18 of Laurel Springs RV Park SWPPP prepared by Construction Eco Services
Obviously, they didn’t glance across the southern property line or consult the National Wetlands Database. I can’t wait to read the rest of this plan to uncover more gems.
From US Fish & Wildlife Service National Wetlands Inventory Mapper. The RV Park is going in just above the large green area labelled PF01A Future Edgewater Park.
Posted by Bob Rehak on 2/9/22
1625 Days since Hurricane Harvey
https://i0.wp.com/reduceflooding.com/wp-content/uploads/2022/02/20220209-DJI_0838-e1644458655903.jpg?fit=1200%2C799&ssl=17991200adminadmin2022-02-09 20:26:572022-02-09 23:01:35Dirt Excavated from Woodridge Being Used to Build Up Laurel Springs RV Resort
US Fish & Wildlife Map Shows Wetlands Dot Development
From US Fish & Wildlife Service National Wetlands Inventory. Madera will stretch past the left/right edges of this picture north of SH242 (the east/west highway near bottom.) FM1314 bisects picture from N to S in middle.
FEMA’s Base Flood Elevation Viewer Shows Flood Risk
Note that this survey shows only about a quarter of Madera (see below). The survey stops abruptly on the western margin. So, it is hard to say with certainty how bad flooding is throughout the rest of the site.
Yellow outline shows approximate outline of FEMA BFE survey shown above within Madera tract(black/white outline).
Option to See Depth of 100-Year Flood Waters
Also note that the purple area shows only the extent of 100- and 10-year floods. However, within the FEMA BFE viewer, you also have the option to select a layer that illustrates the depth of 100-year floodwaters. See below. (FEMA does not offer the option to show the depth of 10-year floods.)
FEMA’s estimated Base Flood Elevation Viewer showing extent of 100-year flood on left and depth on right.
Limitations of BFE Viewer
Of course, FEMA shows “estimated conditions” before developers bring in fill and alter drainage. But notice how a pre-existing development near Madera would fare in the same 100-year flood. You can see the close up below just above SH242 near the right edge of the image above.
FEMA shows that most homes in this development are still in the flood zone and would still flood to a depth of 1-2 feet in a hundred-year flood.
The street leading out of the development to SH242 could be under more than FIVE FEET of water in places!
FEMA Base flood Elevation Viewer
FEMA’s “Estimated Base Flood Elevation” is “The estimated elevation of flood water during the 1% annual chance storm event.” Structures below the estimated water surface elevation may experience flooding.” A 1%-annual-chance flood is also known as a 100-year flood. FEMA defines properties with a 1% annual chance of flooding as having “high flood risk” and says they have a 26% chance of flooding during the life of a 30-year mortgage.
Purposes of BFE Viewer
The agency developed its Base Flood Elevation viewer with several purposes in mind. To:
Inform personal risk decisions related to the purchase of flood insurance and coverage levels.
Inform local and individual building and construction approaches.
Prepare local risk assessments, Hazard Mitigation Plans, Land Use Plans, etc.
Provide information for “Letter of Map Amendment” (LOMA) submittals.
A LOMA lets the developer of a subdivision change the depiction of how flooding affects his/her subdivision. It’s the key to offering up-to-date risk assessments.
Full BFE Reports Available
FEMA also lets you download or print full BFE reports that give more specific estimates of flood depth at exact points, not just within a wide area.
FEMA’s BFE Viewer also gives you the option to print out a detailed flood-risk report by clicking on a point.
At the point shown above, you could expect 4.2 feet of water above the land surface in a 1%-chance flood. For the full report, click here.
Here’s what that point looked like last Saturday (1/22/22) from the air.
Madera development today at FM1314 and SH242, the point shown in BFE report above.
Cross-check this area on the maps above for wetlands and swamps! Then you can see why it’s so soupy.
BFE, Fill Not Mentioned in Drainage Analysis or Construction Plans
Text searches of Madera’s construction and drainage plans showed no references to “BFE” or “base flood.”
It seems unlikely that a “cut and fill” operation could excavate enough dirt from Madera’s drainage channel (dotted blue line with red parallel lines) and detention ponds to raise the whole site out the hundred-year flood zone. Five feet is a lot of fill for a 1700 acre site.
To raise a site this large, contractors would likely have to bring in fill from outside the property. But a text search from the word “fill” did not turn up any exact matches either.
So maybe they’re just planning to create the world’s biggest drain and hope to carry water off before it can reach homes.
However, a summary of the Madera master drainage plan notes…
“Coordination with MCED [Montgomery County Engineering Department] andadjacent property owners is recommended … on the potential need for inundation easements.”
The thoughts expressed in this post represent opinions on matters of public concern and safety. They are protected by the First Amendment of the US Constitution and the Anti-SLAPP Statute of the Great State of Texas.
https://i0.wp.com/reduceflooding.com/wp-content/uploads/2022/01/20220125-Screen-Shot-2022-01-25-at-3.52.07-PM.jpg?fit=1200%2C600&ssl=16001200adminadmin2022-01-27 06:08:242022-01-27 06:22:32New MoCo Development Being Built on Wetlands in 10-Year Flood Zone
This is Part II in a series about how to find and verify flood-related information. Yesterday’s post focused on finding good information about flood vulnerabilities. This second part will focus on reviewing developers’ plans. The second can compound the first.
The very first sentence of the Texas Water Code § 11.086 begins with a warning not to flood your neighbors. It says, “No person may divert or impound the natural flow of surface waters in this state, or permit a diversion or impounding by him to continue, in a manner that damages the property of another by the overflow of the water diverted or impounded.”
The second sentence declares that a person injured by diverted water may sue to recover damages. Of course, at that point the damage has already been done. Lawsuits are expensive and take years. And the defendant, usually a developer, will always point to plans prepared by a professional engineer and approved by a government body. Suing them will require expert witnesses. And the defendant will likely claim that you wouldn’t have flooded except for an Act of God.
Lawsuits are tall, expensive mountains to climb. So concerned residents near new developments are better off closely scrutinizing plans before they’re built and closely monitoring construction to ensure developers follow the plans.
You can’t stop development. But you can ensure developers play by the rules.
But how do you find and verify their plans?
Need to Find and Verify Info
If you notice a large piece of property for sale near you, monitor it closely. Check with the listing agent. Also check Houston’s Plat Tracker website. It’s updated before every meeting of the Planning Commission and shows items on their agenda. Houston also maintains a map-based website that shows projects in various stages of approval throughout the City and its extra-territorial jurisdiction.
Leap into action if you find a potential cause for concern near you. The next step is to obtain the development’s plans, the drainage impact analysis and soil tests. The developer must prove “no adverse impact” to people and properties downstream.
How you obtain those plans and studies depends on the development’s location. If inside a municipality, check with your city council representative. If you live outside a municipality, your best starting point will probably be your county engineer or precinct commissioner.
The plans are public information and must be provided in response to Freedom of Information Act (FOIA) Requests.
Signed, Stamped, Approved and So Obviously Wrong
In every case I reviewed during the last four years where someone flooded because of a new development, something jumped out of the plans that should have raised concerns for reviewers, but didn’t.
For instance, after Colony Ridge engineers apparently mischaracterized soil types, Plum Grove flooded repeatedly. The engineer said soils would let more water soak in than actually could. That meant the developer didn’t have to build as many detention ponds and could sell more lots. But it also contributed to flooding homes downstream.
Concerned citizens must learn how to obtain and review such plans for potential problems or hire a consulting engineer.
Here are some things I’ve learned to look for.
Soil Tests
Are they accurate? Were the samples taken at representative points? Or did they conveniently ignore wetlands? Permeability of the soils will affect the amount of detention needed. The level of the water table could affect the amount of detention provided.
If plans call for a ten-foot deep detention pond, but the soil test encounters a shallower water table, that will compromise the pond’s capacity. Capacity should be calculated from the top of standing water, not the bottom of the pond. If the pond is already half full, that half shouldn’t count.
Floodplain maps in Harris County are currently being revised. That may not be the case in surrounding counties. The lack of updated flood maps endangers current residents, by letting developers build to old and ineffective standards.
Developers often try to beat the implementation of new requirements. This happened in the case of Woodridge Village. It’s also happening in the case of the Laurel Springs RV Park and Northpark South along Sorters-McClellan Road. The entrance to the Northpark development sits in a bowl. A quick check of the elevation profile on the USGS National Map confirmed that. During Harvey, local residents tell me that not even high-water rescue vehicles could get through that intersection. Put the Cajun Navy on standby now.
Wetland Issues
Filling wetlands requires an Army Corps permit for some, but not all wetlands. Whether they fall under the Corps’ jurisdiction depends on how far up in the branching structure of a watershed they are. Those near the main stem are jurisdictional. Three levels up may not be.
The US Fish and Wildlife service has thoroughly documented wetlands in this area. Check their National Wetlands Database and appeal to the Corps if you find a problem. At a minimum, the developer may be forced to buy mitigation credits somewhere nearby, which could help reduce flooding.
Drainage Issues
Is a new development’s detention pond capacity adequate? Is it based on the right percentage of impermeable cover? If the pond(s) fill up, where will the water go?
Calculating detention capacity requires math skills most people don’t have. But you can check the basis for the calculations. Are plans based on new Atlas-14 requirements? Are plans meeting current Houston and Harris County requirements?
Current City of Houston and Harris County Requirements for Detention Pond Capacity
Also see where they’re routing excess water in case of an overflow.
In the case of the Laurel Springs RV Park, the developer said they would route the water to a detention pond near Hamblen and Laurel Springs in anything greater than a two year rain. See below.
Screen Capture from Laurel Springs RV Resort Drainage Impact Report shows that in anything greater than a 2-year rain, overflow water will could threaten homes in Lakewood Cove.
RV Park Site Outlined in White. Overflow described above would presumably follow red path.
Laurel Springs RV Park as of 11/29/21. Detention pond will go in foreground, but overflow will go into pond at top of frame according to text above.
Missing Details from Drainage Impact Analysis
I have requested additional details three times from the City but still have not received them. I suspect they may not exist. All other plan requests have been filled.
So what happens when the Lakewood Cove detention pond fills up? Or gets covered up in a flood? Overflow from the RV park will contribute to flooding someone downstream.
The developer also said excess capacity would get to the Lakewood Cove pond by overland sheet flow. That could threaten homes on the southwest corner of Lakewood Cove – visible in the middle of shot above.
But a City engineer reviewing the plans said overflow would follow the railroad tracks on the western side of the RV park. Hmmmm. Two engineers – one who developed the plans and another who approved them – 180 degrees apart. What’s a concerned citizen to do?
If the engineers who develop and review such plans were always right, no one would ever flood. But we do. So always find and verify those plans.
The thoughts expressed in this post represent opinions on matters of public concern and safety. They are protected by the First Amendment of the US Constitution and the Anti-SLAPP Statute of the Great State of Texas.
https://i0.wp.com/reduceflooding.com/wp-content/uploads/2021/11/20211129-DJI_0877-2.jpg?fit=1200%2C799&ssl=17991200adminadmin2021-11-29 19:09:202021-12-08 15:51:19How to Find and Verify Flood-Related Information: Part II
Valley Ranch, the new downtown of East Montgomery County, seems to be exploding with growth. The northwest quadrant of I-69 and the Grand Parkway developed first. Now the focus is shifting to the southwest quadrant where more than 500 acres are being cleared near the banks of White Oak Creek. People downstream from I-69 to Caney Creek have experienced flooding recently. This raises the questions, “Will the flood mitigation measures being put in place at Valley Ranch be enough?” and “In general, are we winning or losing the battle to reduce flooding?”
The Relentless Forces of Development vs. Battle to Reduce Flooding
Last week, I posted about the new Amazon distribution center, shown above at A. Today, I’d like to focus on four areas west of Amazon, shown as 1-4. All sizes below are approximate. I used the measuring tool in Google Earth.
Most of Area 1 just south of the Grand Parkway will be future retail space dubbed “Marketplace.”
Area 1 looking SW from over the Grand Parkway will contain retail. However, apartments are now going up in the far top left corner.What’s that soupy area in the middle? See below.US Fish and Wildlife Service (USFWS) Wetlands Mapper shows a wetland area that corresponds to the soupy area in photo above this one.Here it is again. Looking north toward the future Marketplace and the Grand Parkway. Closer shot of apartmentconstruction.
Area 2: Commercial District
Looking East from over Grand Parkway toward I-69. Commercial area is the clearing in the distance. White Oak Creek is the wooded area that runs diagonally through the frame.Closer shot of commercial area.From over White Oak Creek looking N toward Grand Parkway. I-69 on right.
Areas 3 and 4: Medical District
Medical District looking SW from over I-69.
You can tell by the amount of standing water on this property that drainage could be an issue. Note below how the standing water coincides with the former wetlands mapped by USFWS below.
Sediment control during clearing becomes a real issue for sites like this. Note the series of trenches channeling standing water toward the storm drain on the I-69 feeder road below.
Looking W from over I-69 across southern portion of Medical District. Note attempts to drain the site through the storm sewer in the foreground.
That basket of rocks is supposed to filter out sediment before it reaches the drain. But when I enlarged the image, look what I found.
Someone trenched around it! Reverse angle of same arealooking E toward I-69 shows two large detention ponds under construction on left.
We Need Regional Flood-Mitigation Scorecard
The pace of development seems to be faster than the pace of flood mitigation.
Certainly, responsible developers exist who retain their rain. This may be one. That remains yet to be seen. But other developers exist who do not retain their rain. The question is, “Are there more irresponsible developers than the responsible kind?
Posted by Bob Rehak on 11/9/2021
1533 days since Hurricane Harvey
https://i0.wp.com/reduceflooding.com/wp-content/uploads/2021/11/20211106-DJI_0785.jpg?fit=1200%2C799&ssl=17991200adminadmin2021-11-08 16:16:532021-11-08 16:27:27Are We Winning or Losing the Battle to Reduce Flooding?