In addition to monitoring sand mining legislation, I have spent the last several days drafting and redrafting my own letter to the Army Corps and TCEQ about the proposed new high-rise development for Kingwood.
I’m not done with my letter yet. I keep discovering alarming facts. They raise questions about the wisdom of such a development in a fragile, wetlands environment.
Surprising Discoveries
A marina to hold 640 yachts could fill the the entire West Fork. Lined up bow to stern, they would stretch at least 16,000 feet – the entire distance from the marina to the mouth bar. Talk about traffic jams and impacts on navigation! (Hint: Navigation is one of the things that the Corps considers.)
Then I started to think about the population increase and the water supply. Five thousand condos at 2.71 people per household (Kingwood average) PLUS a 50 story hotel, would add about 15,000 people to Kingwood’s population – about a 20 percent increase.
Kingwood is on well water drawn from the Evangeline Aquifer. USGS shows that the water level in the aquifer is decreasing at the rate of 1.7 feet per year, but only recharging at one-tenth of one inch per year, We’re using up the aquifer 200 times faster than the recharge rate! A twenty percent increase would kick that rate up to 240X. (Hint: the Corps also considers impacts on the water supply.)
Depletion rate of the Evangeline aquifer near the site of the proposed high-rise development in Kingwood is unsustainable.
Think maybe this could have to do with increasing rates of subsidence and your foundation problems? Check out this AP article that shows what subsidence is doing in Tehran. (Hint: the Corps considers environmental impacts, safety, economics, and the welfare of the public, too.)
Wrong Number and a Hang Up
With that pleasant thought, I decided to call the developer to see if we could talk about some of my concerns. Surprise! The developer does not answer the phone number listed in the Public Notice. The people who answer the phone tell me I have the “Wrong number” and hang up. So I sent a certified letter requesting a public meeting to discuss these issues. We shall see if he responds. Many of the phone numbers for the developers’ other companies are not live. It kind of makes you wonder who you’re dealing with.
Putting it All into Perspective
The deeper I dig, the more concerned I become about connections between the high-rise development, sand mining and legislation. Are we encouraging unsustainable practices? Stay with me for a second.
In a vastly overpopulated near-future world, businesses have taken the place of governments and now hold all political power. The public is constantly deluded into thinking that all the products on the market improve quality of life.
The book illustrates how production/consumption cycles thrive. On a small scale, think about movie theaters putting more salt on popcorn, so you’ll buy a $5 soft drink that costs a penny to make.
On a grander scale think about sand mining in the flood plain to get cheap sand. So that these developers can build high rises in the flood plain. And sell them thanks to below-cost government flood insurance. That you and I pay for with our taxes. When all we really wanted to do was take a walk by the river and enjoy the serenity … that’s being destroyed.
Nesting pair of great egrets seconds after their first egg hatched. I call this shot, “Proud Parents.” By Bob Rehak.
It also reminded me of a movie called Koyaanisqatsi released in 1982. Francis Ford Coppola executive-produced it. It’s 90 minutes of world-class cinematography. The visual tempo increases from languid when we see nature photography in the beginning – to frenetic at the end when we see nature being overpowered by man and technology. Imagine time-lapse photography applied to evolution that accelerates at a dizzying pace.
The title, a Navajo phrase meaning “life out of balance”, is revealed at the end. The movie makes its point without speaking a word. It created an impression that’s still vivid after 35 years. I highly recommend it if you want to feel what’s happening to the San Jacinto in your bones.
The book, the movie, the high-rise development and the sand mines make you want to scream “Enough already.” We need to restore balance. Live life in harmony with nature. Isn’t that what we wanted for our children when we decided to buy homes in Kingwood?
I’m sure that someone will say, “But we need the tax revenues.” To which I will say, “If we weren’t destroying our own environment maybe we wouldn’t need such high taxes.
A couple hundred million tax dollars to dredge!? Maybe that sand isn’t so cheap after all. I know emotion won’t sway the Corps and TCEQ, but dammit, “Enough already!”
Posted by Bob Rehak on January 25, 2019
514 Days since Hurricane Harvey
As always, these represent my opinions on matters of public police. They are protected by the First Amendment of the United States Constitution and the Anti-SLAPP statute of the Great State of Texas.
https://i0.wp.com/reduceflooding.com/wp-content/uploads/2019/01/RJR_0996-Version-2.jpeg?fit=1280%2C850&ssl=18501280adminadmin2019-01-25 20:36:392019-01-26 05:54:54Life Out of Balance
Two top retired geologists for one of the world’s largest oil companies have sent letters to the US Army Corps of Engineers and TCEQ protesting the new high-rise development in Kingwood. They raise some excellent points from a technical perspective that other letter writers have not yet addressed.
Wetlands on the site of the proposed high-rise development retain and filter water. They help protect this area from flooding and improve water quality. The proposed development would fill in wetlands like this and purchase “mitigation credits” elsewhere.
Tim Garfield and RD Kissling, who led the fight to raise awareness of the mouth bar, wrote this letter. They have kindly given me permission to share their concerns with other residents in the Lake Houston Area.
Text of Letter
January 22, 2019
Evaluation Branch, North Unit Regulatory Division CESWG-RD-E Galveston District, U.S. Army Corps of Engineers P.O. Box 1229, Galveston, Texas 77553-1229
Provide feedback on Permit Application No. SWG-2016-00384
Request a Public Hearing be held before any decisions are made on this permit application.
We, and other Kingwood residents we have talked to have observed that the Project associated with Permit Application No. SWG-2016-00384, is so ill conceived in so many ways, that it “just doesn’t smell right”.
What we and other Kingwood residents absolutely don’t want is for this ill-conceived Project to go forward to the point where earth moving and tree removal takes place, then (following even a minor flooding event or economic turn) for the whole Project to fold (like adjacent Barrington development has done multiple times) leaving the San Jacinto River with another giant scar in what used to be a landmark Riparian Forest.
Re: Public Notice for Permit Application SWG-2016-00384
The USACoE states in Public Notice for Permit Application SWG-2016-00384issued on December 27, 2018, that their evaluation shall include all factors which may be relevant to the proposed Project under evaluation. Among these are: conservation, economics, aesthetics, general environmental concerns, wetlands, historic properties, fish and wildlife values, flood hazards, floodplain values, land use, navigation, shore erosion and accretion, recreation, water supply and conservation, water quality, energy needs, safety, food and fiber production, mineral needs and, in general, the needs and welfare of the people. They also state that the benefits, which reasonably may be expected to accrue from the proposal, must be balanced against its reasonably foreseeable detriments.
Following our review of the proposed Project it is very clear to us that the foreseeable detriments of this project far out way any perceivable benefits as indicated by the factors listed below. These identified factors should be fully evaluated by TCEQ and the USACoE, be subject to Public Hearing and used by TCEQ and the USACoE as a basis for permit denial:
Conservation
The Project proposes to fill numerous acres of pine and hardwood riverine wetlands, home to a diverse biota, and replace that with multiple residential high rises, parking lots, commercial buildings, a high-density marina and related amenities. These proposed activities are the antithesis of conservation of a unique and increasingly rare ecosystem.
Economics
We believe there is no conceivable financial viability to the proposed Project for multiple reasons, including those detailed below:
– The “marina”, even if dredged to the depth needed to support larger boats, would feed to an un- navigable water body (The West Fork , San Jacinto River; NW Lake Houston) that contains numerous shoal areas with as little as 1-2’ of draft. The proposed marina would accrue limited benefit to the project unless the builders also committed to extensive and ongoing dredging. At normal lake/river stage (42.5′) there is now very limited access for most types of recreational boats to navigate from Lake Houston to the proposed marina area due to river sediment that has accumulated within and at the mouth of the river (stream mouth bar/SMB). To remove the stream mouth bar sediment and do maintenance dredging on the West Fork of the San Jacinto River from the proposed marina down to Lake Houston would incur dredging costs that could exceed $100M. Is the Developer willing to consider this as a cost of business needed to make the Project viable? If removal of the stream mouth bar downstream of this development is not addressed then there can be no foreseeable economically viable outcome for this Project.
– Data over the last 3 years has shown increasing frequency of flooding in this area with only moderate rainfall. Hurricane Harvey showed the economically calamitous impact of a major rain event. The SMB blocking the flow of water from the river to the lake is a significant cause of upstream flooding, and that flow barrier continues to grow. While the Developer may be able to elevate some of the development areas by infill above the (current) 100- year flood stage, the marina area – at lake level – will be subject to damage by nearly every storm that comes into the San Jacinto River Basin (e.g. adjacent River Grove Park and FFA regularly flood and still hold standing water). Can the project economics remain viable when incorporating costs of continuous flood reclamation? What client would ever purchase or take a lease on any of these facilities if they did any due diligence regarding these circumstances? If yet another major flood event hits that area either during construction or after completion (look at impact of Harvey on the new HEB development in Kingwood) – the costs of recovery would fully erode any conceivable economic viability.
– Water quality in this area is always turbid/muddy, in part due to the effects of the mines upstream which contribute sand and mud to the water and may also introduce additional toxins. That won’t likely change in the near future and is not consistent with the image or the name the developers have attached to the proposed marina basin – “Emerald Lake”. Given the difference between the true nature of this muddy water body with the artist’s renderings – what potential customers would not feel deceived upon visiting the site.
-They are building around an area – Barrington – that was built on 6+ ft of fill. Houses there had as much as 6’ of water during Harvey. To exceed most recent local flood heights in an area that appears to be in the heart of the current floodway, they would need over 12 ‘ of fill which would create two potential problems:
1) Fill and associated buildings in the floodplains would create islands, impacting flood drainage patterns and likely contribute to flooding in adjacent areas during high water. An extensive drainage and flood impact study would be needed to address this.
2) Structural integrity? The area is underlain by soft recent flood-plain sediment. Adding twelve plus additional ft of fill and building 50 story high rises on top raises questions about how deep and extensive the foundation pilings would have to go to safely carry that load and at what cost?
– Road access in/out, particularly getting to 59 – would the Developer bear the significant additional road construction costs to provide direct access to the freeway or are the plans to tie into existing already congested roadways? If the latter is the case will the Developer provide traffic flow studies that show that impact on current Kingwood residents will be minimal?
– An Indoor shopping mall is advertised in the project prospectus. Such malls are going out of business all over the country, as are movie theaters, another advertised amenity. These elements are not likely to draw customers, and they seem both dated and indicative of how old and poorly researched this promotional material is.
Aesthetics
The proposed structures and activities are the opposite of the aesthetics of the Kingwood area since its inception (“The Liveable Forest”). This aesthetic is very important to the citizens of Kingwood, and should be given full consideration in reviewing and evaluating the permit application.
General Environmental Concerns, Fish and Wildlife Values
With development rapidly encroaching Kingwood from all directions, relatively wild lands such as those proposed for development are becoming increasingly rare and valuable. To replace them with such a development would erode all beneficial aspects of this Riparian wetland for plants, animals and humans.
Wetlands
The applicant is requesting to fill or flood riverine wetlands and minimize impacts by only partially filling some various small wetland areas scattered through the site. This “minimization step” will not replace the functions and values of the filed wetlands. The Developer is also proposing to buy “offset” conversation grants to make up for the damage they are going to do to Kingwoods wetlands. This is unacceptable.
Flood Hazards and Floodplain Values
We understand that the Developer “has not applied for a Harris County Flood Control Permit”. Is the Developer going to provide studies (vetted by outside experts) that show that this development will not adversely impact an already very bad flooding situation? Can they produce hard data that would show how this development could have anything but a negative impact on future flooding events (i.e. by dredging, significant retention ponds etc)? Our concern is that the extensive wetlands that are adjacent to the West Fork of the San Jacinto River are the conveyance route for almost all of the rivers overbank flow. If the wetlands, a natural water sink, are filled in and built up the developments will both displace ground water and become obstructions to flow by diverting and pushing floodwaters into adjacent areas and further up into Kingwood than before.
In the Developer’s proposal there are estimates of how much fill dirt will be required in each area. They state that they want to elevate above the 100 year flood plain (56-58′ elevation) which is approximately 12′ above current topographic elevation.When examining their estimates of fill volume however it appears that they are assuming an average fill depth of only 1′ per designated acre.This is either a gross miscalculation or, as one of their elevation cross sections suggests, only the high-rise buildings will be elevated to this +12′ level and everything else will be left at current grade. In the first case this means that they will require significantly more fill dirt in the wetlands (i.e.12x current estimate) than proposed – with significant cost and project viability implications. In the second case, it means they have a non-viable development because during future floods they will have their tall buildings stranded as islands while everything else is at or below the 100 year flood level (i.e. commercial buildings, parking garages, marina, access roads, sewage treatment plant etc.) and subject to significant damage. Which is it and at what cost?
Land Use
Part of the proposal is that they will be using fill dirt to “fill existing streams”. Those small streams exist because they move water out of upstream areas (i.e. Kingwood) into the San Jacinto River. Has the developer modeled the impact of filling in these streams on overall drainage in Kingwood?
Water Supply and Conservation
What are waste water treatment plans for this proposed project? A development of this size cannot simply force it’s way into existing infrastructure. Part of the Development Plan must include a full, on-site waste water treatment facility. Where will this be located and will it be above the 100 year flood stage level? How about the 500 year flood stage level? What are the impacts if this treatment facility is breached by floods and discharges into the City of Houston’s primary water supply? What mitigation plans does the Developer propose? At what cost?
Water Quality
The applicant proposed to convert ground now supporting native vegetation, forested uplands and bottomland hardwood wetlands into concrete pavement. The applicant’s proposed structures and paved surfaces are designed to shed runoff as quickly as possible. The proposal will also add 1000’s of additional vehicles in the proposed development area with associated petroleum residue added to runoff. The additional fertilizer and animal feces introduced into runoff from the proposed “green space” areas, will further degrade already poor existing water quality parameters. Has the Developer submitted the proper documentation to show how they plan to mitigate these impacts? Lake Houston is the primary water supply for Houston which is growing at unprecedented rates. Are we willing to jeopardize the water supply for 2+ million people by allowing a poorly planned development to add to the stress on Houston’s water supply?
Safety
We are concerned that the proposed development will have significant negative impacts on public safety in the area. These include negative impacts of higher future flood levels and potential hazards to human health and public safety due to the significant increase in road traffic. We are concerned how drainage runoff from elevated project areas to adjacent properties and associated increased flooding risk to those properties is going to be managed? This is an issue during every rain event and one that the City of Houston has failed to manage within Loop 610 (i.e. The Heights Area). In the Heights, developers build up lots 2-3′ higher than adjacent lots and fill the lot with impermeable surfaces with no mitigation for the impact of runoff on to the adjacent lots. The Barrington neighborhood, which will be surrounded by this Development, could become the retention pond for the Development during flood events, depending on how they handle grade elevation and drainage.
Needs and Welfare of the People
Most residents of Kingwood have chosen to live in this area for its natural beauty and to escape the road congestion, high population density and high-rise building environment of the inner city. These environmental preferences are enshrined in the deed restrictions issued for every other developed area in Kingwood since its inception. These esthetic considerations that are so important to the health and welfare of the citizens of Kingwood should be given full consideration.
Conclusion: Deny
We hope in the coming months, that our concerns about these factors will be carefully evaluated by U.S.A.C.o.E. and TCEQand that a Public Hearingbe held before any decisions are made on this permit application.Without any detailed information concerning the viability of the project – including dredging costs, environmental impacts, costs of elevated future flood levels, sewage disposal plans and water quality impacts and potential hazards to human health due and public safety concerns attributed to flooding and increased traffic loads; it is our opinion that the permit application should be denied by the USACE and TCEQ upon completion of the Public Notice review period. It is also requested that any revisions and supplements to this proposed Project by this applicant or any others which involve this Project be placed on a full 30-day Public Notice in order to allow all stakeholders an opportunity to provide additional comments to USACE and TCEQ.
Respectfully,
Randal Kissling Sr. Technical Geologist Major oil company – retired Crosby Tx. 77532
Tim Garfield Chief Geologist Major oil company – retired Kingwood, 77345
The thoughts in this letter represent opinions on matters of public policy. The opinions, the authors of the letter, and this website are protected by the First Amendment of the US Constitution and Anti-SLAPP statutes of the Great State of Texas.
Posted by Bob Rehak on 1/24,2019
513 Days since Hurricane Harvey
https://i0.wp.com/reduceflooding.com/wp-content/uploads/2019/01/Ditch-Erosion_03.jpg?fit=1500%2C1000&ssl=110001500adminadmin2019-01-24 14:35:022019-01-24 14:35:56Two Top Geologists Protest High-Rise Development in Floodplain with Letter to Corps and TCEQ
Note: This post contains a correction to Matt Zeve’s title; he is Deputy Executive Director at Harris County Flood Control.
The Army Corps of Engineers today released this graphic showing the extent of West Fork dredging progress to date. Dredging will extend from River Grove Park on the west King’s Harbor on the east.
Great Lakes subcontracted part of the job because it was time sensitive and Callan had a dredge that could start quickly. In fact, Callan began sooner than Great Lakes. Both companies spent considerable time on site assembling the dredges. Welding more than six miles of 24 inch HDPE dredge pipe and maneuvering it into place also required upfront time. Then both companies had to calibrate dredging rates with three booster pumps. Make no mistake; this is a huge undertaking.
Two months after the contract award, the first dredge moved downriver to its starting position on September 19th. A month later, on October 25th, the second dredge moved downriver. So out of the the 9 months, it took two and three months respectively just to start the dredging. Then we had three floods between December 7 and January 7 that caused pauses in the action.
Slow but Steady Progress
Backing out floods and prep time, we need to evaluate the progress shown above on a SIX month “actual-dredging” timetable, not the nine months budgeted for the entire job. Visually, it appears that they are roughly half completed and roughly half of the six months has expired. That’s reassuring. Especially knowing that the dredging has proved more difficult than expected. Crews periodically must stop to remove roots and aquatic vegetation from the dredge cutter heads.
Nagging Uncertainty Remains about Mouth Bar and Upstream
The questions readers keep asking, though, are “Will we be able to save all of that investment in upfront time?” And “Will we be able to start dredging the mouth bar before the start of next hurricane season starts on June 1?”
Corps bids showed that mobilization and demobilization cost 25% of the total job, roughly $18 million. Starting the mouth bar project as soon as the current project completes could save that money. It’s enough to do a lot more dredging. Maybe even open up the boat launch that the County hopes to build at its new Edgewater Park near US 59.
New Congressman Dan Crenshaw Jumping In
Dan Crenshaw, the Lake Houston Area’s new US Congressman seems to be jumping into flooding issues with both feet. He announced today that he has been appointed to Congressional Budget and Homeland Security committees. The budget committee assignment should put him in a good position to help accelerate flood mitigation measures.
Crenshaw has already met with Harris County with Flood Control District Deputy Executive Director Matt Zeve and Professional Engineer Ian Hudson to get an update on projects in Texas’s Second Congressional District. Those include both cleanup projects and flood mitigation projects. Crenshaw also met on Monday with Houston City Councilman Dave Martin, in which they discussed the importance of these projects. I also hear he is meeting the Army Corps and developers of the new high-rise project proposed for Kingwood.
New Congressman Dan Crenshaw (center) with Matt Zeve of Harris County Flood Control (r) and Ian Hudson (l).
Said Crenshaw, “Our district has been through so much because of Hurricane Harvey. I’m grateful for all the hard work our local and federal officials have done to prepare us for the next storm. I’m excited to get to work to ensure the people of TX-02 are able to make a full recovery and put Harvey in the rearview mirror.”
Something tells me that Crenshaw will bring the zeal of a SEAL to this job.
Posted on January 23, 2019 by Bob Rehak
512 days since Hurricane Harvey
https://i0.wp.com/reduceflooding.com/wp-content/uploads/2019/01/23-jan-2018-Dredging-Progress.jpg?fit=1500%2C1000&ssl=110001500adminadmin2019-01-23 17:41:232019-01-24 15:14:41Progress to Date on West Fork Dredging
Last week, Texas Governor Greg Abbott extended the disaster declaration for the 60 counties affected by Hurricane Harvey in 2017. The extension enables government agencies to work together under special rules designed to enable mitigation efforts and speed them up. See the wording in the third paragraph from the bottom. Below is the exact text of the Governor’s press release:
Governor Greg Abbott Extended The State Disaster Declaration In January For Texas Counties Affected By Hurricane Harvey
WHEREAS, I, GREG ABBOTT, Governor of the State of Texas, issued a disaster proclamation on August 23, 2017, certifying that Hurricane Harvey posed a threat of imminent disaster for Aransas, Austin, Bee, Brazoria, Calhoun, Chambers, Colorado, DeWitt, Fayette, Fort Bend, Galveston, Goliad, Gonzales, Harris, Jackson, Jefferson, Jim Wells, Karnes, Kleberg, Lavaca, Liberty, Live Oak, Matagorda, Nueces, Refugio, San Patricio, Victoria, Waller, Wharton and Wilson counties; and
WHEREAS, the disaster proclamation of August 23, 2017, was subsequently amended on August 26, August 27, August 28 and September 14 to add the following counties to the disaster proclamation: Angelina, Atascosa, Bastrop, Bexar, Brazos, Burleson, Caldwell, Cameron, Comal, Grimes, Guadalupe, Hardin, Jasper, Kerr, Lee, Leon, Madison, Milam, Montgomery, Newton, Orange, Polk, Sabine, San Augustine, San Jacinto, Trinity, Tyler, Walker, Washington and Willacy; and
WHEREAS, on September 20, 2017, and in each subsequent month effective through today, I issued proclamations renewing the disaster declaration for all counties listed above; and
WHEREAS, due to the catastrophic damage caused by Hurricane Harvey, a state of disaster continues to exist in those same counties;
NOW, THEREFORE, in accordance with the authority vested in me by Section 418.014 of the Texas Government Code, I do hereby renew the disaster proclamation for the 60 counties listed above.
Pursuant to Section 418.017 of the code, I authorize the use of all available resources of state government and of political subdivisions that are reasonably necessary to cope with this disaster.
Pursuant to Section 418.016 of the code, any regulatory statute prescribing the procedures for conduct of state business or any order or rule of a state agency that would in any way prevent, hinder or delay necessary action in coping with this disaster shall be suspended upon written approval of the Office of the Governor. However, to the extent that the enforcement of any state statute or administrative rule regarding contracting or procurement would impede any state agency’s emergency response that is necessary to protect life or property threatened by this declared disaster, I hereby authorize the suspension of such statutes and rules for the duration of this declared disaster.
In accordance with the statutory requirements, copies of this proclamation shall be filed with the applicable authorities.
IN TESTIMONY WHEREOF, I have hereunto signed my name and have officially caused the Seal of State to be affixed at my office in the City of Austin, Texas, this the 18th day of January, 2019.
High-rise development in the floodplain has pushed Lake Houston Area flood mitigation projects out of the headlines lately. So here’s an update on where things stand from Stephen Costello, the City of Houston’s chief resiliency officer and Mayor Turner’s flood czar.
Extending Dredging to Include Mouth Bar
It’s becoming increasing unlikely that we’ll be able to piggyback on the current dredging project. The City and Federal Government are still arguing about how much of the mouth bar existed before Harvey.
The mouth bar almost totally blocks the West Fork where it meets Lake Houston. FEMA and the City of Houston have argued for almost a year over how much existed before Harvey.
Regular readers may remember that FEMA and the Corps stonewalled action on the mouth bar because of the Stafford Act. The Stafford act is the enabling legislation for FEMA. It bars using disaster relief funds to address pre-disaster issues such as deferred maintenance.
The two sides argued for almost a year about how much of the bar existed before Harvey and how much resulted from Harvey. They have finally agreed on a procedure to answer that question. It’s called the Stockton Protocol and was developed at Stockton University in New Jersey to answer similar questions after Superstorm Sandy.
The protocol involves analysis of core samples from the mouth bar. According to Costello, the City hired a geomorphologist to harvest the core samples last week. It should take two to three weeks to analyze the layers in them.
Mouth Bar Disposal Issues Drag Out, Too
Another issue regarding the mouth bar has to do with disposal of the dredged materials. The City and the Corps have tried to agree on and permit a site since October 11 of last year. Three issues come into play when evaluating such sites: volume, cost and environmental considerations.
Next phases of dredging (proposed)
The site must be large enough to accommodate the volume of dredged materials.
The site must also be close to help hold down costs. The farther the site, the higher the costs. The amount of booster pumps, diesel fuel, pipeline, and manpower needed all increase with distance.
Re: environmental considerations, the Corps would prefer a below-ground site such as an old sand pit. That reduces the chance that sand and silt will end up back in the river during the next flood. It also eliminates the issue of possibly reducing the volume of the floodplain. On the other hand, above ground sites are easier to find and one exists that is much closer than any abandoned mine.
At the moment, managers are trying to find the optimal solution given all three variables.
Of course, the volume issue will depend on how much FEMA agrees to remove – after analysis of core samples and after the federal government resumes business.
Rapidly Shrinking Window to Save $18 Million
Before this process started dragging out, taxpayers had a chance to save $18 million. That represents the cost of mobilization and demobilization of the current dredging program on the West Fork. Piggybacking the mouth bar project on top of the current project would eliminate that cost for Phase II because the people and equipment would already be on site and could just continue working.
The current project should end in late April or early May. Costello says the City is already starting to look at contingency plans in case the shutdown drags on or permitting the disposal site becomes problematic.
Contingency Plans Considered
DRC, the company engaged to clean up debris in the lake, also does dredging. DRC has already bid the job and agreed to work for the same price as the current dredgers.
The leading permittee for the disposal site has agreed to store the dredges on his property if necessary until Phase II kicks off.
Current Barriers to Reaching An Agreement
But in the meantime, huge questions remain about volume and cost. With core samplings not yet analyzed, it’s hard to determine how much material will have to be removed from the river. So it’s also hard to determine whether the available money will stretch far enough to remove everything FEMA approves. At this point, the City has committed $15 million and the State $50 million. FEMA remains the big question mark.
Next steps:
Analyze core samples and agree on volume to be removed
Agree on disposal site and permit it
Determine available funds
Develop a dredging plan optimized for all variables above
Execute the plan
Status of New Gates for Lake Houston Dam
New gates for the Lake Houston dam also remain in limbo. Costello met with FEMA in December and again in early January. FEMA questions the benefit/cost analysis presented by the City. The City originally estimated a 2.8 b/c ratio for the project. That put it high on everyone’s priority lists. However, that may come down. Costello still believes the ratio will come in above 1.0, the cutoff (because benefits still exceed costs). A consultant is currently reconfiguring the estimate.
Lake Houston Dam is primarily a spillway. Small floodgates can lower lake if given enough time. But that requires starting before weather predictions acquire a high degree of certainty, thus raising the risk of wasting water if the forecast changes.
Concern about Potential for Downstream Impact
FEMA also wants assurances that new gates will not negatively impact downstream residents. The City remains confident that downstream residents will not experience impacts. The purpose of the gates is to be able to pre-release water at a controlled rate before storms hit to minimize the volume going over the spillway. Also, the county is reportedly offering buyouts to vulnerable homeowners below the dam.
If the City cannot convince FEMA that the threat to downstream residents will not increase, the City will have to look for an alternative source of funding, such as adding a penny to water bills.
Next Steps on Additional Gates
Assuming Costello can convince FEMA that there will be no negative impact downstream, the next steps would be:
Final design
Permitting
Construction
Each phase could take six months to two years, depending on unforeseen obstacles, such as political headwinds and completion of the long-awaited San Jacinto River Basin Watershed Survey.
San Jacinto Watershed Survey Status
In March of last year, the SJRA proposed a new survey of the entire San Jacinto Watershed. Projects such as maintenance dredging, additional gates, and additional upstream detention, all depend on the outcome of this study.
To properly design gates, for instance, engineers need to know the volume of water they need to shed in a given period of time.
To properly design maintenance dredging, they also need to know how fast the river is and lake are silting up.
The estimated cost of this study was about $2 million. Consultants have been ready and waiting since last April for the green light. Unfortunately, FEMA went back and forth with the SJRA and its partners on this project for eight months. According to Costello, FEMA was ready to write the check in December when the Federal Government shut down.
Next Steps:
Deposit FEMA check
Execute study
Final report
Expect this one to take 18 months from the start date.
Need to Mitigate Mitigation Funding
The saga of this study epitomizes the need to improve disaster mitigation procedures. Flooding along the Gulf Coast is foreseeable. If we budgeted for it, we wouldn’t have to depend on Washington and could save years on these projects. Two million dollars is not a great amount of money when spread out among the two million people who would benefit.
It Took 6 Months to Win the War for Texas Independence
It’s taking twice that long for FEMA to cut a check.
Think we have lost our edge? We need to get proactive and self-reliant about these things if we want the region to grow. It’s already been a year and a half since Harvey. It will take another year and a half to complete the study. Three years before the serious work of actual mitigation begins! We can do better. We must demand that our leaders reform the way the mitigation business works.
As always, these represent my opinions on matters of public policy. They are protected by the First Amendment of the U.S. Constitution and the Anti-SLAPP statute of the Great State of Texas.
Posted by Bob Rehak on January 21, 2019
511 Days since Hurricane Harvey
https://i0.wp.com/reduceflooding.com/wp-content/uploads/2019/01/LakeHoustonDam.jpg?fit=1500%2C805&ssl=18051500adminadmin2019-01-22 10:12:582019-01-22 10:24:48January Update on Lake Houston Area Flood Mitigation Projects
Letters to the Army Corps and TCEQ keep pouring in. Without exception, they protest the permitting of the proposed high-rise development near River Grove in the flood plain and floodway of the West Fork.
If researching ideas for your own letters, consult the high-rises page of this web site, specifically the right hand column. It explains the controversy and how you can protest the permitting if you wish.
I have posted many of the letters, both from groups and individuals, to help give people ideas for how this process works. Today, I received a letter from an environmental scientist who spent almost three decades with the EPA. His name is Ken Teague and his letter impressed me – for the points it made. the succinct way he made them and a unique twist.
Mr. Teague suggested trying to get the EPA to elevate consideration of the permit by asking to have the West Fork considered as an Aquatic Resource of National Importance. He gave me permission to reprint his letter. See it below.
Text of Letter from Former EPA Employee
To: swg_public_ notice@usace.army.mil; 401certs@tceq.texas.gov; Kaspar.Paul@epa.gov; Martinez.maria@epa.gov; david_hoth@fws.gov; Rusty.Swafford@noaa.gov
Subject: SWG-2016-00384
Dear Sir/Ms: I have reviewed the subject PN and have the following comments:
I suggest that the wetlands proposed to be destroyed by this project may be Aquatic Resources of National Importance, and if so, I recommend the U.S. EPA elevate review of this permit application under EPA/USACE procedures.
The applicant has not met the Clean Water Act Section 404(b)(1) Guidelines. The information provided with the PN does not support that the applicant has conducted an appropriate alternatives analysis, or demonstrated efforts to avoid and minimize impacts to aquatic habitats. I strongly recommend USACE require the applicant to demonstrate they have met the requirements of the Guidelines.
Most of the components of the proposed project are not water dependent. The one component that is water dependent, the marina, has not been demonstrated to be needed. The USACE must review the proposed project for its water dependency. Non water-dependent projects should not be permitted if they impact aquatic habitats. Water dependent projects should only be permitted if they are demonstrated to be needed.
The applicant stated an existing 17.59-acre conservation easement exists within the commercial and residential district which is associated with a compensatory mitigation area for Department of the Army Permit SWG-99-26-012 verified on 25 May 1999. This permit was conditioned to place 21.90 acres (12.19 acres of wetlands and 8.99 acres of upland buffer) into a conservation easement. It is not clear what this means, but if it means the applicant is proposing to destroy aquatic habitats that were previously preserved as compensatory mitigation as compensation for previous destruction of aquatic habitats, such impacts to such mitigation absolutely must not be permitted.
The site is subject to flooding (see attached image). I assert that it is not in the public interest for the USACE to permit development in flood prone areas, so USACE should not permit the proposed actions. The applicant proposes to greatly elevate the areas it proposes to develop using soil from an undisclosed location. This elevation will change hydrology in surrounding areas, guaranteeing that nearby low elevation properties will flood much more frequently, for a longer duration, and greater depth, than is currently the case. This will almost certainly negatively impact nearby infrastructure and habitats. Permitting such changes would clearly not be in the public interest.
The applicant has not proposed mitigation, other than to say that they will either conduct permittee responsible mitigation or purchase credits from a mitigation bank. The USACE must provide the public the opportunity to review and comment on proposed mitigation. This does not meet the requirement.
Do not permit the proposed activity.
Sincerely,
(Signed) Kenneth G. Teague, PWS, Certified Senior Ecologist
Aquatic Resource of National Importance?
I’m not sure if the specific 47 acres of wetlands are an Aquatic Resource of National Importance. But I have no doubt that the West Fork of the San Jacinto is. And these wetlands help protect that resource, by holding and filtering water before it reaches Lake Houston.
Why is it so important? Five reasons come to mind:
This reach of the West Fork connects two lakes that provide water for two million people.
It provides industrial process water for a large portion of America’s refining and petrochemical plants.
Bald eagles, a threatened and protected species, live up and down the West Fork. Hundreds of other species of birds use the river and the forests that surround it as a migration corridor.
The shores of the river contain many bottomland hardwoods, bogs, marshes and wetlands that are all integral parts of a unique connected environment.
It’s a rare and beautiful natural resource that’s easily accessible to millions of people.
Long Shot, But Worth a Try
Lake Houston communities have proved for decades that low-impact development like we now have can co-exist with this unique environment without disturbing the wildlife that make it so special. But I doubt it could survive the kind of high-rise, high-density development that Romerica Investments has in mind.
As always, these are my opinions on matters of public policy. They are protected by the first Amendment of the U.S. Constitution and the Anti-SLAPP statutes of the great state of Texas.
Posted by Bob Rehak on January 21, 2019
510 Days after Hurricane Harvey
https://i0.wp.com/reduceflooding.com/wp-content/uploads/2019/01/Image-1-5.jpg?fit=742%2C576&ssl=1576742adminadmin2019-01-21 16:36:172019-01-21 19:06:15High-Rise Protest Letter from Former EPA Scientist Suggests Unique Approach
The State of Texas has received multiple appropriations from Congress and the U.S. Department of Housing and Urban Development (HUD) for long-term disaster recovery from Hurricane Harvey. But figuring out where and how to apply for help can be tricky. It depends on where you live.
The General Land Office (GLO) runs the Homeowner Assistance Program throughout the state with the exception of the City of Houston and Harris County. Both have their own programs. If you live outside the City or Harris County, review the types of assistance available immediately below. Links to City and County programs are further below.
Warning: some of these programs are still in development. HUD approved the City and County programs only last December. Another warning: the State is still administering programs, such as Economic Revitalization, that the City and County may not have implemented yet. Things change daily, so consider the information below a starting point.
Townhomes in Forest Cove on Marina Drive destroyed by Hurricane Harvey
For Those Outside Houston or Harris County…
Homeowner Assistance Program: Provides funding for rehabilitation and reconstruction of owner-occupied single-family homes damaged by Hurricane Harvey.
Local Buyout and Acquisition Program: Local governments may buyout or acquire eligible homes at a pre-storm or post-storm fair market value to move homeowners out of harm’s way outside of a floodplain to a lower-risk area.
Homeowner Reimbursement Program: Allows homeowners to be reimbursed for certain out-of-pocket expenses incurred for repairs to their home including reconstruction, rehabilitation or mitigation up to $50,000.
Affordable Rental Program: Provides funding for rehabilitation, reconstruction and new construction of affordable multi-family housing units in areas impacted by Hurricane Harvey.
Economic Revitalization Program: Allows for interim assistance to small businesses (up to $250,000) impacted by Hurricane Harvey through deferred forgivable loans in exchange for job creation or retention for low-to-moderate income employees. Small business within Harris County and the city of Houston will be eligible to apply for this program.
For Those Inside City of Houston…
If you live inside the City of Houston, you may qualify under one of these programs.
Homeowner Assistance Program (HoAP)
HoAP is the primary program to help homeowners whose homes were damaged during Hurricane Harvey. There are five options within HoAP to assist homeowners at different stages of recovery and with specific recovery needs. The first step in getting help is to take the Harvey Recovery Survey to assess if there are programs you may qualify or and to help identify what documents you will need before you make a formal application.
The Harvey Homebuyer Assistance Program (HBAP) provides up to $30,000 through a forgivable, interest-free loan for down-payment and/or close-cost assistance to qualified homebuyers. The program serves Houstonians earning up to 120% of Area Median Income (AMI). The City places a sale-restricted lien on the home for five years to ensure that the program is meetings its affordability objectives.
The Harvey Single-Family Development (HSFD) Program builds new single-family homes for low- and moderate-income Houstonians. These homes typically sell for under $200,000 to eligible buyers. The City places a sale-restricted lien on properties for sale to income-qualified buyers to ensure that the home remains affordable for a specified period.
As a majority-renter city, Houston needs more quality, affordable rental housing after Hurricane Harvey. As demand for housing continues to rise, workers may not be able to afford homes in areas that are safe from flooding and close to jobs and transit. Ensuring Houston’s continued economic growth depends on having transit-connected, resilient, and affordable housing options for people at all income levels. The Multifamily Program provides funding to repair existing and develop new multifamily homes across Houston. Developers will be able to apply for funding through a subrecipient selection process.
Many Houstonians live in single-family rental properties, or rental properties with fewer than eight units. These small rental properties are important for affordable housing, and many were damaged during Hurricane Harvey. The Harvey Recovery Small Rental Program assists landlords to make repairs and improve the quality of these properties.
Service provider agencies help HCDD implement important programs, including support for people experiencing homelessness, those living with HIV/AIDS, and mental health services. Agencies can apply for funding through this program through a subrecipient selection process.
This program is intended to assist residents to move out of areas that have been impacted by multiple disasters or are at high risk of flooding from future disasters. The program is currently under development. City of Houston residents interested in a buyout option should visit the Harris County Control District’s Voluntary Home Buyout Program website.
City of Houston Contact Info
City of Houston Housing and Community Development Department
These represent starting points. If you were damaged during Harvey and need help recovering, explore these links. They may help. Each has a screening survey to make sure you qualify. Start there. Good luck.
Posted on January 20, 2019 by Bob Rehak
509 Days After Hurricane Harvey
https://i0.wp.com/reduceflooding.com/wp-content/uploads/2018/11/SJR_511_030.jpg?fit=1800%2C1200&ssl=112001800adminadmin2019-01-20 09:33:502019-01-20 09:47:59How and Where to Seek Disaster Recovery Help from Hurricane Harvey
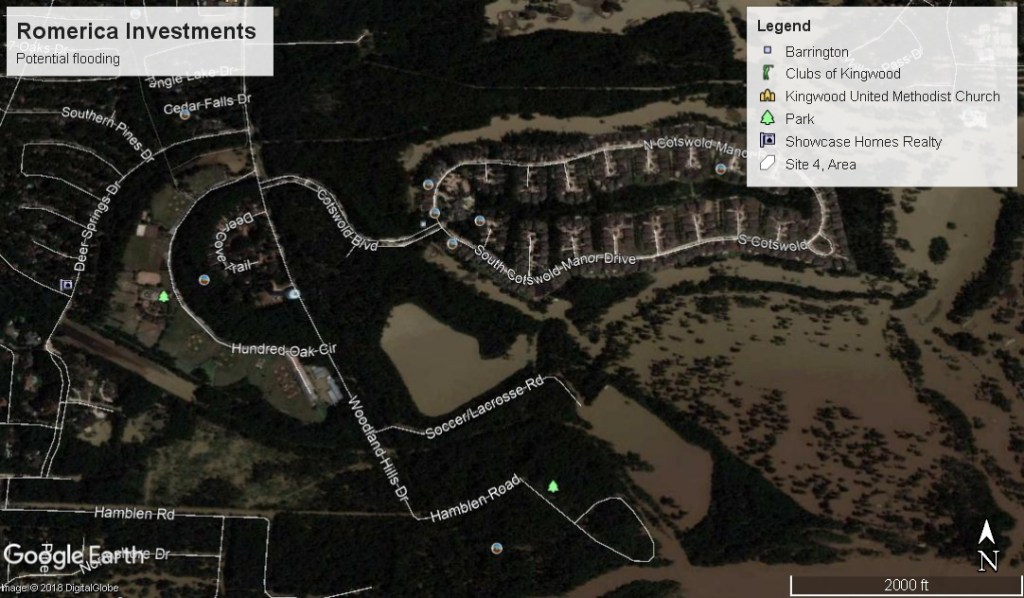
Thursday night, the Kingwood Service Association (KSA) added its voice to the growing chorus concerned about a proposed high-rise development in the floodplain near River Grove Park. KSA is the largest private group in the Kingwood area. It represents more than 30 community associations, which comprise more than 70,000 residents. It also manages the five private parks in the Kingwood area including two adjacent to the proposed development along Woodland Hills Drive.
The letter addresses concerns that BOTH the TCEQ and Army Corps will consider during the permit evaluation process. TCEQ rules on water quality issues (Clean Water Act Section 401) for the Corps. The Corps rules on Section 404 concerns.
The applicant, Romerica Investments, LLC must respond to every concern submitted by residents. So email them now or forever hold your peace.
Here is the text of KSA’s letter, which is also linked on the High Rise Page in the right hand column. I inserted the pictures and captions into KSA’s letter; they are not part of the original. I put them there to help illustrate the concerns for people who may not be familiar with all of the issues surrounding this controversial development.
Text of KSA Letter
Evaluation Branch, North Unit Regulatory Division, CESWG-RD-E Galveston District U.S. Army Corps of Engineers P.O. Box 1229 Galveston, Texas 77553-1229
Enclosed are the comments of the Kingwood Service Association, regarding the U.S.Army Corps of Engineers (Corps) Galveston District, Section 10/404 proposed Permit Application No. SWG-2016-00384, Romerica Investments, LLC, located in waters of the United States (U.S.) and wetlands adjacent to the West Fork of the San Jacinto River, Kingwood, Harris County, Texas.
The Kingwood Service Association (KSA) is a Kingwood-wide homeowners association representing thirty-two (32) residential and commercial associations in the Kingwood area. The following comments are being made on behalf of Kingwood residents concerned about the impact of the proposed development on the Kingwood community.
KSA owns and operates two parks adjacent to the proposed permit area, River Grove Park and Deer Ridge Park. During Hurricane Harvey, both of these parks flooded with 10 to 20 feet of water. River Grove Park is located on the West Fork of the San Jacinto River between the river and the proposed commercial and residential areas. This park was covered by 20 feet of water. As the flood waters receded, it left 6 feet of sand covering half of the park area. River Grove Park has flooded at least 6 times in the past 12 months. This experience raises serious concerns about the environmental impact of a development that calls for adding fill material to approximately 330 acres located north and east of River Grove Park, and which would raise the grade level of the area 12 feet from 45 feet to 57 feet.
We are very concerned about the overall impact of this development on the community because it would be built where Hurricane Harvey created some of the worst flooding in 100-year or greater floodplains/floodways; will fill and displace about 200 acres of 100-year floodplain/floodway, which will raise water levels and increase the possibility of flooding for others; will fill in wetlands that are crucial for soaking up water and reduced flows, velocities, and increased sedimentation of the West Fork of the San Jacinto River in its 100-year floodplain/floodway; is subject to further flooding in the future; and destroys more of the natural beauty, water quality, and wildlife habitat of the West Fork of the San Jacinto River.
In the review of this permit application, we ask the Corps to consider all relevant public interest review factors in 33 CFR 320-332 including conservation, economics, aesthetics, air quality, general environmental concerns, wetlands, historic properties, fish and wildlife values, flood hazards, floodplain values, land use, recreation, water supply and conservation, water quality, energy needs, safety, food and fiber production, and the needs and general welfare of the people.
We think that, at a minimum, the following areas should be addressed by USACE and TCEQ during the permitting process.
1. This proposal will fill 42.35 acres of wetlands with 68,323 cubic yards of fill material on 331.45 acres and fill 771 linear feet of streams with 285 cubic yards of fill material. There are significant concerns about the environmental impact of the elimination of 42.35 acres of wetlands. These concerns fall into the following areas:
a. Elimination of a natural area inhabited by eagles, deer, and other animals native to the area without sufficient mitigation in the same watershed.
Nesting bald eagles, a protected species, on West Fork of San Jacinto. Photo courtesy of Emily Murphy. The Houston Police Deportment Lake Patrol has reportedly sighted seven other eagle’s nests in the area, according to Murphy who frequently kayaks the river.
b. Decrease in the quality of the water supply for the City of Houston, which is downstream of the development, as a result of the increase in erosion and increase in deposition of sediment caused by the elimination of wetlands and the increase in infrastructure.
One of the drainage ditches that the proposed high-rise development would use is so over-burdened, that incision already is threatening existing development. Any addition to flow would destroy properties.
c. Decrease in the quality of the water supply for the City of Houston caused by the contamination of water run-off by the addition of parking spaces for 8,000 plus vehicles that could increase contaminants, such as motor oil, being washed into the San Jacinto River.
d. Increase of erosion and acceleration of deposition of sediment due to an increase in the speed of water run-off caused by the additional infrastructure, elimination of wetlands, and increase in grade level of the area.
High-rises for the proposed development would fill in wetlands where eagles fish and nest. The high-rises would also be built in an old meander of the San Jacinto West Fork, which contains unstable soil that is prone to flooding.
e. Determine the impact of filling in 42.35 acres of wetlands on eagles nesting in that area. Eagle nests have been spotted in the vicinity by Kingwood residents.
Eagles nest on the 16th hole of Kingwood Country Club’s Island Course, immediately adjacent to the proposed high-rise development.
2. Impact on the ability for residents to use the recreational facilities as a result of the increase in flooding caused by the increase of grade level from 45 feet to 57 feet that would inhibit the flow of water during significant rain events and cause the acceleration of water run-off potentially increasing erosion and accelerating the deposition of sediment in the San Jacinto River.
3. Economic impact on the villages immediately surrounding the development area as a result of the potential increase in flooding caused by the development. This could cause a significant decrease in the value of the homes located in these villages.
4. Economic impact on the community that would be caused by adding 8,000 plus vehicles to the traffic patterns of the community without a plan to mitigate this impact. The increase of this much traffic in a single area would have a negative impact on the attractiveness of purchasing a home in Kingwood, which has a reputation for being the “Liveable Forest”.
5. Completion of an environmental impact study before further consideration of this permit application. This study should include a full hydrological study of the project’s impact, an environmental impact to the large wetlands habitat without mitigation in the same watershed, and socioeconomic impact of such a huge development on an existing master planned community.
6. Impact on boat navigation on the West Fork of the San Jacinto River caused by the potential addition of 640 boats. Navigation on the West Fork has been impaired for decades and getting worse due to the acceleration of sediment deposition caused, in part, by sand mines upstream of the project area. This development has the potential to add to that sediment deposition.
This sand bar is currently not being addressed by the Emergency West Fork Dredging Project. It backs water up throughout the Humble/Kingwood area where thousands of homes and businesses flooded during Harvey. Erosion caused by the new development would add more sediment, make the marina useless, and destroy FEMA’s investment in dredging to date.
7. Require the applicant to provide documentation about how it will provide for operation and maintenance dredging of the site so that Section 10 navigation will continue over the lifetime of the development and after floods.
We are requesting that the Corps schedule a public hearing on this application to allow residents to gather additional information on the proposed development and provide further comments. In addition, considering the potential significant negative impact of this development on the community, we request that the Corps and TCEQ seriously consider denying this permit application.
We appreciate this opportunity to provide public comment on this proposed permit application.
Sincerely, Dee M. Price, President Kingwood Service Association
Feel free to echo these concerns or add to them in your letters to the Army Corps and TCEQ.
Posted by Bob Rehak on 1/19/19
509 Days since Hurricane Harvey
https://i0.wp.com/reduceflooding.com/wp-content/uploads/2019/01/2EaglesInNest.jpg?fit=1200%2C960&ssl=19601200adminadmin2019-01-18 22:53:212019-01-19 11:09:38KSA Adds to Growing Chorus of Concerns Over Proposed New High-Rise Development
After Harvey, it became clear that the simplest and most effective way to avoid sedimentation due to sand mining, was to prevent any new sand mining in the floodway. State Representative Dan Huberty introduced three new bills to toughen legislation on sand mines yesterday. But these bills never mention words like river, setback, buffer zone, erosion, sediment, or floodway.
What the Bills Do
HB 907 – Doubles the penalties for not registering a sand mining operation. New penalties can range from $10,000 to $20,000 per year with the total not to exceed $50,000.
HB 908 – Provides for penalties up to $50,000 for water code violations by sand miners and every-other-year inspections by the TCEQ.
HB909 – Calls for the TCEQ to adopt and publish best management practices for sand mines (aggregate production operations) that comply with applicable environmental laws and regulations.
Good…As Far as They Go
HB 907
…is actually an amendment to the portion of the water code that HB 571 established in 2011. HB 571 targeted unregistered and, therefore, unregulated sand mining operations. If you search back through historical satellite photos of the West Fork between I-45 and I-69 in Google Earth, you can see several such bandit mining operations. Miners would take a backhoe and a dump truck down to a point bar. Then they would start mining sand right out of the river banks. The scars can still be seen today in many places.
I haven’t seen many instances, though, of these kinds of operations in the satellite images since the passage of HB 571 in 2011. That’s good news. But it makes me wonder whether the emphasis on un-permitted operations is misplaced. Most problems come from permitted mines, not un-permitted. So this makes it appear as though we’re putting teeth into mining regulation without really solving the big problems, such as mining in the floodway, breached dikes that remain open for years, and abandoning mines without any reclamation.
HB 908
…specifies that all mines will be inspected at least once every two years to ensure that they comply with “all applicable environmental laws and regulations.” The problem: nowhere does the law (or the TCEQ) specify what those are. So a canoeist, for instance, who spots something suspicious, like a backhoe intentionally letting sediment-laden water out of a mine, has no way to tell if the activity is legal or illegal.
One can spend days searching the TCEQ website looking for the regulations they are supposed to enforce.
Sand mine dike just five weeks after a breach.
Also, every-other-year inspections give grass 730 days to grow and cover up the evidence of breaches in sand mine dikes.
Imagine telling your kid to clean up his or her room; you’ll be back to inspect it in two years.
HB-909
… is a good first step. It directs the TCEQ to establish a set of best practices for sand mining and to publish them. However, the bill does not stipulate the type of best practices to include. Nor does it stipulate any penalties for non-compliance.
It’s like the State telling Porsche owners that those 20 MPH speed limits in school zones are a “good idea.”
Bill McCabe, a member of the steering committee of the Lake Houston Area Grass Roots Flood Prevention Initiative, had this to say. “If they don’t list the BMP’s in the statute, nor authorize any penalties for violation of these BMP’s, what good does this do us? The TCEQ will merely adopt something similar to your BMP’s (the ones I proposed last year); TACA will agree; and everyone will go their merry way with no changes in sand-mining operations. If we later complain, TACA will assert that these are merely suggestions, and not intended to be law. And even if they are law, there are no penalties.
The Appearance of Meaningful
As these bills work their way through committees and the legislative process, residents will have opportunities to testify about their Harvey experiences, provide comments on the bills, and suggest amendments to strengthen them.
But at this point it looks like an uphill struggle. We’ll be lucky to see any truly meaningful legislation in 2019.
TACA Should Be Delighted
TACA, the Texas Aggregate and Concrete Association, will be delighted by these bills. If these become law in their present form, they will create the appearance of protecting people. That could undermine momentum toward regulation that reduces sedimentation.
As always, these are my opinions on matters of public policy protected by the first Amendment of the United States Constitution and the Anti-SLAPP statute of the great state of Texas.
Posted by Bob Rehak on 1/18/2019
508 Days since Hurricane Harvey
https://i0.wp.com/reduceflooding.com/wp-content/uploads/2019/01/SJR_434_025-e1547864315353.jpg?fit=1200%2C800&ssl=18001200adminadmin2019-01-18 20:45:092019-01-18 21:13:19Three Baby Steps on Sand Mining Legislation
A highly talented Kingwood photographer named Emily Murphy contacted me this week. The proposal to build high-rises near the river alarmed her. The impact on wildlife terrified her.
The Seldom-Seen World In Your Backyard
Emily often kayaks on the river with her camera. She has documented a world that few of us will ever see in person. But it’s there for everyone to see…with a little bit of effort. When she showed me her work, the beauty she revealed took my breath away.
It reminded me of a quote from Ansel Adams, America’s greatest landscape photographer. Adams, who died in 1984, was also one of the early leaders of the Sierra Club. He said…
“If you want to preserve something, inspire people with its beauty.”
– Ansel Adams
Below are some of the quiet, peaceful moments Emily Murphy experienced while paddling the San Jacinto River. All of these photos were taken within a few minutes of River Grove Park and the proposed site of the high-rise development.
Eagle photo Courtesy of Emily Murphy. Taken across the West Fork from where the proposed new high-rise development would go.
Taken from River Grove Park, looking east in morning mist toward the site of the proposed high-rise development. Photo Courtesy of Emily Murphy
American white pelicans and double-crested cormorants on the West Fork. Photo Courtesy of Emily Murphy
Quiet morning light in the backwaters of the West Fork. Photo Courtesy of Emily Murphy
Eagle flying near West Fork and Lake Houston, downstream from proposed high-rise development. Photo Courtesy of Emily Murphy.
Juvenile eagle easting fish east of River Grove Park. Photo Courtesy of Emily Murphy.
Roseate spoonbill on West Fork. Photo Courtesy of Emily Murphy
Feel Free to Use Images for Letters to Corps and TCEQ
Emily Murphy encourages people to submit her photos with their letters to the TCEQ and Army Corps of Engineers. They illustrate why these wetlands are unique and irreplaceable. (However, please do not use them for any other purposes; respect the photographer’s copyright.)
A mitigation-bank credit purchased by the developer in some far-off watershed cannot begin to compensate for the loss of a unique habitat like this…inside the limits of America’s fourth largest city.
A Community Living in Harmony with Nature
Murphy’s photography reminds me of two things. First, it reminds me of why I moved to Kingwood 35 years ago. The fact that Emily can still photograph moments like these is eloquent testimony to the founding vision for Kingwood – a community living in harmony with nature. The density of development was sufficiently low that wild animals such as these still live among us.
Second, it reminds me of a Navajo prayer that I first learned in Canyon De Chelley (pronounced ‘de SHAY’) in northeastern Arizona. The title of the prayer was inscribed on a plaque at Spider Rock, another of the world’s most beautiful places. The inscription simply said, “May you always walk in beauty.” No matter how beautiful architecture is, it can’t match the beauty of nature.
Posted by Bob Rehak on 1/18/2019
507 Days since Hurricane Harvey
https://i0.wp.com/reduceflooding.com/wp-content/uploads/2019/01/Image-1-7.jpg?fit=1829%2C1569&ssl=115691829adminadmin2019-01-17 06:37:312019-01-17 13:32:14May You Always Walk in Beauty