Jeff Lindner, the Harris County Flood Control District Meteorologist compiled this Decade in Review. After a very dry start, the decade ended incredibly wet. We started with five years of below normal rainfall (2010-2014). Then rains and floods returned in 2015 and continued through 2019. For the period from 2010-2014, the rainfall DEFICIT for BUSH IAH was -56.70 inches. For the period from 2015-2019, the rainfall SURPLUS was +69.78 inches.
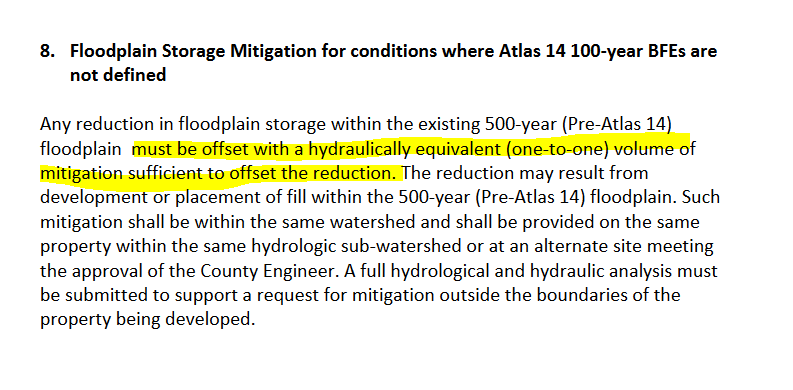
Five Deficit Years…
2011: 24.57 (-25.2)
2012: 43.32 (-7.45)
2013: 38.84 (-10.93)
2014: 43.72 (-6.05)
Followed by Five Surplus Years
2015: 70.03 (+20.26)
2016: 60.96 (+11.19)
2017: 79.69 (+29.92)
2018: 56.02 (+6.25)
2019: 51.93 (+2.16)
The decade featured one of the most significant droughts since the 1950’s across the state of Texas and a series of floods that rivals any period of flooding ever experienced in this state.
Jeff Lindner, Harris County Flood Control Meteorologist
1. Hurricane Harvey (2017)
Harvey made landfall at Port Aransas on August 27, 2017 at 10:00 pm as a category 4 hurricane with 130mph winds producing extensive wind damage across portions of the Texas coastal bend. A maximum wind gust of 132mph was recorded at Port Aransas and 118mph at Copano Bay. Harvey would then meander slowly east-northeast across portions of southeast Texas and the extreme northwest Gulf of Mexico producing record breaking rainfall and flooding.
A maximum total rainfall of 60.58 inches was recorded at Nederland, TX with over 10,000 square miles receiving over 35 inches of rainfall.
Across Harris County, on average 33.7 inches of rainfall occurred, resulting in record flooding along many of the bayous and creeks. In additional inflows into Addicks and Barker Reservoirs resulted in record pool elevations (exceeded Tax Day by 6.0 feet) in both reservoirs and significant flooding of structures located within the flood pools. Water flowed around the north end spillway of Addicks for the first time since the completion of the dams in the 1940’s. In Harris County alone over 154,000 homes were flooded and statewide over 250,000 homes were damaged from either flooding or wind. An estimated 500,000 vehicles were damaged or destroyed.
In the counties of Jefferson, Orange, Hardin, and Tyler upwards of 110,000 structures were flooded which is about 33% of the total number of structures in these four counties.
The highway 96 bridge over Village Creek near Silsbee, TX was completely washed away. In Fort Bend County over 200,000 residents were asked to evacuate due to flooding from Barker Reservoir, the Brazos River, and local drainage issues with some 8,700 homes being flooded. Over 9,000 homes were flooded in Brazoria County and over 7,000 in Galveston County. Many of the creeks, bayous, and rivers in southeast Texas surpassed previously held flood records by several feet.
More than 100,000 residents were rescued across southeast Texas by both government and civilian resources with more than 40,000 sheltered in over 150 shelters.
Over 336,000 customers lost power during the hurricane mainly across the coastal bend from wind related damages, but also in the Houston and Beaumont areas from flooding.
Harvey resulted in 125 billion dollars in damage making the hurricane the second costliest hurricane in American history (behind Katrina 2005). Harvey is the worst flooding event to ever impact the United States and resulted in the highest death toll from a landfalling tropical system in the state of Texas since 1919 with over 68 direct fatalities (36 in Harris County alone).
2. Drought/Wildfires (2011)
One of the worst droughts to impact the state of Texas and southeast Texas occurred in 2011 resulting in widespread mandatory water restrictions, the loss of millions of trees, and significant wildfires. High temperatures during the drought were some of the warmest on record and exceeded the extreme heat of the summer of 1980.
For the period from February 1 to August 18, Hobby Airport only recorded 6.36 inches of rainfall breaking the previous driest record from those dates by 6.25 inches. On August 27, 2011, Houston IAH reached a high temperature of 109 at 2:44pm which tied the hottest all-time temperature from September 4, 2000 for the city of Houston.
Over the Labor Day weekend of 2011, primed vegetation from the drought combined with strong winds of 30-40mph on the western side of Tropical Storm Lee over Louisiana produced one of the most devastating wildfire events in Texas history. The Bastrop fire burned over 35,000 acres and some 1600 homes and is the single most devastating wildfire in Texas history.
The tri-county fire (Waller, Grimes, Montgomery Counties) burned over 19,000 acres and some 100 homes. In September 2011, the statewide PDSI index fell to -7.97 or its lowest values ever, indicating the 2011 drought was nearly as equal in severity as the drought of record in the 1950’s.
For 2011, Tomball averaged a rainfall deficit of over 40 inches. Overall statewide water storage fell to 58.78% at the end of October 2011 and Lake Conroe fell to -8.0 feet below its conservation pool. Lake Travis fell to -54.61 feet below its conservation pool or (34% capacity). 644 jurisdictions across the state were under mandatory water restrictions.
The City of Houston also recorded 47 days above 100 degrees (previous record was 32 in 1980). Huntsville recorded 72 days above 100 (previous record was 43 in 1980). The incredible heat of August 2011 was estimated to be a 10,000 year return event for the City of Houston.
3. Tropical Storm Imelda (2019)
Tropical Storm Imelda formed 15 miles off the coast of Brazoria County and made landfall near Freeport on September 17, 2019. Imelda would slowly drift north-northeast across SE TX during the 18th and into the 19th.
Early on the morning of the 19th an extensive band of heavy thunderstorms producing extreme amounts of rainfall developed from Jefferson County to east-central Montgomery County.
Rainfall rates under this band frequently exceeded 4.0-5.0 inches per hours with a few locations receiving over 6.0 inches per hour.
This band of excessive rainfall drifted south-southwest in Harris County by mid morning. 31.0 inches of rainfall was recorded in just 12 hours at Fannett, TX near the Chambers/Jefferson County line with a storm total of 44.29 inches of rainfall at that site.
The 44.29 inches recorded at Fannett, TX makes TS Imelda the 4th wettest tropical cyclone in Texas history and the 5th wettest in US history dating back to 1851.
A 48-hour rainfall total of 29.1 inches was recorded in northeast Harris County near Huffman with 30.4 inches recorded in southeast Montgomery County near Plum Grove. 6.5 inches of rain fell in just 1 hour over the Aldine area of Harris County.
The resultant flooding in Jefferson, Liberty, Chambers, and portions of northeast and north central Harris County equaled and in some cases exceeded that of Harvey.
While overall storm total rainfall amounts were less than Harvey, the duration (intensity) at which some of the rainfall occurred in certain areas was much greater for Imelda than for Harvey yielding in certain instances areas that would flood in Imelda and not Harvey. 3,990 homes flooded in Harris County alone. Several thousand flooded in Montgomery, Liberty, Chambers, and Jefferson Counties.
4. Tax Day Flood (2016)
On April 17-18, 2016 a slow moving to at times stationary cluster of thunderstorms producing excessive rainfall rates developed over portions of Waller, Austin, northern Fort Bend and western Harris County. Over the next 12 hours rainfall amounts of 12-24 inches would occur from southern Waller County into portions of western Harris County resulting in extensive and severe flooding.
The flooding resulted in 9 fatalities in Harris, Waller, and Austin Counties (7 in Harris County) with an estimated 40,000 vehicles flooded and 9,840 homes flooded in Harris County alone.
A maximum 14.5 hour rainfall rate of 23.50 inches was recorded in Pattison in southern Waller County with 19.30 inches occurring at Monaville in 10 hours.
Modern day record flooding occurred along Cypress Creek and in portions of Addicks Reservoir (only to be exceeded a year later by Harvey).
Significant flooding occurred along the lower Brazos River, only to be exceeded a month later when 20 inches of rainfall fell near Brenham, TX. Addicks Reservoir peaked at its highest level ever recorded at 102.65 feet (only to be exceed by Harvey the following year).
5. Memorial Weekend (2015)
Devastating flooding impacted the state of Texas over the Memorial Day weekend in 2015. The initial onslaught began with excessive rainfall and resulting catastrophic flooding along the Blanco River at Wimberley where the river rose over 30 ft in less than 3 hours. It reached a peak elevation of around 40.2 ft (flood stage 13ft) and exceeded the previous record of 33.3 ft (an 86 year old record).
The Blanco River at San Marcos rose 17 ft in 30 minutes and over 29 ft in 2.5 hours.
Over 1000 residents were displaced and over 350 homes in Wimberley destroyed and washed away. The storm killed 13 persons including 8 from a single river house that washed away. The Ranch Road 165 and Fischer Store Rd bridges across the river were completely destroyed and the Ranch Road 12 bridge sustained significant damage.
The following day, a line of intense thunderstorms would originate in central Texas and move into southeast Texas and slow over southwest Harris County. A total of 8.0 inches of rainfall would fall in a 3 hour period.
11.0 inches fell in 12 hours north of US 59 and Beltway 8 resulting in extensive flash flooding. The first ever Flash Flood Emergency was issued for Harris County at 10:52pm. There were 7 fatalities in Harris County (4 from submerged vehicles at underpasses).
Statewide a total of 27 people died in flash flooding. Flooding along Brays and Keegans Bayous was the most extensive since September 1983 and along Buffalo Bayou since March 1992 and TS Allison (2001).
A total of 6,335 homes flooded in Harris County and an additional 3,540 multi-family units flooded. Some of the same homes would be flooded a year later with the “Tax Day Flood” and all would flood again during Harvey 2 years later.
That’s the decade in review! If you weren’t browning, you were drowning. Any time your friends and family in other states start complaining about the weather there, send a link to this page to them.
Posted by Bob Rehak on 12/31/2019
854 Days since Hurricane Harvey and 103 since Imelda