“For a couple of weeks, I wasn’t able to work due to Hurricane Harvey,” said Kingwood resident Mike Combat Willcox. “So I documented the storm the best I could. I was thinking years into the future that we would need to remember how it happened and have something to show to our kids.”
He was right. We need this NOW as Lake Conroe residents fight to keep their lake full to the brim during rainy seasons.
A former TV producer-editor-photographer at ConocoPhillips, Willcox now runs his own real-estate photography business. Mike is also a world champion aeromodelling pilot, a skill he puts to good use in this video of Harvey.
8-Minute YouTube video courtesy of Mike Combat Willcox
I wish the SJRA would play THIS before its next board meeting so that Lake Conroe residents could see why Kingwood residents are so eager to continue the temporary, seasonal lowering of Lake Conroe. Then maybe we could see a video from the Lake Conroe Association about all the damage caused by the lake lowering. That might help the two sides understand each other better.
Just sayin’.
Posted by Bob Rehak with thanks to Mike Combat Willcox for sharing his video
The roughly 80,000 cubic feet per second (CFS) Lake Conroe discharged at the peak of Harvey would have created the ninth largest flood in West Fork History – all by itself. Only eight floods ever had higher “discharge” rates AND those all included floodwaters from other tributaries, such as Lake Creek, Spring Creek, Cypress Creek and numerous drainage ditches.
Discharge is the volume of water flowing past a point on a stream. Discharge from a dam would be the volume flowing past the gates.
The discharge during Harvey is important because residents fighting the seasonal lowering of Lake Conroe claim the impact of the release on Humble and Kingwood was insignificant.
Question I Asked Flood Control
So I asked Jeff Lindner, Harris County Flood Control meteorologist, this simple question. “Assuming not a drop of rain fell in any other of the West Fork tributaries, where would that 80,000 CFS have ranked among the history of West Fork floods?” I then asked him to base his analysis on the West Fork gage at US59. It combines water from ALL upstream West Fork tributaries. It’s also the closest gage in continuous operation to the highly populated Humble/Kingwood corridor. That’s where the vast majority of Lake Houston Area damage occurred during Harvey.
Only eight floods have ever exceeded 80,000 CFS at US59.
They occurred on:
8/28/17 (Harvey)
10/18/94 (Previous Record Flood)
11/26/40
5/31/29
5/29/16 (Memorial Day)
11/15/98
5/7/35
4/21/16 (Tax Day)
Note: three of these events happened before the construction of Lake Conroe in 1973. All since the advent of Lake Conroe flooded West Fork structures.
One Statistic Addresses Host of Issues
This observation (ninth largest flood by itself) addresses a host of issues raised by Lake Conroe people about lowering the lake seasonally to create a buffer against downstream flooding. They contend that:
In the grand scheme of things, the Lake Conroe release during Harvey had an insignificant impact on flooding in the Humble/Kingwood area.
Kingwood always floods.
Imelda proves that Kingwood will flood even when Conroe is not releasing water.
There’s no need to create extra storage capacity to offset future floods.
Since Lake Conroe was built, West Fork flooding has exceeded the release rate during Harvey only five times – and one of those was Harvey itself. So Kingwood does NOT always flood.
During Imelda, the discharge of the West Fork, Spring Creek and Cypress Creek put together was about 35,000 CFS at US59. That’s far less than half of the Harvey release from Lake Conroe alone. All of the headline-grabbing rains during Imelda happened on the East Fork. Claiming Imelda proves Kingwood will flood regardless of what Lake Conroe does is a “red herring” – a logical fallacy intended to deceive.
Lowering Lake Conroe two feet in advance of another Harvey will probably not make much of a difference. Likewise, lowering it two feet in advance of 1-inch rain would be unnecessary. The real value happens somewhere between those extremes in a 10-, 25-, 50- or perhaps even a 100-year storm. Somewhere along that spectrum, we will get enough rain to perhaps flood homes, but we’ll also have enough extra lake capacity to avoid actually flooding them.
We just don’t know where that point is right now. Jing Chen, the engineer with Harris County Flood Control managing the San Jacinto River Basin Study says that project will not be far enough along to model those scenarios until August of this year.
Increasing Upstream Detention Capacity: A Proven Flood Mitigation Strategy
According to Matt Zeve, Deputy Executive Director of Harris County Flood Control, holding water upstream is a proven flood mitigation strategy. Engineers in the Houston area created upstream detention more than 80 years ago with the Barker and Addicks reservoirs. Braes Bayou now has five different detention areas; White Oak Bayou has five with another under construction.
Such detention areas collect water during a storm and then release it slowly after a flood passes.
The extra storage capacity created by lowering Lake Conroe 1-2 feet works the same way. The idea: to reduce the amount and/or rate of water released during a flood to help avoid downstream property damage.
SJRA Mission and Lake Conroe History Includes Flood Prevention
It shows the SJRA considered building 20 dams that year.
So far it has built only one: Lake Conroe.
Therefore, Lake Conroe is currently the only way we have to mitigate flooding until we put other mitigation measures in place.
Posted by Bob Rehak on 1/23/2020
877 Days since Hurricane Harvey
Note: A reader’s question on Facebook prompted this post. But I can’t find his name now. My apologies. No offense intended.
https://i0.wp.com/reduceflooding.com/wp-content/uploads/2018/07/Peak-Inflows-During-Harvey.jpg?fit=1500%2C1157&ssl=111571500adminadmin2020-01-23 18:51:562020-01-23 19:49:21By Itself, Lake Conroe Discharge During Harvey Among Top Ten West Fork Floods of All Time
Tuesday, the SJRA Board met to reconsider lowering Lake Conroe seasonally. Many Lake Houston Area residents there to testify felt bullied by the large and boisterous crowd of Lake Conroe residents. This is another story of bullying. It’s about how a young man with autism who was traumatized by flooding during Hurricane Harvey fought his way back. He’s now taking up the fight to continue lowering Lake Conroe seasonally. Below: the text of a letter he wrote to the SJRA Board. It took courage for Ryan to share this letter with the world. Spoiler alert: Keep a Kleenex handy as you read this. It’s inspirational.
My name is Ryan Long and I am a 15-year-old from Kingwood. In August of 2017, when I was 12, my home flooded after the release of water from Lake Conroe. We do NOT live on a flood plain, and we NEVER had flooding in our neighborhood until the middle of the night of August 27th during Harvey.
Foster’s Mill, where I live, had no warning to evacuate. When flood water came, the current was so great that regular boats could not get down my street to rescue people. Helicopters flew in all day and rescued people from roofs.
Rescued by USAF Special Forces
We were finally rescued in the evening on a boat by a Special Forces team from the U.S. Air Force, hours after flood waters came into our home. I, my family, and my community will feel the impact for years to come.
Harvey photo courtesy of Ryan Long
I have autism and am classified as “high-functioning.” Before Harvey, I loved school. But due to the Lake Conroe release during Harvey, I lost years of therapy and a year of schooling.
As I woke up on the third day of the storm, power had gone out. When I opened my curtain, I saw a river rushing right outside my home; the water so deep it was about to seep into my downstairs. I panicked and ran to my parents! As the day wore on, I watched as water crept in our home like a slowly rising tide until the Special Forces evacuated us.
Harvey photo courtesy of Ryan Long
Descent into Darkness
Our journey out was rough. The destruction I saw traumatized me. I felt broken. Every day, I felt anxious. The first time it rained, I hid under a desk, certain it would happen all over again. I slept with the lights on at night. Darkness felt like a Halloween horror movie. School became traumatic. Walking down a crowded hall felt as if I were caught in a cage. Kids began to pick on me about my panic attacks. I isolated myself, even from friends.
I could not figure out how to ask for help. I felt frantic when taking tests. I could not concentrate. My grades, a source of pride, began to suffer. Even with the help of teachers who recognized the problem, I still failed.
The Long Road Back
My parents found a counselor who helped me find a way back. She talked to me about things I loved. Eventually, I started listening to her. Slowly, she taught me strategies to cope. She helped me overcome fears and taught me how not to feel so lost. My grades improved, and I learned to sleep in the dark again.
Harvey photo courtesy of Ryan Long
However, I was still struggling with kids who frequently bullied me. After a particularly brutal, physical incident, I found the courage to stand up for myself and reported the incident – despite fear of retribution.
At first, I wondered what changed that day. I finally found the courage to believe in myself. I started doing things with my friends again. And I finished the year with straight A’s.
It took more than a year before I learned to believe in myself again. Today, I am still anxious at times. I still do not like thunderstorms. And I still struggle occasionally on tests. But I no longer think I am too stupid to do the work. But I believe in myself. Harvey did not break me. I came out better in the end. But that doesn’t mean I want to go through it again.
Still Dealing with Anxiety
People not living with the repercussions of Harvey tend to forget what happened. They expect the trauma and damage to go away as soon as homes are repaired. However, two and a half years later I still have anxiety.
My home is fixed but others on my street and many in my community are not. People still live on second floors with their downstairs in disarray. Other homes are abandoned. Many people are frightened when it rains. My mom has panic attacks when she hears helicopters. Damage – both physical and emotional – lingers on.
Harvey photo courtesy of Ryan Long
So, what does this have to do with the SJRA and the people of Lake Conroe? I beg you to remember that there are people and lives that have been devastated by flooding downstream. We ask that you continue the seasonal lowering of Lake Conroe until the flood mitigation can be completed on Lake Houston.
Thank you for listening.
Sincerely,
Ryan Long
Posted by Bob Rehak on 1/23/2020with grateful thanks and best wishes to Ryan Long
877 Days after Hurricane Harvey
https://i0.wp.com/reduceflooding.com/wp-content/uploads/2020/01/RyanLong3.jpg?fit=1200%2C900&ssl=19001200adminadmin2020-01-22 21:03:352020-01-22 21:06:58Flooded 15-Year-Old With Autism Fights for Lowering Lake Conroe
The SJRA held its second of three board meetings last night to consider public input on its temporary policy of lowering Lake Conroe seasonally. Once again, red-shirted protesters from Lake Conroe showed up in busloads. About 50 people from the Lake Houston Area made it to the meeting. Lake Conroe people outnumbered them by an estimated 25:1. See below.
Lake Conroe people in red shirts vastly outnumbered Lake Houston people in the white, clustered in a corner.
Lake Houston People Forced to Wait up to Four Hours to Speak
With the exception of several Lake Houston Area officials who spoke early, the vast majority of Lake Houston Area residents had to wait three to four hours for their 3 minutes at the microphone. Many had to leave before they got their chance to speak. Sadly, I knew what they planned to talk about. The SJRA needed to hear it; Lake Conroe residents needed to hear it, too. But neither group did.
Lake Conroe Residents Still Laboring Under Misinformation
But virtually all of the rest seemed unrestrained by facts or issues.
For instance, SJRA staff told the crowd upfront that one third of the water coming down the West Fork came from the Lake Conroe release. At least twenty Lake Conroe residents then got up and claimed that 14% of the water coming into Lake Houston was from the release. Statistical subterfuge!
While technically true, that distorts the picture. The SJRA has no control over East Fork water. The lake-lowering policy is designed to reduce West Fork damage.
Ripley’s Believe It or Not
Here are some more:
“Lake Conroe had nothing to do with flooding Kingwood.” (Why were most areas dry then until Lake Conroe water hit town?)
“If Kingwood people don’t want to flood, they shouldn’t buy homes in a flood plain.” (As if everyone who flooded was in a flood plain.)
“There’s no proof that lowering Lake Conroe will help prevent flooding in Kingwood.” (The SJRA’s flood mitigation manager had just given a presentation explaining when it did.)
Six Inches Killing A 79′ Deep Lake
And then there were outright exaggerations. Staff explained that evaporation normally lowered Lake Conroe to within six inches of target levels in spring and hurricane season. That means, they’re really only lowering the lake intentionally another six inches! That’s as deep as a glass of ice tea. But still, scores of Lake Conroe residents steadfastly claimed that intentionally lowering the lake another six inches was “destroying”:
The environment
Montgomery County’s tax base
Recreation
The lake
The county’s school system
Home values
Safety on the lake
Bass fishing
Lake Conroe is normally 79 feet deep at its deepest point.
Adding Insult to Injury
Lake Conroe residents repeatedly blamed Kingwood residents for not whipping the City of Houston into shape and getting it to act faster. They blamed Harris County Flood Control for dragging its feet and not spending its flood bond money fast enough. Incredibly, they denied that people died after the Lake Conroe release hit Kingwood. They even heckled State Rep. Dan Huberty and interrupted other Kingwood speakers.
All in all, it was more fun than a firing squad.
Sadly, I don’t think many, or even any, of those who talked had any idea of the real devastation that happened in Kingwood.
There has to be a better way to discuss these issues.
Posted by Bob Rehak on 1/22/2020
876 Days after Hurricane Harvey
https://i0.wp.com/reduceflooding.com/wp-content/uploads/2020/01/SJRA-Board-Mtg-1.21.2020.jpg?fit=1200%2C800&ssl=18001200adminadmin2020-01-22 00:52:072020-01-22 01:13:06Lake Conroe Swamps Lake Houston Again
.28 inches of rain in the last week swamped Woodridge Village. Woodridge contributed to the flooding of Elm Grove and North Kingwood Forest twice last year after contractors clearcut 268 acres.
Gage at West Lake Houston Parkway
Standing Water Over Half of Development
Looking southwest across Woodridge Village. Virtually half of subdivision is holding ponding water.This and all photos below taken on 1/20/2020.A closer shot.Looking southwest across Woodridge Village at land once classified as wetlands by USGS
Extremely Low Infiltration Rate
Now we know why the runoff rate was so high after Perry Homes clearcut the land. The soils may be sandy clays with very low infiltration rates. Alternatively, there may be clay close to the surface that prevents water from infiltrating.
If approximately 1/4 inch of rain in seven days does this, you can imagine how much would run off when you get 6 to 12 inches in a day.
Those wetland areas largely coincided with the areas now holding the ponding water.
USGS Wetlands Map. Background shows Woodridge Village BEFORE clearcutting.
So many questions and so little time.
Movement in Court Case and on Ground
The Harris County District Clerk’s office shows absolutely no movement in the court case between Perry subsidiaries, their contractors and flood victims. The last motion on file: December 27.
January 20, 2020. Contractors continue to elevate the southern and eastern edges of Woodridge Village’s S2 detention pond. The same berm from ground level. Elevated several feet above Elm Grove. Backslope interceptor swale mysteriously eliminated.Ground now sloped to funnel runoff from slope directly into Elm Grove (left). Photo courtesy of Jeff Miller.Where this pipe sticks up, there used to be a swale designed to keep water from flowing into Elm Grove and funnel it into the pond. See swale in background next to fence that contractors have not yet filled in. Photo courtesy of Jeff Miller.
This whole sad, sorry development reminds me of one of those Hollywood horror flicks in which the teenagers do everything wrong, oblivious to the danger that lurks beneath them. I expect to see Dracula’s hand poking up out of the clay any second.
Posted by Bob Rehak on 1/20/2020 with photos from Jeff Miller
874 Days since Hurricane Harvey and 123 since Imelda
The thoughts expressed in this post represent opinions on matters of public concern and safety. They are protected by the First Amendment of the US Constitution and the Anti-SLAPP Statute of the Great State of Texas.
https://i0.wp.com/reduceflooding.com/wp-content/uploads/2020/01/20200120-RJR_7194.jpg?fit=1200%2C800&ssl=18001200adminadmin2020-01-20 22:25:422020-01-21 09:09:23Woodridge Village Swamped by 1/4 Inch of Rain in 7 Days
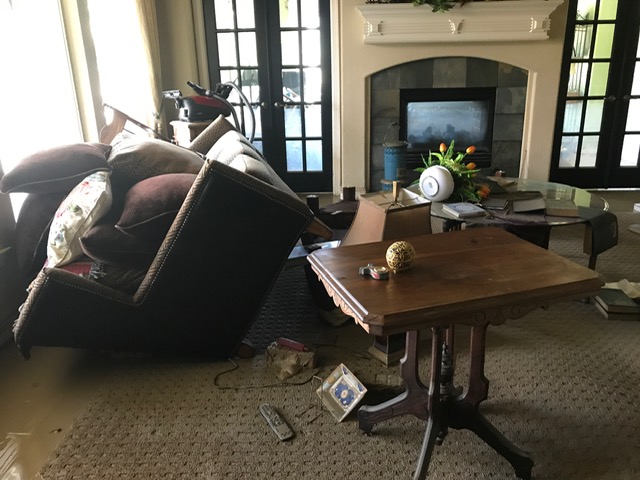
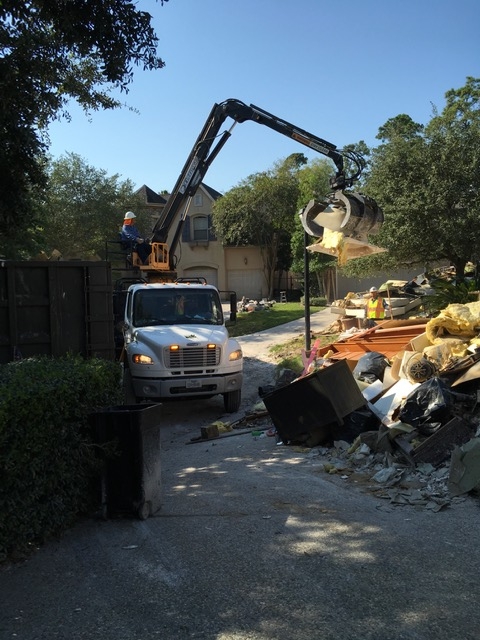
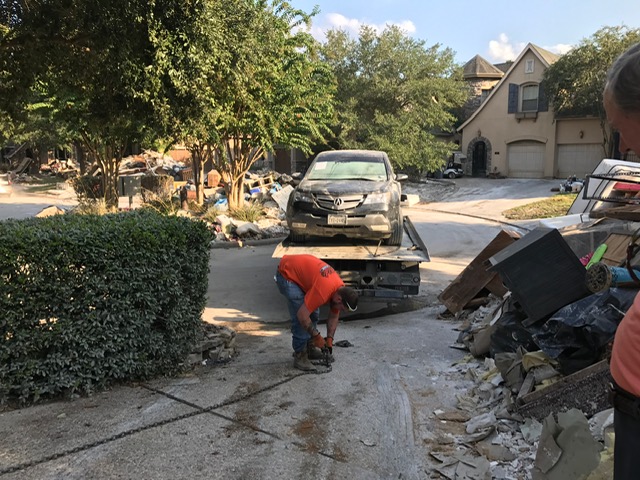
Janet Wilson lives in Kingwood Greens. Her home, like those of all 225 in the subdivision, flooded during Harvey AFTER Lake Conroe opened its gates and started releasing almost 80,000 cubic feet per second. That amounted to ONE THIRD of all the water coming down the highly populated Humble/Kingwood corridor on the West Fork where most flood damage occurred. Her photos tell a tragic story about the toll that flooding places on a family. But her words told an even more tragic story.
Below are photos of our home in Kingwood Greens. They show just a fraction of the overnight loss of 48 years’ accumulation of household effects, family heirlooms, clothing, medicines, pictures, letters, books, keepsakes, both our cars, including a vintage Porsche, and more.
Kingwood Greens after the Lake Conroe release
Beyond the Tangible Items
But, these are just the tangible items. Some of our greatest losses could not be photographed.
It has taken us more than two years to try to restore our life.
That’s time we could have spent with aging and now deceased parents plus our children, grandchildren and friends.
Then consider the loss of wages; my husband is a consultant. Also consider the physical and continuing mental toll that stress from this has put on us.
AND finally, consider the permanent loss of friends and neighbors. Seven out of 21 families on our street alone were so traumatized, they have sold their homes and left our neighborhood forever.
Those “Stop the Drop” homeowners on Lake Conroe have no idea of what “loss of recreation” is, and their insensitive selfishness is incomprehensible.
Tell YOUR Story In Person to the SJRA Board
If you feel like Janet, make sure you email the SJRA board and urge members to continue the policy of lowering Lake Conroe seasonally until other flood mitigation measures can be put in place. Until more gates can be added to Lake Houston and dredging is completed, it’s the only buffer against flooding that the Lake Houston Area has. You can email them or deliver your message in person at the next SJRA Board meeting.
Tuesday, January 21, 2020
6pm at Lone Star Convention and Expo Center
9055 Airport Road, Conroe, Texas 77303.
Doors open at 5pm.
Those wishing to address the board or register a comment at a special meeting must fill out a Comment Registration Form https://www.sjra.net/wp-content/uploads/2020/01/Comment-Registration-Form_01062020.pdf. Comment Registration Forms may be submitted at the special meeting. The form may not be mailed, emailed, or dropped off prior to the meeting date.
If You Can’t Attend, Email Your Comments
Please write an email showing your support for continuing the temporary seasonal lowering of Lake Conroe. The SJRA Board of Directors also welcomes input via mail or email. To contact the Board please visit: https://www.sjra.net/about/board/. Scroll down to the bottom of the page to see the email form. Or email floodmanagementdivision@sjra.net.
Generally, original letters carry more weight than form letters. However, many people do not feel comfortable writing or speaking. So…
For More Information About the Lake Lowering Strategy
A new page on this web site called Lake Lowering contains background information, sample letters, and previous posts. Please write or testify.
Posted by Bob Rehak on 1/19/2020
873 Days after Hurricane Harvey
https://i0.wp.com/reduceflooding.com/wp-content/uploads/2020/01/image2-1.jpeg?fit=640%2C480&ssl=1480640adminadmin2020-01-19 21:55:332020-01-19 22:06:24Janet Wilson’s Losses and Long Road Back from Hurricane Harvey Make Case for Lowering Lake Conroe
Colleen Ulrich gave me permission to share her family’s Hurricane Harvey experience. She captured the terror in this letter to the San Jacinto River Authority Board. It supports the continued seasonal lowering of Lake Conroe to provide a buffer against flooding until other mitigation measures can be put in place.Her home did not flood UNTIL AFTER the Lake Conroe release.
Full Text of Ulrich Letter
Dear SJRA Board Members,
The purpose of my email is to petition all SRJA Board Members to approve the temporary, seasonal lowering of Lake Conroe for 2020. As an introduction, I have been a resident of Kingwood since August 2005 when I evacuated from New Orleans due to Hurricane Katrina. We never moved back because our family fell in love with our adopted state of Texas and our adopted home town of Kingwood. I live in the Barrington neighborhood with my husband and 10-year-old daughter. Our home was flooded with 2 feet 2 inches of water in August 2017.
Colleen Ulrich’s vehicle during Hurricane Harvey after Lake Conroe release. This photo and those below courtesy of Colleen Ulrich. All used with permission.
Childhood Memories
One of the issues that those opposed to the temporary, seasonal lowering of Lake Conroe is that they feel deprived of their ability to enjoy the lake and to create fun summer time boating memories for their families and children. As a mother and Kingwood resident, I am petitioning you to vote in favor of the temporary, seasonal lowering of Lake Conroe to ensure the safety of my child and all of the children of Kingwood and to ensure none of the Kingwood area children have any memories similar to the ones that were created from the flood in August 2017.
Colleen Ulrich’s dining room during Hurricane Harvey after the SJRA opened the flood gates on Lake Conroe.
Our daughter, Alexandra, was 7 1/2 at the time and her memories include sitting on our stairwell alone in our home while my husband carried me on his back to be evacuated by boat because the quickly rising water was too high and the current too strong for me to walk by myself. Alexandra’s memories include riding in that same boat out of our neighborhood and seeing the houses with up to 4 feet of water in them. Alexandra’s memories include having her childhood bedroom destroyed by floodwaters.
I promise you that these memories will never fade for her.
The Ulrich living room after the Lake Conroe release during Harvey.
Fun Vs. Safety
So I petition to the Board, what is more important – creating fleeting childhood memories of a boat ride in the summer on Lake Conroe or averting traumatic childhood memories of a flood?
What is more important – the perceived Lake Conroe falling property values or the safety of our children and residents?
Heirlooms underwater.
I am in agreement that the lowering of Lake Conroe and Lake Houston are both temporary solutions. And of course these temporary solutions should be revisited once all of the other permanent measures including the installation of additional gates in Lake Houston are put in place. But until that time, I pray that you will make the right decision and keep the temporary, seasonal lowering in place until permanent measures can ensure the safety of all the children and of all the residents of Kingwood and the surrounding areas.
Ulrich kitchen, cabinets and appliances destroyed.
The piano that’s not so grand since Harvey.
Video of Evac
For your consideration, my husband recorded this video and posted it on YouTube so we can remind others of the trauma of that day. This was his boat ride out of Barrington.
I appreciate your service to our community and your consideration of my appeal to approve the lowering of Lake Conroe.
Regards,
Colleen Ulrich
Address and Phone Number Withheld for Purposes of This Post
Tell the SJRA Board about your Harvey experience and why you would like to see them continue lowering Lake Conroe seasonally until other flood mitigation measures can be put in place. Come to the next board meeting and tell them in person or write them by visiting https://www.sjra.net/about/board/. Scroll down to the bottom of the page to see the email form.
Posted by Bob Rehak on 1/18/2020
872 Days after Hurricane Harvey
https://i0.wp.com/reduceflooding.com/wp-content/uploads/2020/01/Ulrich-Evac.jpg?fit=1182%2C662&ssl=16621182adminadmin2020-01-18 17:11:252020-01-19 07:50:57Childhood Terror From Harvey: Ulrich Family’s Experience and Letter to SJRA Board
During Hurricane Harvey, the San Jacinto River Authority (SJRA) released almost 80,000 cubic feet per second from the Lake Conroe Dam. This amounted to ONE-THIRD of all the water coming down the highly populated corridor between Humble and Kingwood. Massive damage resulted.
How Lake Lowering Policy Started
Almost 6,000 structures along the West Fork flooded. That number includes more than 1,100 between Lake Conroe and Porter. Forty-four percent of all the businesses in the Lake Houston Area Chamber experienced damage. The release inundated entire subdivisions. They included Forest Cove townhomes, Barrington, Kingwood Cove, Kingwood Greens, Kings Harbor, and Town Center. Large parts of other subdivisions flooded, too. Some more than two miles from the West Fork.
After touring the damage, Governor Gregg Abbott directed the SJRA to reduce flooding. The SJRA established a Flood Management Division. It also adopted a temporary policy of lowering Lake Conroe from 201 feet to 200 feet in the rainiest months of Spring and 199 feet during the peak of hurricane season.
The extra capacity in Lake Conroe provides a buffer against flooding downstream. It reduces both the volume and rate of water that SJRA must release in a flood.
How Long Policy Will Last
The policy is temporary until other flood mitigation measures can be completed. Those include:
Dredging the West Fork. According to the Army Corps, it had become 90% occluded in places from all the sediment washed downstream by Harvey.
Adding ten additional floodgates to Lake Houston to it can keep up with the volume released by Lake Conroe. Currently, the gates on Lake Houston can release 10,000 cubic feet per second while the gates on Lake Conroe can release 150,000, 15X more.
Pushback by Lake Conroe Residents
After 1.5 years, Lake Conroe residents rebelled against the policy based on misinformation provided by the Lake Conroe Association (LCA). LCA argues that lowering the lake:
Is permanent.
Is needless, because dredging is done.
Has no scientific basis.
Has not worked.
Damaged home values and bulkheading around Lake Conroe.
Makes boating difficult, especially for people far north on the lake.
Reduces the recreational potential of Lake Conroe.
Damages the lake-bottom environment
Will damage Montgomery County’s tax base.
Some of these claims are just outright false. Most are exaggerated. And virtually all stem from false premises; the policy is not permanent and dredging is not done. Regardless, the LCA has whipped people into a hysterical frenzy. Billboards around the lake ask them to SAVE OUR LAKE.
In contrast, the Lake Houston Area Chamber has launched a fact-based campaign called Lives Over Levels.
Please support the the Lake Houston Chamber’s Lives over Levels Campaign by emailing the SJRA Board or coming to one of their meetings. See below.
Background Information to Help You Write a Letter of Support
The links below provide information that you can use to write letters/emails supporting the lowering of Lake Conroe until dredging is complete and additional floodgates have been added to Lake Houston.
Please write an email showing your support for continuing the temporary seasonal lowering of Lake Conroe. The SJRA Board of Directors also welcomes input via mail or email. To contact the Board please visit: https://www.sjra.net/about/board/. Scroll down to the bottom of the page to see the email form. Or email floodmanagementdivision@sjra.net.
Generally, original letters carry more weight than form letters. However, many people do not feel comfortable writing or speaking. So…
At the December SJRA board meeting, busloads of Lake Conroe residents flooded the boardroom and the Fire Marshall turned away busloads more. To ensure everyone who wants to speak or show their support gets a chance, the SJRA will hold two special meetings at a larger venue closer to Lake Houston.
BOARD OF DIRECTORS SPECIAL MEETING DATES, TIME, AND LOCATION
Tuesday, January 21, 2020
6pm at Lone Star Convention and Expo Center
9055 Airport Road, Conroe, Texas 77303.
Doors open at 5pm.
Thursday, February 20, 2020
6pm at Lone Star Convention and Expo Center
9055 Airport Road, Conroe, Texas 77303
Doors open at 5pm.
Those wishing to address the board or register a comment at a special meeting may fill out a Comment Registration Form https://www.sjra.net/wp-content/uploads/2020/01/Comment-Registration-Form_01062020.pdf. Comment Registration Forms may be submitted at the special meeting. The form may not be mailed, emailed, or dropped off prior to the meeting date.
For Future Reference
For your convenience, this post has become a permanent page called Lake Lowering with all related blog posts and sample letters. You can access it through the main menu. Please share it with friends and family and get them to come to one of the board meetings or write an email of support.
https://i0.wp.com/reduceflooding.com/wp-content/uploads/2019/04/LC-Dam-e1719277556742.jpg?fit=1200%2C549&ssl=15491200adminadmin2020-01-17 08:44:122020-01-18 15:35:11Overview: Background Information on Lake Lowering Issue
Today, the Texas Water Development Board formally approved the $30 million grant that will extend the mouth bar dredging program started by the City of Houston last week. Approval had been expected, but in the often-delayed world of flood mitigation projects, the signed deal was a welcome relief. This means that mouth bar dredging can continue in a timely way before hurricane season starts.
Phase One will focus on the West Fork Mouth Bar using the City’s $6 million and $10 million from the grant.
Phase Two will focus on the East Fork Mouth Bar using the remaining $20 million from the grant.
The $10 million from the County flood bond will fund surveys, formulation of specs, bidding, project management and more.
Going Beyond Harvey Dredging
Since Harvey, dredging efforts have focused on identifying and removing deposits related strictly to Hurricane Harvey itself. See below.
Previous phases of dredging focused upstream of the fat blue area near the mouth bar.
Recently completed projects effectively removed sediment deposited by Hurricane Harvey; however, more dredging needs to be completed in the area farthest to the right. That will help restore conveyance and reduce flooding by removing a sediment dam behind the dam. It should also help improve lake capacity.
Additional details on dredging plans and progress reports should become available in the coming weeks. In the meantime, crews appeared to be busy assembling equipment today at the old docks used by the Army Corps.
Crews assembling braces on pontoon that will hold the spudpoles. The spudpoles will hold the pontoon in place while a mechanical excavator scoops sediment into waiting barges to ferry it back to the placement area.Photo taken 1/16/2020.
The City plans to kick off the program with mechanical dredging equipment because it can mobilize quickly. At some point, they may switch over to hydraulic dredging to take advantage of that technology’s greater efficiencies.
The Great Lakes Dredge from Phase 1 is still sitting at the Army Corps dock in pieces while new equipment mobilizes around it. Rumor has it that the Great Lakes dredge is for sale. Photo taken 1/16/2020.
Huberty has already started lobbying for additional funding to help with longer-term maintenance dredging.
Two More Steps Before Kicking Into High Gear
Late today, John Blount, Harris County Engineer who authored the grant request said that there are two more formalities before the program can kick into high gear.
Harris County Commissioners Court, which previously approved the grant request, must now also approve receipt of the award and sign an inter-local agreement with the City of Houston. The latter will govern the working relationship between the City and County. The next Commissioners Court meets on January 28.
The permit to use Berry Madden’s property as a placement area must be amended to accept mechanical dredging spoils, not just hydraulic.
Posted by Bob Rehak on 1/16/2020
870 Days since Hurricane Harvey
https://i0.wp.com/reduceflooding.com/wp-content/uploads/2020/01/20200116-RJR_6419.jpg?fit=1200%2C800&ssl=18001200adminadmin2020-01-16 19:30:132020-01-16 19:50:27Texas Water Development Board Approves $30 Million Grant for Mouth Bar Dredging
MoCo commissioners don’t make the decision to continue the policy. Their resolution shows only symbolic support for Lake Conroe residents. The SJRA board will make the final decision. So Daryl Palmer’s valiant solo appearance won’t necessarily end this story. But if “diffusion of responsibility” similarly affects turnout at the next SJRA board meeting, I fear that will send a message to the SJRA board. That message: downstream residents no longer care.
Ten Two Letter Words That Make All the Difference in the World
Somebody told me once about ten two-letter words that make all the difference in the world.
“If it is to be, it is up to me.”
I’ve tried to live my life by those words since then. Unfortunately, yesterday, I had a meeting conflict and could not attend the MoCo commissioner’s meeting.
When people believe success requires their involvement, most get involved. If you care about your community and neighbors who flooded, I challenge each of you to come to the next SJRA board meeting. Tell why lowering Lake Conroe is important to you personally.
Photo courtesy of Laura Vowinkle. Shows Kingwood Town Center Apartments during Harvey. That’s the top of an SUV in the foreground. These apartments are more than a mile north of the West Fork.
US59 During Harvey after the Lake Conroe release. Looking south from Sorters-McClellan overpass toward the Deerbrook Mall and Humble commercial district. Photo courtesy of Melinda Ray.
During the Lake Conroe release, Janet Wilson lost her home, two cars, 48 years worth of family heirlooms, pictures, books, keepsakes and furniture. She says the greatest damage though was the two years it took to restore family’s life; time that could have been spent with her aging and now deceased parents.
Another photo of Janet Wilson’s life on the curb.
Lowering Lake Conroe seasonally until other mitigation measures are complete is insurance. You don’t use insurance every year. But who would own a home or drive a car without it. The costs could be catastrophic.
Don’t think the SJRA board will automatically do the right thing.
Don’t rely on our political representatives to carry the day. They face opposition from representatives on the other side of this question.
Don’t assume that your voice won’t make a difference.
Don’t believe that because you didn’t flood, your home’s value was not affected.
Don’t pretend flooding could not happen again.
Four 100-year or greater storms hit this area in the last five years.
So act on those ten two-letter words. “If it is to be, it is up to me.”
Make Your Voice Heard
BOARD OF DIRECTORS SPECIAL MEETING DATES, TIME, AND LOCATION
Tuesday, January 21, 2020
6pm at Lone Star Convention and Expo Center
9055 Airport Road, Conroe, Texas 77303.
Doors open at 5pm.
Thursday, February 20, 2020
6pm at Lone Star Convention and Expo Center
9055 Airport Road, Conroe, Texas 77303
Doors open at 5pm.
Those wishing to address the board or register a comment at a special meeting may fill out a Comment Registration Form https://www.sjra.net/wp-content/uploads/2020/01/Comment-Registration-Form_01062020.pdf. Comment Registration Forms may be submitted at the special meeting. The form may not be mailed, emailed, or dropped off prior to the meeting date.
The SJRA Board of Directors also welcomes input regarding the seasonal lake lowering strategy via mail or email. To contact the Board please visit: https://www.sjra.net/about/board/. Scroll down to the bottom of the page to see the email form. Or email floodmanagementdivision@sjra.net.
The Lake Houston Area Chamber of Commerce has automated email that makes the process easy. But original emails that tell your particular story likely will carry far more weight.
Tomorrow, I will add a special page to this web site. It will contain all the information you need to compose your own letter or prepare spoken comments. Please continue to send in your photos of Harvey via the Submissions page on this web site so that we can dramatize the difference between real and perceived damages. In the meantime…
Don’t let diffusion of responsibility victimize you a second time.
Posted by Bob Rehak on 1/15/2020
869 Days since Hurricane Harvey
https://i0.wp.com/reduceflooding.com/wp-content/uploads/2020/01/Kingwood-Town-Center-Apts.jpg?fit=1200%2C563&ssl=15631200adminadmin2020-01-15 18:45:102020-01-17 08:52:46Lake Lowering and Diffusion of Responsibility