Lauder Basin: Another Flood-Mitigation Project that Doesn’t Exist According to Some
On Lauder Road west of JFK, Harris County Flood Control District (HCFCD) has been building a detention basin next to Greens Bayou. This is another one of those detention basins that doesn’t exist, according to some politicians and community activists. Even though the politicians voted to fund the projects, and the projects are well underway, those same politicians claim that all of the flood-bond money is going to richer watersheds because of the higher home values.
Watershed with Second Most Funding Since Harvey Allegedly has None
In reality, the Greens Bayou watershed has received almost $300 million in funding since 2000. Half of that ($156.8 million) has come since Harvey.
Only one other watershed has received more HCFCD funding since Harvey.
Data Obtained Via FOIA Request from Harris County.
$38.5 Million Going to Lauder Basin

By the time Phases I and II are complete, the detention ponds will hold 1,600 acre-feet of of stormwater. That’s enough to hold a foot of rain falling across two and a half square miles.
According to HCFCD’s website, construction on Phase I should finish by the end of this year. Phase II should start next year. The two projects have a combined budget of $38.5 million.
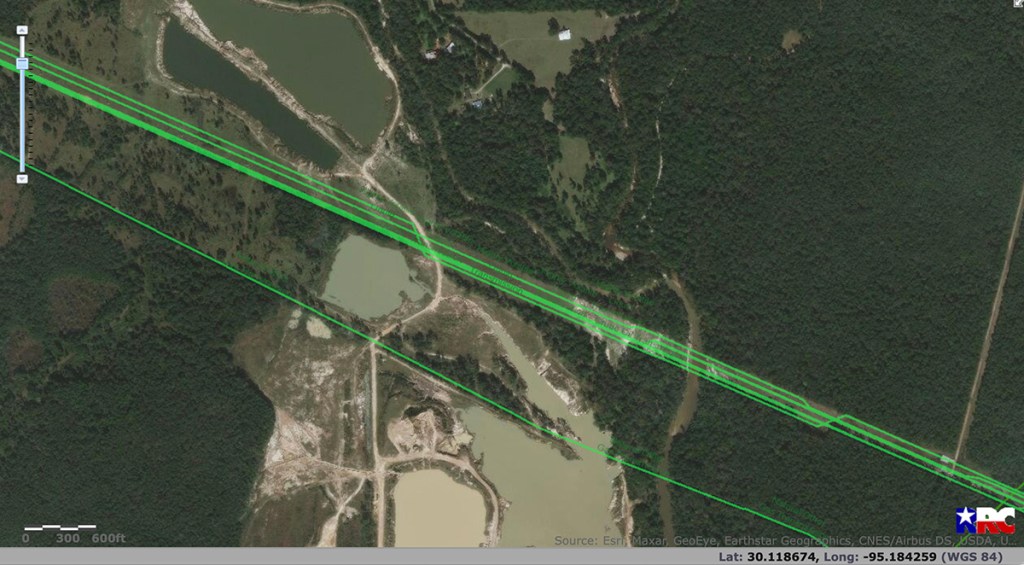
If you don’t believe the Flood Control District website, check out Google Earth, or the satellite views in Google Maps and Apple Maps. This project is so big, you can see it from outer space.

The following photos were all taken on Sunday, 7/25/2021, around noon.
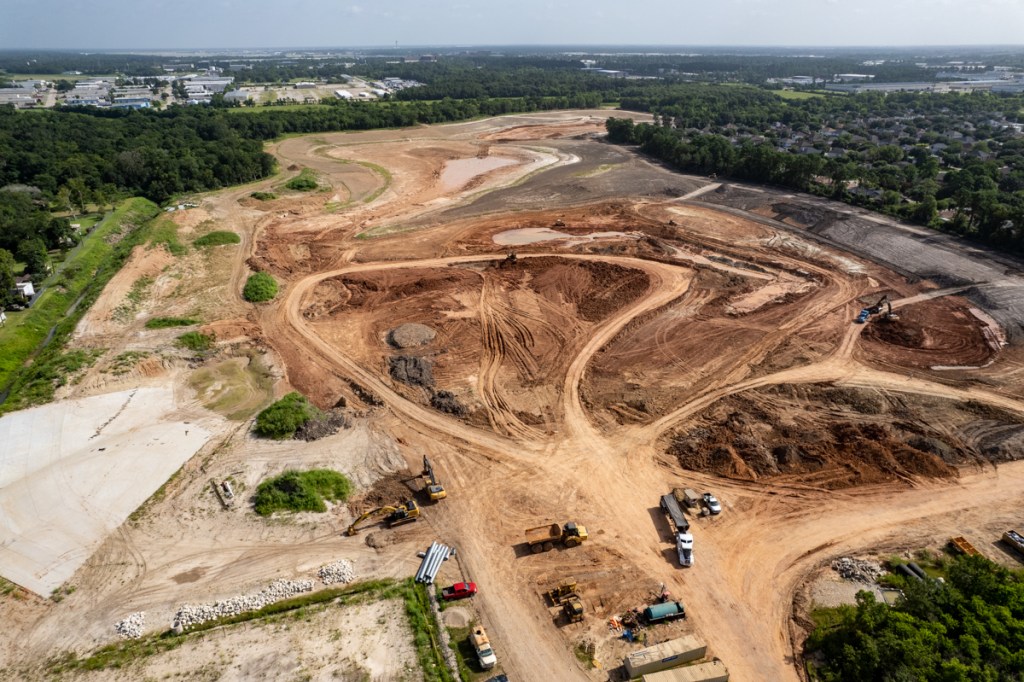


Still Don’t Believe the Project Exists?
Think the photos are some kind of Photoshop trick? Visit the site yourself. Construction is bustling. On Sunday, around noon, I watched dozens of trucks coming and going while I took the photos above. Here’s how to get there.

Counterfeiting the Currency of Communication
The bizarre thing about this project is that the politicians who say it doesn’t exist are the ones who funded it. Go figure. Such is the sad, sorry state of politics in America today.
I’ve even talked to professors, professional engineers, MBAs, and PhDs in engineering who claim this and similar projects in Halls and Greens Watersheds don’t exist!
Worse yet, they refuse to look at the pictures, go to the construction site, review Flood Control’s website, or trust audited county spending data.
Language is the currency of communication. It’s how we cooperate. How we get things done. It’s one thing to disagree over project priorities. But another to claim projects don’t even exist when they do.
As a consequence, public policy has become divorced from reality. This is worse than being duped by misinformation. It’s the unwillingness of people, even including some journalists, to review available information that helps the public make informed decisions. And it doesn’t bode well for your region.
Posted by Bob Rehak on 7/28/2021
1427 Days since Hurricane Harvey