Today, October 30, 5:00 p.m. is the deadline to send testimony to the Texas House of Representatives Interim Committee on Aggregate Production Operations (APOs). The committee is looking into production practices of sand mines and other types of APOs across Texas.
If you haven’t yet submitted comments, please take time to put something together—even if it’s just a few paragraphs!
Write about how YOU personally have been or will be impacted by sand mines. Pick one or two of these key issues that will most affect you personally:
???? Air quality ???? Water quality, use and availability ???? Surface and ground water contamination and flooding ???? Rapid development of APOs without adequate regulatory oversight, mine planning, or reclamation ???? Truck traffic ???? Nuisance issues: blasting, noise, odor, visible blight ???? Economic impacts, devaluation of property
How to Submit Comments
When you are ready to submit your testimony, email it to jeff.frazier_hc@house.texas.gov (jeff DOT frazier UNDERSCORE hc) or press the link below. Make sure to include:
Your name
Address
Phone number
Testimony in attachment (PDF preferred, Word Document OK, preferably five pages or less)
Sand mining is necessary to make concrete and support growth. No one wants to put sand miners out of business. People do, however, have legitimate issues with egregious sand-mining practices.
They want sand produced in a manner that respects public safety, health, homes, and the environment.
Since starting this website I have created more than 200 posts about problems with the way sand mining is actually practiced in the Houston Area, and how dangerous practices contribute to flooding. To learn more, use the search phrase “sand mines” or see the index page. Here are some examples.
Sand mining in floodways on West ForkDischarging industrial waste water into the public drinking water supplyAnother discharge of industrial wastewater into the headwaters of Lake HoustonFailure to stabilize soil or restore land to alternative us after abandonment of mine.Mining too close to natural gas pipeline and exposing itEndangering five pipelines carrying highly volatile liquids near the West Fork San JacintoWest Fork sand dune deposited during Harvey downstream from 20-square miles of mines in floodway. It contributed to the flooding of more than 7,000 structures.River mining without a permitFlooding adjacent property with floodwaterBarely plugged breach near LMI mine on West ForkPumping wastewater into wetlands
Don’t tolerate sand-mining practices that jeopardize your home, family and community. Write today.
Posted by Bob Rehak on 10/30/2020
1158 Days since Hurricane Harvey
The thoughts expressed in this post represent opinions on matters of public concern and safety. They are protected by the First Amendment of the US Constitution and the Anti-SLAPP Statute of the Great State of Texas.
https://i0.wp.com/reduceflooding.com/wp-content/uploads/2020/05/20191104-RJR_4147.jpg?fit=1200%2C800&ssl=18001200adminadmin2020-10-30 14:58:542020-10-30 15:23:05Submitted Your Sand Mine Testimony Yet?
As far as I can tell from the presentation, the new tactic is the use of the Internet. Wowsers! That’s quite an insight!
In the presentation, they specifically mentioned ReduceFlooding.com. I’m sure I anger these people as much as they anger me. I have met with them five times now. None of the meetings resulted in any change of industry practices. Or even a genuine willingness to explore them.
The Boy Scout Connection
In Austin during the last legislative session, a House committee member (evaluating a bill to establish best management practices for the industry) asked whether TACA had engaged with communities they affected. Mr. Rob Van Til (a mine owner and TACA spokesperson) looked at me waiting to testify, and said, “We’d prefer to talk to the Boy Scouts.” And just like that, the bill died in committee.
TACA sees people trying to protect their communities as the enemy. Instead of engaging with “the opposition” and trying to reform damaging mining practices, they rally support among neutral third parties.
How concrete supports Texas’ growth by providing essential infrastructure materials
Why “WeRTexas”
Teacher and school workshops they sponsored
Legislative and staff tours they promoted
Chamber of Commerce mixers
Quarry Days
They also patted themselves on the back for bicycle donations to a children’s charity in San Antonio.
Millions in Back-Door Political Contributions
TACA has also donated millions of dollars to legislators and state officials through a back-door political-action committee called TACPAC. Meanwhile, TACA has refused to acknowledge damaging practices and resisted all attempts to develop meaningful best management practices that address them.
Delivering Air Cover for Members
It’s tough for trade associations to tell members what to do. Loss of members means loss of funding for the association. For the most part, members want air cover from associations. And that’s what TACA delivers.
Communication experts on controversial issues divide the world into three camps: pro, undecided, and anti.
Conventional wisdom says you target messaging to pro and undecided groups. And that’s exactly what TACA is doing. Because you rarely swing anti’s.
For the record, I like concrete. I DON’T LIKE the irresponsible production of it. And what TACA never shows people and avoids talking about. So I will redouble my efforts. And continue advocating for responsible aggregate and concrete production.
Explain These to The Boy Scouts and Kids Clubs
Below is a tiny sampling of more than 10,000 aerial photos I have taken in the last eight months along the East and West Forks of the San Jacinto in southern Montgomery County.
Let’s turn these into murals at the State Capitol for TACA Day next year. Just so legislators get the full picture.
20 square miles of sand mines to the left up the West Fork.One of eight breaches at Triple PGin October 2019. This one on Caney Creek.Second of eight breaches at Triple PG in October 2019. This one on White Oak Creek.Pumping wastewater into the West ForkConfluence of West Fork (right) and Spring Creek on 11/4/2019.The Day the West Fork Ran White. TCEQ traced this back to the LMI Mine upstream.More pumping into the West Fork.One part of a double breach at the Hallett Mine that blew out the sand bar on the opposite side of the West Fork.Five pipelines carrying highly volatile liquids undermined at the LMI River Road mine.Massive breach barely patched and ready to let loose again.Equipment abandoned in floodwayLMI Moorehead mine. TCEQ traced white-water incident to here.River Aggregate Mine on West ForkLMI River Road Minepouring into surrounding wetlands.Pipe that automatically sends wastewater from mine into surrounding forest when level gets high enough.Wastewater from LMI River Road mine leaking across neighbor’s property……where it enters sewer system under road and then empties into West Fork.LMI Moorehead Mine pumping wastewater into surrounding forest where it can’t be seen by road or river. Eventually this drains back into West Fork……which can be seen here (top) where it joins Spring Creek at 59.Ditches or small streams go along the sides of every mine on the East and West Forks. Breaches and pumps are common along these. They make a secluded way to send water to the river.River mining without a permit at Spring West Sand and Gravel on West ForkThat blue water is either high in chlorides or cyanobacteria.Another wastewater leak from LMI River Road mine where it enters West Fork.
Unsolicited Advice to TACA
Dear TACA. If you want to protect your organization from community opposition, start cleaning up your act. That would be a new and truly effective tactic.
Posted by Bob Rehak on 7/3/2020
1039 Days after Hurricane Harvey
The thoughts expressed in this post represent opinions on matters of public concern and safety. They are protected by the First Amendment of the US Constitution and the Anti-SLAPP Statute of the Great State of Texas.
https://i0.wp.com/reduceflooding.com/wp-content/uploads/2020/07/20191002-EF-WF-Aerial_632.jpg?fit=1200%2C800&ssl=18001200adminadmin2020-07-02 21:26:222020-07-02 22:01:40How TACA is Winning the Battle to Continue Pillaging Your Environment and Polluting Your Water
More than a decade after one San Jacinto West Fork sand mine stopped mining, the abandoned mine is still:
Inundated by floods
Leaking silty water into the river from multiple locations
Littered with mining debris
Unrestored.
That Was The Good News
Worse, it has little hope of ever being restored. The West Fork has captured one of the mine’s main pits as predicted two years ago. Now, process wastewater leaks from an upstream mine into the abandoned mine, and from there, into the river.
TACA fondly says that mines CAN be repurposed into lakes that make recreational amenities for residential developments. That’s true. If miners cared. If someone was watching. And if we had regulations that forced reclamation.
Last week, I published a story about an abandoned Texas Concrete Plum Grove plant on the East Fork. Today, I focus on a West Fork mine that used to be operated by River Aggregates as the Porter Sand and Gravel Plant. See below.
Landsat image from 10/28/2017. Comparison of this satellite image and the one below, both from Google Earth, shows that the area inside the large red circle was a settling pond in danger of being captured by the river. And it was.See below.Google Earth image from 12/1/2019, thirteen months later. Mine is outlined in red. Circles represent breaches that I will discuss below.New development on right is Northpark Woods.
The mine in question lies between Sorters-McClellan Road and the West Fork, and just north of the Northpark drainage ditch. It sits immediately west of the new Northpark Woods subdivision. The last image in Google Earth that shows active mining was dated 2008.
Current Images Show Lasting Leaks
Looking southeast. Both ends of the main pond (adjacent to the Hallett mine) have sprouted leaks. This is on the northwest side of the mine.Photo taken 4/21/2019.Looking southwest. The Hallett Mine, above the mine in satellite photos above, is almost overflowing in this image taken on 4/21/2019. It sometimes does overflow. See below.Looking northeast. Top circle shows where the Hallett Mine sometimes leaks into the mine in question. Bottom circle shows where the second mine then leaks into the West Fork (in the right foreground).Photo taken 4/21/2019.At the other (southeastern) end of the same pond, river migration cut into the wall that separated the mine from the West Fork. The pond now constantly leaks into the West Fork.Photo taken 4/21/2019.Here’s how it looks from the reverse angle. Looking east toward Northpark Woods development in upper right next to Northpark Drainage Ditch Photo taken 4/21/2019.Compare this with the photo below.
River Migration Led to Transformation
On September 14, 2017, I photographed the same mine from the same angle. Here’s how it looked then. Note that a narrow strip of land only a few feet wide separated the mine from the river at that time.
As the images above show, sometime between 10/28/2017 and 12/1/2019, the West Fork migrated into the mine’s settling pond. The breach then allowed the mine’s wastewater and wastewater from surrounding ponds to drain into the West Fork.
In 2018, on the first anniversary of Hurricane Harvey, I discussed the mine above in a post about river migration. The post said, “At the current rate, without human intervention, river migration should capture the mine … in about three years.” It took less than that.
The abandoned mine will not be much of an amenity for buyers in Northpark Woods. The forests and wetlands that once made this area such an ecologically rich place to explore are gone forever. So are the deer and the fish.
But downstream residents have it worse. They receive all the sediment flowing out of such mines and clogging the river. They must spend hundreds of millions of dollars to restore conveyance of the river so their homes and businesses don’t flood.
There are two lessons to take away from this and other abandoned mines. We need legislation that mandates:
Greater setbacks from rivers for mines. Get them out of the meander belt.
Posting of performance bonds the guarantee reclamation before miners start mining.
Miners can and do sometimes simply ignore the promises they made to restore the land before they got their permit to start mining. When they do, they leave us with a barren moonscape. Littered with craters. And a lasting legacy of loss.
Posted by Bob Rehak on 5/11/2020
986 Days after Hurricane Harvey
The thoughts expressed in this post represent opinions on matters of public concern and safety. They are protected by the First Amendment of the US Constitution and the Anti-SLAPP Statute of the Great State of Texas.
https://i0.wp.com/reduceflooding.com/wp-content/uploads/2020/05/20200421-RJR_1003.jpg?fit=1200%2C800&ssl=18001200adminadmin2020-05-11 09:16:482020-05-11 18:37:49Abandoned Sand Mines Leave Lasting Legacy of Loss in Southeast Texas
In March, Montgomery County Commissioners voted to sue a new sand mine operating near the Carriage Hills subdivision of Conroe. The county attorney sought to force the mine to remove unspecified materials from the West Fork floodway while they resolved permit issues. Since then, according to residents, the mine has voluntarily suspended operations.
Aerial Photos/Maps Show Mine in Floodway
However, a flyover on 4/21/2020 revealed that mining, processing, and transportation equipment remains in the floodway.
New mine in San Jacinto West Fork floodway near Carriage Hills (background on left) in Conroe.Reverse angle. Floodway cuts between homes in foreground and mine in background. River concealed by trees in background.See FEMA flood map below.Cross-hatched area = floodway. Aqua color represents 100-year floodplain. Brown = 500-year floodplain. Source: FEMA.
From 600 Truckloads a Day to Nothing
The once bustling operation with 600 trucks per day coming and going down Carriage Hills Boulevard now seems eerily quiet. It’s not clear whether the suspension of operations relates to the County lawsuit, COVID, a drop in demand due to the economic downturn, or all of the above.
Close up shot of operations.Residents say that before suspension of operations, the mine was running up to 600 trucks per day up Carriage Hills Blvd. leading to top of photo.A second, smaller part of the operation.Another sand mining operation brackets the other side of Carriage Hills.
Residents Fear Resumption of Activity
While residents enjoy the quiet, they see it as temporary. They fear that once the COVID crisis passes and the mine resolves its permit issues, the round-the-clock truck traffic will quickly return.
Indeed, the Montgomery County Engineer’s Office, indicates that the owner of the new mine has re-applied for a permit. That permit is now under review.
Even if you see zoning as a communist conspiracy, as some in Montgomery County do, being surrounded by sand mines kind of makes you a believer in large-scale, master-planned communities.
So much for those idyllic little hideaways in the woods.
Posted by Bob Rehak on 4/27/2020
972 Days since Hurricane Harvey
The thoughts expressed in this post represent opinions on matters of public concern and safety. They are protected by the First Amendment of the US Constitution and the Anti-SLAPP Statute of the Great State of Texas.
https://i0.wp.com/reduceflooding.com/wp-content/uploads/2020/04/20200421-RJR_0611.jpg?fit=1200%2C800&ssl=18001200adminadmin2020-04-27 14:19:092020-04-28 10:54:01Carriage Hills Sand Mine Still Has Equipment in West Fork Floodway
Confluence of Spring Creek (left) and San Jacinto West Fork (top) on March 6, 2020.The Montgomery County line cuts left to right through the center of this picture at the tip of that white sand bar.
If the Clean Water Act were still being enforced, we might see scenes like this less often. You’re looking at the confluence of Spring Creek and the San Jacinto West Fork. It has looked like this during random flyovers in four out of the last six months.
Liberty isn’t the only sand mine on the West Fork. You can find approximately 20 square miles of sand mines in the twenty mile stretch between I-69 and I-45. Spring Creek on the other hand has only one mine – almost 30 miles upstream at SH249.
Most West Fork mines have a tendency to leak waste water from time to time. That’s part of what you see in the photo above. Below are seven NEW breaches spotted this month upstream on the West Fork.
Mine water leaks into wetlands and out past perimeter road at LMI E. River Road mine in Conroe.Pumping water over dike at same Liberty Materials Mine on River Road.At same mine, a pipe through the dike discharges water at a fixed height into an adjoining ditch that leads to the West Fork.Liberty Materials leaks water into backyard of home in Bennett Estates. From here it goes into a storm drain on Calhoun and into the river.Difficult to see at this resolution, there’s a pump in front of the trees on the left. It’s sending waste water into the wetlands below the mine. Hallett sprouts another leak into the West Fork (lower right).Most of these breaches happen out of sight and never get reported.
Another part of the West Fork turbidity problem is upstream construction in Montgomery County. Believe it or not, Montgomery County starts at the tip of that white sand bar at the confluence of Spring Creek and the West Fork.
That’s how you get construction practices like those in the new 2200 acre Artavia complex going in next to the West Fork sand mines, just south of SH242 by FM1314. Brand new culverts are already clogging. See below.
Artavia drainage ditch and culverts. A river of mud.
More on Artavia in a future post.
The erosion is so bad, even the erosion is eroding in many places.
Decline of Clean Water Act
Then, of course, another part of the problem is the gutting of the Federal Clean Water Act. States, counties and municipalities used to have someone setting standards and looking over their shoulders. The rollback of key provisions, such as the redefinition of “waters of the U.S.”, has been heralded as a boon to developers and the death knell of wetlands.
Of course, you don’t have to change regulations to kill them. You can just not enforce them. By turning a blind eye. Gutting enforcement staff. Overruling staff. Reinterpreting policy. Ignoring evidence. Or resetting priorities. To name just a few.
Don’t Know What You Got Till It’s Gone
Many of us who grew up before the Clean Water Act (formerly known as Federal Water Pollution Control Act, passed in 1972) remember how bad things were. Like the Cuyahoga River fire in 1969.
The San Jacinto West Fork has already been named one of the most endangered rivers in America. But my biggest fears are not for the river. They’re for the health of the millions of people who depend on water from the river. For the people who will flood when the river becomes clogged with sediment. For the poor and elderly who can’t afford sky high bills to cover the cost of water treatment. And for the long-term health of the economic hub of the region, Houston.
Posted by Bob Rehak on 3/14/2020
928 Days after Hurricane Harvey
The thoughts expressed in this post represent opinions on matters of public concern and safety. They are protected by the First Amendment of the US Constitution and the Anti-SLAPP Statute of the Great State of Texas.
https://i0.wp.com/reduceflooding.com/wp-content/uploads/2020/03/20200306-RJR_9506.jpg?fit=1200%2C800&ssl=18001200adminadmin2020-03-14 21:46:342020-03-14 21:47:53Clean Water Act, R.I.P.
Triple P.G. Sand Development LLC appears to have violated provisions of an injunction by dredging before its trail and flooding neighboring properties with industrial waste water.
In part, the injunction stipulated that the defendant shall:
Not conduct any dredging operations at the Facility.
Not engage in any operations at its Facility that discharge process wastewater, nor shall Defendant engage in any operations at the Facility that produce process wastewater that must be discharged off Defendant’s property without express prior approval from TCEQ.
Immediately and permanently cease and prevent all discharges of any Industrial Waste and/or Process Wastewater from the Facility into or adjacent to waters in the state.
Not allow any discharge of water that is in or has ever been in the Facility’s Dredge Ponds without the express prior approval of TCEQ.
Aerial Photos Show Potential Violations
The aerial photos below show that within eight days of agreeing to the injunction, the mine started pumping process wastewater OVER BERMS into a pit that then overflowed onto the property of adjoining landowners and lands adjacent to White Oak Creek.
Before showing you the photos, let me show you a satellite image that helps illustrate the relationship between the different elements of this report.
Overview of mine, area drainage and adjoining properties in Montgomery County. Note the location of the mine’s stockpile in the satellite photo above for orientation when viewing the photos below. Brownish creek to right of mine is Caney Creek. Blue line shows approximate path of White Oak Creek through forest. Red oval shows adjoining properties in area of interest. Solid red line shows ditch around perimeter of mine. Green lines show approximate locations of breaches in Attorney General’s lawsuit.
Water pumped out of the mine’s wastewater pond is now flooding neighboring properties within the red oval that he does not own. The mine also dug a ditch around the perimeter of its property (solid red line) through dense forest that channels the process wastewater toward White Oak Creek (solid blue line) and the wetlands along it. It’s not clear, though, whether the wastewater has actually entered the creek yet; the forest canopy limits visibility. Regardless, the injunction says they can’t discharge waste adjacent to waters of the state.
No Flooding That Lasted Months of Adjoining Properties Until Injunction
None of the historical satellite images in Google Earth dating back to 1989 show flooding in the red oval. Some of the properties in the red oval lie in the 100-year flood plain. However, there has been no widespread flooding in this area since Imelda on September 19, 2019.
Nor has there been prolonged flooding as far as I can determine. Photos taken of this exact location on 9/27/2019, ten days after Imelda, show no flooding of the adjacent properties. Likewise, the property was not flooded on 9/14/2017, two weeks after Harvey. I can find no evidence that this area has ever flooded for months before.
Looking south toward stockpile in background. Properties in the forested strip do not belong to Guniganti. On 9/27/2019, ten days after Imelda, they showed no flooding.
For months, I’ve been watching waste water build higher and higher in the area above until it overflowed the pit and invaded neighboring properties. That made me curious and prompted a review of thousands of aerial photos. Here’s what I found.
Photos Taken In November Before Injunction Show Neighboring Land Still Not Flooded
The neighboring properties were NOT flooded on November 4, 2019 (before the injunction). Notice the level of water in the foreground pit – higher than after Imelda, but still waaaay short of overflowing.
Think of the November 4th photo below as the “before” shot. Compare it with other photos below taken from December through March 2020.
Properties in the red oval are between the pit in the foreground and stockpile in background. Note level of water in pit.Photo taken November 4, 2019, looking south.The mine’s process waste water enters the pit immediately to the left of the trees.
After Injunction, Mine Starts PUMPING Waste Water OVER Dike
Eight days AFTER the injunction, on December 3, 2019, I flew over the mine again. I noticed that the mine was pumping water out of its main waste water pond and into the pit in the photo above. But the pit had not yet overflowed. Here’s how the pumping looked. (Note: You can even see the pumping from outer space if you zoom in on this area within Google Earth and look at the Dec. 1 satellite image.)
Close up of pump taken on 12/3/2019. The pumping operation can also be seen in Google Earth satellite photo dated 12/1/19.
On January 20, Pumping Continues From Different Location
I flew over the mine again on January 20, 2020; the pumping from and into the same pits continued – but from a different location.
Looking West. Notice the line running from the arc in the wastewater pond (diagonally from center to lower right).Looking south. The same line dumps water into the trench (bottom left). The trench then carries the water south (toward the top of the frame) to fill the pond next to the stockpile and flood adjoining properties with waste water.Looking SE. Here’s what it looked like closer up. Notice the waste water extending into the tree line and ending at the stockpile (upper right). The same pond that had plenty of excess capacity in September and November was now overflowing.Looking south. This wider shot shows the flooding wastewater curled around the stockpile and headed south into the woods where White Oak Creek flows toward the mine.Looking SE. Close up of the waste water turning the corner around the stockpile.
From where you lose visibility of the ditch under the forest canopy to White Oak Creek is about 80 yards according to Google Earth.
Floodwaters Even Higher on February 13
On my February 13, 2020, overflight, I captured the following images. They show the floodwater had risen even higher and backed up farther.
Looking SW. On February 13th, the flooding wastewater appeared even higher.Looking SE.It still curled down the ditch on the west (right) side of the mine and flowed into the woodstoward White Oak Creek
Water backed up so far, it even flowed into the utility corridor at the north end of the mine.
Looking East.Water in utility corridor at north end of mineon February 13, 2020
In March, Possible Dredging Observed, Still Flooding Neighboring Properties
In March, one of the first things I noticed was the dredge. The cutterhead, which had been elevated for months, was now DOWN. That usually indicates the dredge is working. And that’s something the injunction prohibited.
Dredge with its cutter head down usually means active dredging.
The pond next to the waste water pit overflowed onto neighboring properties even more. It came right up to the road. Note the huge difference between the levels of the two ponds below.
Note how high the water level is in the pond at the top of the frame compared to the waste pit at the bottom. Looking SW. Floodwaters stretch into adjoining properties. Stockpile is behind trees in upper left.Looking SE. Floodwater still fills the ditch running south along west side of stockpile.Looking NW at wastewater flooding adjoining properties.Stockpile is in lower left.Looking SE. Adjoining properties are in tree strip in front of stockpile. Notice waste water among the trees.Looking north from over stockpile toward vast areaflooded with waste water.Looking west. Even more of utility corridor is flooded in March.
Water In, Water Out
Miners use water to clean silt out of the sand before shipment. Note the damp sand coming off the conveyor belts.Looking south. A river of waste water is seen leaving the processing equipment on March 6, 2020.Looking NW. The silt-laden waste water even forms a delta in the waste pit. Flooded properties are on the other side of the road that cuts diagonally through the frame from middle left to upper right.
So water is leaving the processing equipment and going into the waste pit. It has to come in from somewhere. But where? As you can see from the photos below, the supply lines for the processing equipment come from the dredge pond.
Looking west. Water goes into the processing equipment from the dredge pond.Looking North. Wide shot showing dredge with cutterhead down and discharge pipe leading back to shore.
In the shot above, you can see that the lowest pond in the whole operation is the pond receiving ALL the waste water. Why is that?
The Big Questions and Some Possible Answers
So it appears that the mine is pumping water out of the dredge pit, into the waste pit, and finally into the surrounding forest. The big questions are these.
Why is the mine keeping the level of the water in the waste pit so low?
Why is the mine flooding the surrounding forest and neighboring properties with industrial waste water?
Is the waste water polluting White Oak Creek?
To hypothesize some answers to those questions, let’s look at two pictures: the first from February and the second from March.
Looking south. February 20, 2020. Miners have been removing sand from area with all the tracks in the center and the big pond at the lower left.
From this one photo, we can see that to avoid dredging (per the injunction), the miners have started surface mining. But the level of mining is getting down to a) the water table, and b) the level of the waste pit.
Looking NW. March 6, 2020. Three weeks later, mining is now BELOW level of water in the waste pit.
Note the differing levels of water in the forest (top) and waste pit (middle). Also note that the level of the surface mining has now gone far below the level of sediment in the waste pond.
From this photo (and others in the series) we can conjecture what happened. Please note: I have no proof of this. It is only conjecture.
Theory for the Discharge
I suspect that the mine realized that if it were to continue filling orders while it waited for trial on June 22, 2020, it would need to start surface mining AND mine below the level of water in the waste pit. So, I’m guessing they started lowering the level of the pond to keep mining as long as possible.
I’m also guessing that the terms of the injunction and heightened scrutiny by the TCEQ meant they could no longer make excuses about discharging water into the creek. So they discharged into the forest instead…most of which Guniganti owns except for that strip north of the stockpile. If the discharge drained into White Oak Creek deep in the forest, at least it wouldn’t be visible.
Is Discharge Reaching White Oak Creek?
Is the waste-water pollution reaching White Oak Creek? Because of the dense forest canopy, that’s impossible to determine from the air. One could only tell from the ground. And because Guniganti owns all the land around the mine (except for the properties in the red circle), the only way to determine that would be by trespassing. That makes it impossible for ordinary citizens to spot any illegal discharge, such as Tony Buzbee did when he was running for Mayor of Houston. Fortunately, the TCEQ has the right to inspect the property from the ground if it suspects a violation of the restraining order. And they are investigating this.
Summary of Potential Violations
This whole affair once again raises questions about whether sand mines should be permitted in floodways. This mine actually sits at the confluence of TWO. Which is part of the reason why it was sued by the attorney general in the first place. Both Caney and White Oak Creeks captured the pit last year and the TCEQ estimates millions of gallons of process waste water were discharged without a permit into the headwaters of Lake Houston.
Meanwhile, Triple PG appears to be discharging again without the benefit of storms to blame the behavior on. They also appear to be violating terms of their injunction by:
Dredging
Discharging process wastewater
Producing process wastewater that had to be discharged off their property.
Discharging water that had been in the Facility’s Dredge Ponds.
Discharging Industrial Waste and/or Process Wastewater adjacent to waters of the state (White Oak Creek)
I have contacted the TCEQ twice already about whether they permitted any of these activities. They have not responded yet, citing the ongoing investigation. However, I must believe that had they permitted the activities, they would not be investigating and would have replied immediately. They visited the site yesterday.
Posted by Bob Rehak on March 13, 2020
927 Days after Hurricane Harvey and 176 since Imelda
The thoughts expressed in this post represent opinions on matters of public concern and safety. They are protected by the First Amendment of the US Constitution and the Anti-SLAPP Statute of the Great State of Texas.
https://i0.wp.com/reduceflooding.com/wp-content/uploads/2020/03/20200306-RJR_0052.jpg?fit=1200%2C800&ssl=18001200adminadmin2020-03-13 20:13:412020-03-14 10:49:56Triple PG Mine Appears to Violate Injunction
As we enter 2020, keep your eyes on these stories.
Elm Grove Lawsuits and Mitigation
In 2019, Elm Grove flooded twice with runoff from the Perry Homes/Woodridge Village development in Montgomery County. Hundreds of homeowners sued Perry Homes’ subsidiaries (PSWA and Figure Four Partners) and their contractors.
On 12/17/19, attorney’s for the plaintiffs filed a fourth amended petition. Since the original filing, plaintiffs have named Double Oak Construction and Texasite LLC as additional defendants.
The judge set a jury trial date for July 13, 2020. To date, Perry Homes has done nothing to reduce the threat of flooding from their job site.
The 268-acres clear-cut acres that contributed to Elm Grove Flooding.
That brings us to the subject of mitigation.
What can be done to restore the safety of residents?
Perry Homes has demonstrated no interest in reducing the threat to downstream flood victims.
Protecting homeowners will require massive intervention from an outside source. But who? And how?
I recently learned of two new developments in the Ben’s Branch watershed.
A developer intends to build 18 acres of apartments where the woods adjacent to the new St. Martha Church now stand.
Another developer intends to build hundreds of homes on tiny lots on an 80-acre site just north of St. Martha’s.
These two projects represent dozens of others gobbling up farm and forest land in southeast Montgomery County.
This drainage ditch feeds into Ben’s Branch at Northpark Drive. The 18 acres of trees on the other side of the ditch could soon become apartments.
Businesses such as the St. Martha School and Kids in Action already flooded twice this year. So did dozens of homes along Ben’s Branch.
Additional upstream development has the potential to make flooding even worse. This is like death by a thousand cuts. Residents just don’t have the time or energy to monitor each development to ensure that owners follow rules and regulations for wetlands, floodplains, drainage, etc. Neither evidently does Montgomery County. Which brings us to…
Montgomery County Standards and Enforcement
Montgomery County competes for development by touting its lack of regulations. That’s a huge problem for downstream residents.
Montgomery County still bases flood maps on data from the 1980s.
Large parts of the county remain unmapped for flood hazards.
The County last updated its Drainage Criteria Manual in 1989.
Developers ignore many provisions within it.
County Commissioners voted to leave loopholes open that allow developers to avoid building detention ponds.
The County even paid an engineering company to investigate itself for its role in the Elm Grove Disaster.
You get the idea. If you thought some benign government entity watched over new developments to protect downstream residents, think again. Below you can see the 80-acre site I mentioned above.
Source: USGS National Wetlands Inventory.
Note how it was covered in wetlands. Developers did not ask permission from the Corps to remove them. They just decided on their own that they didn’t need to ask.
Below, you can see how virtually half the site is in a flood zone or floodway.
Here’s how it looks in Google Earth. Developers have already cleared the site.
Developers intend to build high-density homes in the floodplains. They will also build their detention pond in the floodway. Those hazard areas will likely expand when and if the County incorporates new Atlas-14 data into their flood maps.
Layout for Brooklyn Trails development in Montgomery County
None of this seems to bother the leadership of Montgomery County. And that’s a bigger problem than any one development.
In 2020, expect more focus on the decision-making process and decision makers who have created a permissive culture of indifference to flooding problems.
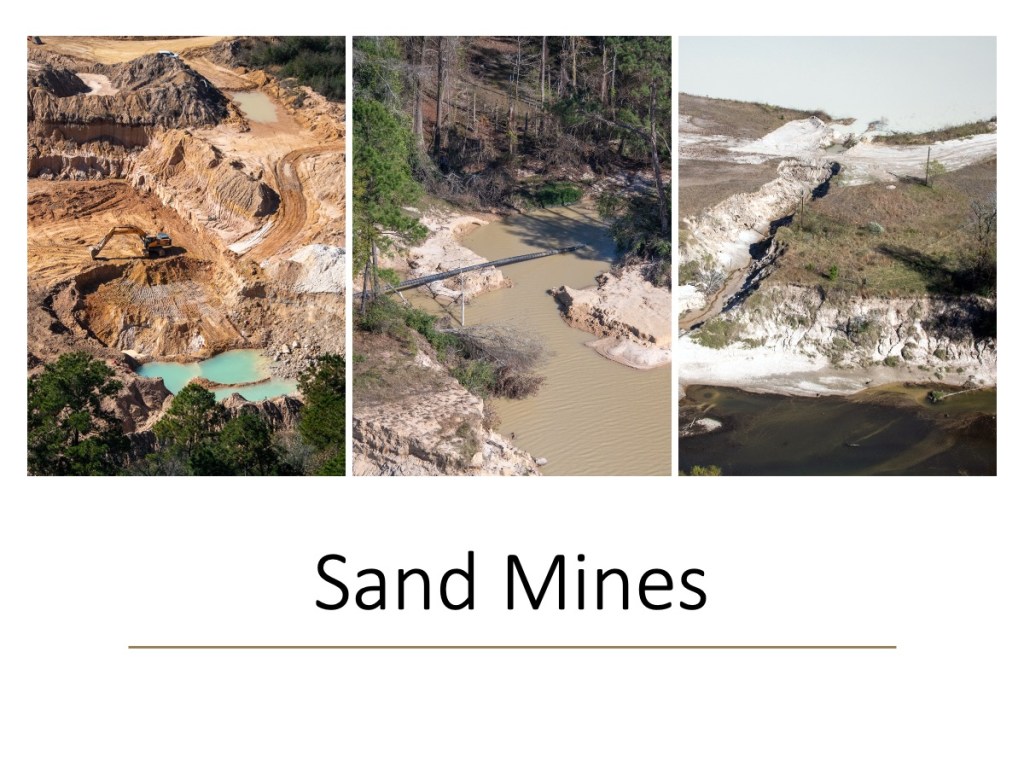
Sand Mines
Sand mines operate so closely to the San Jacinto that their walls frequently break and pour polluted process water into the drinking water for 2 million people. If they get caught, they pay a small fine and continue operating with impunity.
Left: Liberty Materials Mine in Conroe that undercut five pipelines carrying highly volatile liquids. Center: Triple PG mine in Porter where erosion during Imelda exposed one natural gas line and threatens 5 more HVL pipelines. Right: Another Liberty Materials mine that allegedly dumped 56 million gallons of white goop into the West Fork.
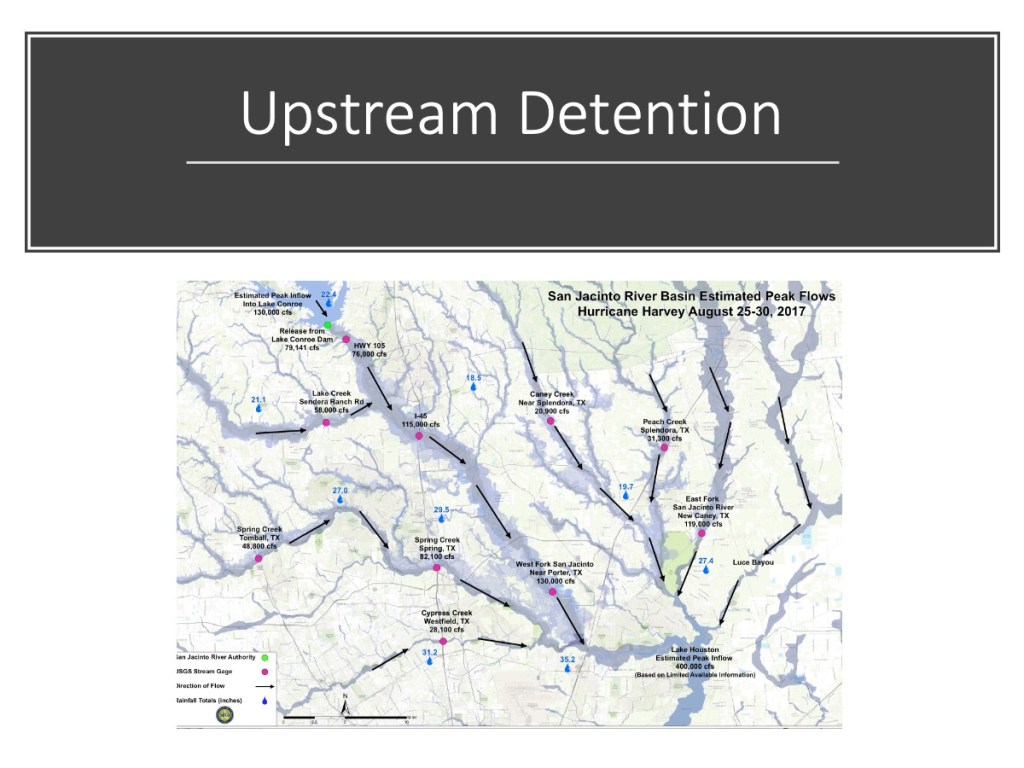
Upstream Detention
During Harvey, the release of 80,000 cubic feet per second from Lake Conroe added to downstream flooding. The goal: to find enough upstream detention capacity to help offset future releases. The San Jacinto River Basin Study will examine that possibility. It’s unlikely that one reservoir will provide enough capacity. However, multiple smaller reservoirs may.
Luckily, State Representative Dan Huberty sponsored legislation that allocated another $30 million. The Harris County Flood Bond allocated $10 million. The City of Houston allocated $6 million. Plus two more grant requests are still pending that could increase the total even more. And a disposal site for the material has already been permitted.
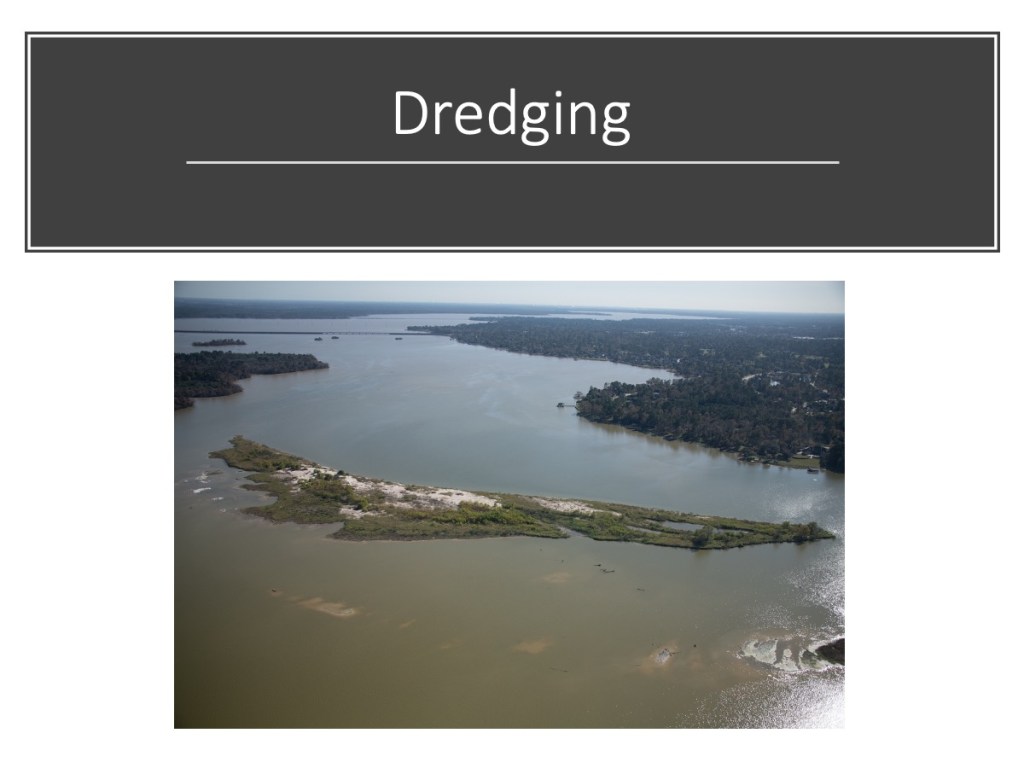
Mouth Bar of the West Fork. Photo taken 12/3/2019.
Last week, Harris County commissioners voted to proceed with additional dredging. Project managers are studying the most cost effective ways to proceed. We should see more dredging soon.
This money could also be used on the growing mouth bar of the East Fork.
State Highway 99 Extension
The extension of the Grand Parkway (State Highway 99) east and south to I-10 will open up vast new expanses of forest and farmland to high density development. The biggest threat will be to the East Fork watershed as construction moves through southeast Montgomery County and the northeast tip of Harris County into Liberty County.
Eastward clearing for SH99 has reached Caney Creek near Lake Houston Park.
Those are my predictions for the biggest stories of 2020. There’s a lot of good news in the forecast and much to remain vigilant about. Life seems to be a constant struggle between those who would increase and decrease our margin of safety when it comes to flooding.
Posted on 12/21/2019 by Bob Rehak
844 Days after Hurricane Harvey
The thoughts expressed in this post represent opinions on matters of public concern and safety. They are protected by the First Amendment of the US Constitution and the Anti-SLAPP Statute of the Great State of Texas.
https://i0.wp.com/reduceflooding.com/wp-content/uploads/2019/12/Slide14.jpeg?fit=1200%2C900&ssl=19001200adminadmin2019-12-21 12:30:522019-12-21 14:37:12Big Stories to Watch in 2020
The taxpayer-funded Grand Parkway (State Highway 99) extension will make many people happy. Proximity to transportation drives home-buying decisions. People eager to “get away from it all” will find the lure of saving 10 minutes on a longer commute irresistible. They will marvel at all the trees around them and speak with pride about their growing community in the forest.
Eastward expansion of SH99 from I-69.
It will also make the sand miners happy. It takes lots of sand to make concrete.
West Fork San Jacinto mine
Developers and homebuilders will take advantage of lax regulations in Montgomery County to boost their profitability.
Perry Homes’ Woodridge Village
And the flooding, caused by all the environmental destruction, means that downstream residents get to remodel their homes. Or move farther out to avoid future flooding. At which point the cycle will repeat itself in a few years.
Elm Grove Home below Perry’s Woodridge
From a marketing point of view, it’s a perfect, perpetual production-consumption cycle. How could you possibly improve it?
Posted by Bob Rehak on 12/8/2019
831 Days after Hurricane Harvey and 79 Days after Imelda
The thoughts expressed in this post represent opinions on matters of public concern and safety. They are protected by the First Amendment of the US Constitution and the Anti-SLAPP Statute of the Great State of Texas.
Mining sand near pipelines can expose the public to danger through erosion. We’ve seen this at the Triple PG sand mine in Porter where a potentially lethal combination of circumstances came together. 1) MINING 2) in a FLOODWAY 3) too close to PIPELINES 4) created EROSION 5) that undermined and EXPOSED the pipeline 6) to FLOATING DEBRIS and 7) the FORCE of floodwater.
Excavating pits in floodways causes erosion to move upstream and downstream during floods. When the pit is too close to infrastructure, such as bridges (or pipelines), erosion can then threaten their foundations.
Predictable Phenomenon
Headward erosion is a PREDICTABLE phenomenon. It’s as certain as gravity causing dirt to fall into a hole. Except in the case of the Triple PG sand mine, floodwater gave gravity an assist. It pushed the dirt into the hole. The hole, in this case, is the sand pit on the left below. The floodwater came from the top of the frame.
Headward erosion cut right through the pipeline crossing that paralleled what used to be a roadaround the mine.
This doesn’t happen every day. It’s sporadic. It happens during floods. But that makes it no less predictable.
How Triple PG Grew Toward, Between and Past Pipelines
The images below show the growth of the Triple PG Sand Mine northward into Montgomery County. In 1995, the mine was 2,000 to 3,000 feet away from the pipelines.
1995
2017 Pre-Harvey
The mine kept expanding to the west and north. Just before Harvey, notice how Triple PG had mined right up the pipeline and beyond it, into the danger zone between the pipeline corridors.
Then came Harvey.
2017 Post-Harvey
During Harvey, headward erosion took out about a 200-foot wide section of earth supporting the natural gas pipeline (also seen in the helicopter photo above). Harvey also elongated the lake in the middle of the pipeline corridors.
Then in 2019, this area had a major flood in May and Tropical Storm Imelda in September. The major breach widened and the lake elongated even more.
2019 Post-Imelda
Imelda widened the Harvey breach so wide and deep that it exposed more pipeline. (See photo below).
Exposed pipeline has no protection from floodwaters carrying trees, cars, houses or other debris downstream. A major collision could cause an explosion. But that’s not even the biggest potential catastrophe at the Triple PG mine.
Now … For the Real Disaster Scenario
Looking at a wider satellite image (below), we can see that the mine is now closing in on the HVL pipelines from the south AND the north. It brackets them.
Water flows from top to bottom in the image above. Note how Caney Creek bends near the white line above. During Imelda, floodwater cut through that area into the big northern pond at this bend instead of following the natural stream bed. See below.
Without constant repairs like you see above, Caney Creek could soon reroute itself through the big pit on the left below. Erosion on both sides of the utility corridor could expose the HVL pipelines – just as it did the natural gas pipelines. Not likely, you say?
A breach on the left would reroute Caney Creek right across the pipelines buried in the utility corridor on the right.
In the last three years, the two ponds along this line have grown closer together by more than 1000 feet. The ponds now are within a few feet of actually touching the pipeline corridor on both sides. Continued erosion could soon threaten the HVL pipelines in the middle if nothing is done to stop it.
Why is This Potentially MORE Dangerous?
Compared to exposing a natural gas pipeline, exposing liquid pipelines is far more dangerous.
When a natural gas pipeline explodes it creates a fireball that could kill anyone near it.
But when HVL pipelines rupture, they spew poisonous liquids. And if those pipelines rupture during a flood, those poisonous liquids will flow right into the source of drinking water for two million people – Lake Houston. This is why sand mining in floodways near pipelines is a bad idea.
Posted by Bob Rehak on 12/7/2019 with help from Josh Alberson
830 Days since Hurricane Harvey and 79 since Imelda
The thoughts expressed in this post represent opinions on matters of public concern and safety. They are protected by the First Amendment of the US Constitution and the Anti-SLAPP Statute of the Great State of Texas.
https://i0.wp.com/reduceflooding.com/wp-content/uploads/2019/12/Pit-Capture-North-Big-Pond.jpg?fit=1200%2C800&ssl=18001200adminadmin2019-12-07 18:37:282019-12-07 21:25:23From Erosion to Explosion: Why It’s Dangerous to Mine Sand Near Streams and Pipelines
I use the word “rape” in a metaphorical context. I am not alleging any illegal acts by mining companies, though I suspect there may be some going on here in terms of illegal discharges. Can you count the leaks?
Is the West Fork naturally sandy? Yes. That’s a true statement. Is it unnaturally sandy, too? Is sand mining contributing to the loss of Lake Houston capacity? Does it contribute to flooding though massive sediment plugs such as the mouth bar? You be the judge.
From I-69 to I-45 in 72 Photos
The sequence of images below starts at I-69 and goes northwest just past I-45. The first image is at the confluence of the West Fork and Spring Creek. Note the difference between the color of the two. The West Fork splits off to the left. It’s the Lake Houston tributary with virtually all the mines. Below, a small sampling of the destruction that occurs every day in the name of construction…out of sight and out of mind.
I apologize in advance if some of the photos seem repetitive. It’s important to understand how much of the West Fork that mines consume.
Warning: this post contains many photos. WIFI connection, patience, and large screen advised.
Posted by Bob Rehak on 11/3/2019
796 Days since Hurricane Harvey
The thoughts expressed in this post represent my opinions on matters of public policy. They are protected by the First Amendment of the US Constitution and the Anti-SLAPP Statute of the state of Texas.
https://i0.wp.com/reduceflooding.com/wp-content/uploads/2019/11/EF-WF-Aerial_668.jpg?fit=1500%2C1000&ssl=110001500adminadmin2019-11-03 18:02:242019-11-03 18:35:06Rape of the West Fork: A Photo Essay