I have made two major changes to ReduceFlooding.com by adding a new page dedicated to “Funding” and removing the “High Rise” page from the menu.
High-Rise Issue No Longer Topical, Funding Is
Funding is a hot topic at the moment and the high-rise battle is over…at least for now. Even though I removed the high-rise page from the menu, I did not delete it. Historical researchers can still find it by searching for “High Rise.” If the topic becomes active in the future, I will restore it to the menu again.
The Funding page is broken into two parts. The left contains a summary of the equity debate and how it has evolved in the last three years. It also contains links to the volumes of data obtained from Harris County via Freedom-of-Information-Act requests, as well as statistical analysis of the data. The right part contains links to every related post published since the equity debate started.
Collecting all information related to funding in one place should make it easy for people to find information about their watersheds and where their money is going.
The thoughts expressed in this post represent opinions on matters of public concern and safety. They are protected by the First Amendment of the US Constitution and the Anti-SLAPP Statute of the Great State of Texas.
https://i0.wp.com/reduceflooding.com/wp-content/uploads/2021/07/Screen-Shot-2021-07-29-at-5.57.05-PM.png?fit=762%2C404&ssl=1404762adminadmin2021-07-29 17:58:302021-07-29 18:00:29Changes to ReduceFlooding: New “Funding” Page
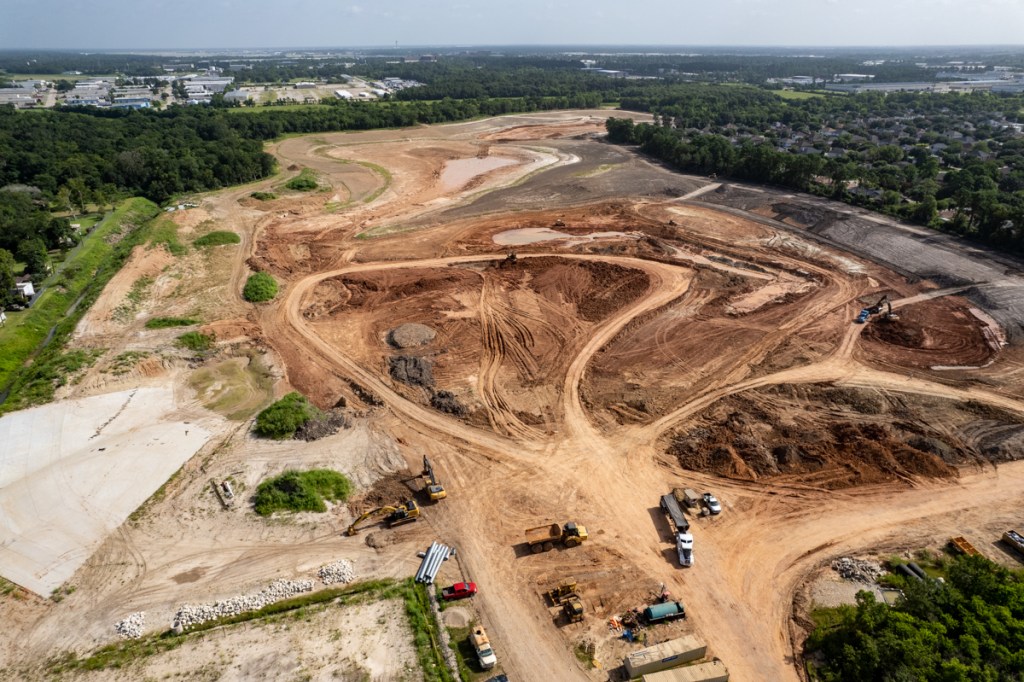
By the time Phases I and II are complete, the detention ponds will hold 1,600 acre-feet of of stormwater. That’s enough to hold a foot of rain falling across two and a half square miles.
According to HCFCD’s website, construction on Phase I should finish by the end of this year. Phase II should start next year. The two projects have a combined budget of $38.5 million.
If you don’t believe the Flood Control District website, check out Google Earth, or the satellite views in Google Maps and Apple Maps. This project is so big, you can see it from outer space.
Satellite image from Google Earth taken on 11/16/2000. Phase I construction has advanced considerably since then. See below.
The following photos were all taken on Sunday, 7/25/2021, around noon.
HCFCD Lauder Detention Basin Phase I. Looking north across Lauder towards Greens Bayou in background and Bush Intercontinental Airport in distance.NE corner of HCFCD Phase I Lauder Detention Basin, looking east towards JFK Blvd, just south of Greens Bayou.Looking south from over Greens Bayou toward Lauder and the Aldine ISD Mead Middle School in distance.HCFCD Lauder Detention Basin on Greens Bayou. Excavation is now focusing on the pond closest to Lauder in the distance.When I last photographed this basin in April, the area for that last pond was being cleared.Phase II will be built in the wooded area beyond the current Phase I construction.
Still Don’t Believe the Project Exists?
Think the photos are some kind of Photoshop trick? Visit the site yourself. Construction is bustling. On Sunday, around noon, I watched dozens of trucks coming and going while I took the photos above. Here’s how to get there.
Lauder Detention Basin location
Counterfeiting the Currency of Communication
The bizarre thing about this project is that the politicians who say it doesn’t exist are the ones who funded it. Go figure. Such is the sad, sorry state of politics in America today.
I’ve even talked to professors, professional engineers, MBAs, and PhDs in engineering who claim this and similar projects in Halls and Greens Watersheds don’t exist!
Worse yet, they refuse to look at the pictures, go to the construction site, review Flood Control’s website, or trust audited county spending data.
Language is the currency of communication. It’s how we cooperate. How we get things done. It’s one thing to disagree over project priorities. But another to claim projects don’t even exist when they do.
As a consequence, public policy has become divorced from reality. This is worse than being duped by misinformation. It’s the unwillingness of people, even including some journalists, to review available information that helps the public make informed decisions. And it doesn’t bode well for your region.
Posted by Bob Rehak on 7/28/2021
1427 Days since Hurricane Harvey
https://i0.wp.com/reduceflooding.com/wp-content/uploads/2021/07/20210724-DJI_0232.jpg?fit=1200%2C799&ssl=17991200adminadmin2021-07-26 22:35:482021-07-26 23:42:17Lauder Basin: Another Flood-Mitigation Project that Doesn’t Exist According to Some
Last in an eight part series on flood-mitigation funding in Harris County
For two years, Precinct 1 Commissioner Rodney Ellis and Precinct 2 Commissioner Adrian Garcia have alleged that rich watersheds get all the flood-mitigation funding, while poor and minority watersheds get none. But data suggests that is far from the truth.
Three months ago, the din from Ellis and Garcia reached a crescendo. I became so alarmed about the allegations of racism in flood-mitigation funding, that I submitted a Freedom of Information Act (FOIA) Request to Harris County Flood Control District (HCFCD) for historical funding data by watershed. I also requested related data such as watershed size, damaged structures, the number of low-to-moderate-income (LMI) residents, and more.
Data Contradicts Ellis/Garcia Narrative
My analysis contradicted the carefully crafted Ellis/Garcia narrative. I found the exact opposite of what they claimed.
The most dollars flow to low-income watersheds which, coincidentally, have the most flood damage.
The strongest correlation I found with flood-mitigation “funding” since 2000 was “damaged structures.” And the percentage of low-to-moderate income residents in a neighborhood correlates very strongly to damage per square mile.
When you think about this, it makes sense. We put the most flood-control dollars in areas that flood the most.
Damage Per-Square Mile Correlates Highly with LMI %
To understand patterns in the data, one must start by evaluating damage “per square mile.” That’s because high- and low-income watersheds differ radically in size and number.
Harris County has only eight low-to-moderate income watersheds, but 15-high income watersheds.
The low-income watersheds are half the total size – 600 square miles vs. 1176 square miles.
When looking at damage on a per square mile basis, the highest concentrations occur in low-income neighborhoods.
LMI percentage and damaged structures per square mile have a 0.82 coefficient of correlation. Mathematicians consider that very strong. 1.0 is the highest you can get, a perfect correlation.
Damage includes structures flooded in four major storms since 2000 (Allison, Tax Day, Memorial Day and Harvey).
Low-income watersheds cluster on the left and high-income watersheds on the right because of “Damage,” not racial discrimination in mitigation funding. Mitigation dollars already overwhelming flow to minority and low-income neighborhoods as they have for decades.
Flood-Control Dollars Flow to Damage
There’s also a strong relationship between total funding and total damage. Notice how the shape of the curves align closely with a few exceptions.
Total funding since 2000 and the number of damaged structures show a 0.84 coefficient of correlation. Mathematicians consider that very strong.
You can see a general downward trend in both blue and orange, indicating a strong correlation. This relationship supports other statistical analyses in this series. (See links to previous articles listed below.)
At the highest level, when you look at the data from multiple perspectives, one thing stands out:
Dollars flow to damage, not affluent watersheds.
Possible Causal Links Between LMI Percentage, Damage and Funding
Touring lower income watersheds by car or helicopter helps explain why those watersheds have so much more damage and consequently receive so much more funding. In general, they:
Are much more densely packed with buildings, a consequence of more than twice the population density (3,900 residents/square mile compared to 1,600).
Have more impervious cover, so water can’t soak in as quickly or as much
Have many clogged roadside ditches and storm drains, due to poor maintenance by county precinct crews and the City of Houston’s Public Works Department. (Water has a hard time getting out of neighborhoods.)
Have more structures per acre.
Re: the last point, in Kashmere Gardens (an LMI neighborhood), I found six homes on a third of an acre worth more than my house on a full acre in Kingwood. The density can offset higher home values in suburban neighborhoods when calculating Benefit/Cost Ratios for FEMA or HUD.
Flood-Mitigation Funding by Watershed Since 2000
Here’s how much money each watershed received for capital improvement projects since 2000. No maintenance dollars or dollars committed to complete projects are included – only dollars “out the door” as of the end of March 2021.
The graph above dramatizes two things:
The wide variation from high to low. Luce Bayou received only $4.5 million while Brays received $510 million. That’s 113 to 1.
A few watersheds received multiples of the average and median, while far more received a small fraction.
Funding Data Disproves Racist Allegations
Remember that the next time you hear the allegations of racial discrimination from Ellis and Garcia. This discussion shouldn’t be about race. It should be about fixing flooding problems.
The government is not funding flood-control projects in rich areas that didn’t experience flood damage. It funds them in areas that had the MOST damage. Those just happen to be in minority and low-income neighborhoods. And it is critical that people focus on WHY those structures flooded if we are to find solutions.
Implying that they flooded because of racial bias is misdirection. The racial allegations divide and distract people. They also keep HCFCD, from focusing on real solutions to our flooding problems. That harms all voters in Harris County.
If commissioners continue to focus on race, it will prove they care more about political gamesmanship than fixing drainage.
The thoughts expressed in this post represent opinions on matters of public concern and safety. They are protected by the First Amendment of the US Constitution and the Anti-SLAPP Statute of the Great State of Texas.
https://i0.wp.com/reduceflooding.com/wp-content/uploads/2021/06/LMI-v-Funding-Per-Sq-Mi.jpg?fit=1200%2C713&ssl=17131200adminadmin2021-06-28 13:24:492021-11-18 15:37:54Flood-Mitigation Funding Flows to Damage, Not High-Income Neighborhoods
Seventh in a series of eight articles on flood-mitigation funding in Harris County.
For the last two years, I’ve heard the same tirades in Commissioners’ Court – that rich neighborhood’s get all the flood-mitigation money while the poor neighborhoods get none. According to Commissioners Ellis and Garcia, that’s because higher home values in rich neighborhoods generate higher Benefit/Cost Ratios and therefore get more FEMA grants. Problem is, FEMA looks at many other factors. And HUD grants favor low-income neighborhoods. But you never hear Ellis or Garcia talk about those.
In reality, most flood mitigation-money in Harris County goes to watersheds with high percentages of low-income residents. (See links to previous posts below.)
By focusing on a narrow part of the flood-mitigation funding process as opposed to outcomes, Ellis and Garcia have been looking though the wrong end of the telescope. Why? To focus attention on the wrong end of the drainpipe!
In the most flooded parts of Halls and Greens watersheds, street after street has clogged ditch drains. Responsibility for cleaning those drains falls onto, you guessed it, Ellis and Garcia, along with their counterpart at the City of Houston, Mayor Sylvester Turner.
Simple FOIA Request Disproves Narrative
The Ellis/Garcia narrative just didn’t sound right to me. So I submitted a Freedom-of-Information-Act (FOIA) request to the Harris County Flood Control District in March for historical funding data. I wanted to see if the allegations were true. They’re not.
Analysis shows that the Ellis/Garcia narrative is 180-degrees from the truth. By almost any statistical measure, flood-mitigation spending favors the poorer watersheds in Harris County. That’s where most of the damage is.
Surely Commissioners Ellis and Garcia can’t be oblivious to more than a billion dollars of construction benefitting their own precincts.
Verbal Sleight of Hand Deflects Attention from Who’s Responsible
So, what’s going on here? Why the constant barrage of racial accusations and divisive rhetoric?
In my opinion, the deception, omissions and distortions of fact are about misdirection.
They seem designed to deflect attention from those responsible for a crucial part of the problem: street drainage.
And if you don’t fix that, you will never solve flooding no matter how much money you throw at channel widening, detention ponds and green solutions.
A process engineer in the oil and gas industry once told me, “There’s always a bottleneck in every system somewhere.” And one of the biggest issues in neighborhoods that flood repetitively is street drainage. Water can’t get out of the neighborhoods to the bayous.
Poor Ditch Maintenance Contributes to Street Flooding
By alleging racism in the HCFCD funding, Commissioners Ellis and Garcia are deflecting attention from a serious issue; many of the neighborhoods in their jurisdictions have awful internal drainage (streets and storm sewers) that contribute to frequent street flooding. Street flooding happens when high rainfall rates exceed the capacity of storm drains and ditches to carry the water away. The reduced capacity of the ditches below makes the streets flood on smaller rains.
Swale filled with sediment, almost totally blocking drain on Kashmere Street between Octavia and Engleford in Kashmere Gardens.City of Houston’s maintenance responsibility.
Ignacio Vasquez has lived in Kashmere Gardens for 45 years. He says he has called 311 about blocked drains like this one on Engleford St. “thousands of times”, but they never get fixed.City of Houston’s maintenance responsibility.
Vasquez says that after a heavy rain, this drain backs water up throughout his neighborhood and contributes to flooding. He says it can take up to 3-4 days for water to drain away. Completely unprompted, he then said that Kingwood was getting all the help from the City. I told him that I lived in Kingwood and that our drains were just as bad as his. See below.
Drainage swale on Valley Manor Drive in Kingwood is completely filled in. City of Houston’s maintenance responsibility.
But I digress. Here are some more street drainage photos taken on 6/26/21 in Halls and Greens Bayou Watersheds as well as Kashmere Gardens on the southeast corner of US59 and Loop 610.
Wherever I drove for five hours, residents repeatedly told me that because of poor maintenance, water has a hard time getting out of neighborhoods. It must either sink in or evaporate. See below.
Amboy and OctaviaStreets. City of Houston’s maintenance responsibility.
On Octavia just east of Amboy St.City of Houston’s maintenance responsibility.
Etheline St. near Korenek St.Harris County Precinct 1’s maintenance responsibility.Octavia St. near Kashmere Street. City of Houston’s maintenance responsibility.
To be fair, not all the ditches were this bad. But I saw thousands like these on hundreds of streets while driving around for five hours. Sometimes sediment almost completely covered drains. I often had hard times spotting the pipes.
On north side of Laura Koppe just east of Arkansas Street.Harris County Precinct 2’s maintenance responsibility.On Kowis Street a few hundred feet east of the Hardy Tollroad. Harris County Precinct 2’s maintenance responsibility.
The saddest sight I saw all day was this home on Etheline Street between Homestead and US59.
Note the mold and rotting exterior. Also note how close to street level this home is.Harris County Precinct 1’s maintenance responsibility.
Red circle shows location of drain completely blocked by sediment.Harris County Precinct 1’s maintenance responsibility.
Sixteen more representative shots in Harris County Precinct 1, Precinct 2 and City.
With drainage this bad, water may evaporate or infiltrate faster than it flows out of neighborhoods!
Who is Responsible for Streets and Storm Sewers?
Who is responsible for clearing blockages like these? Not the Harris County Flood Control District.
Inside the City of Houston, it is the Houston Public Works Department and a mayor who has been sued for diverting drainage fees.
Who is responsible for the unincorporated areas of Harris County? The Precincts. And the worst drainage happens in Precincts One and Two with Commissioners Ellis and Garcia.
Why does Kashmere Gardens (in the City) have open ditch drainage that hasn’t been maintained in years?
How do areas in East Aldine still have barely functional roadside ditches and residents who do not have municipal water and sewer service?
Commissioners Ellis and Garcia have the power and the money to address these issues. Yet they have chosen not to. Why have they not helped the very people they claim are left behind?
Show Us the Data
It is important to note the questions NOT being asked in this so-called “equity” debate.
How much has the City of Houston invested in these flood-damaged areas to remediate drainage?
How much have Precincts 1 and 2 invested?
What drainage projects have they completed since 2000?
What is the capital improvement plan for each precinct, and how much of that includes drainage improvements?
What is the equity prioritization framework for precinct spending?
How much unspent money does each precinct have for infrastructure?
The answers may point right back at the people making racial accusations.
The City and Commissioners Ellis and Garcia need to provide answers. Let’s see the data. How much have the City and the Precincts spent in these areas? If these areas are underserved, Commissioners Ellis and Garcia, and Mayor Turner are responsible.
They have claimed transparency is important to them. The time to prove that is now.
Blaming the problems on racial discrimination is an easy sell in minority neighborhoods. But it’s misdirection and it keeps the spotlight off Commissioners.
And it diverts focus from finding solutions to the real problems that contribute to flooding. For that, many people need look no further than the end of their driveways.
We all need to step back and look at flooding from end to end. Then maybe we’ll make life easier for the most vulnerable people among us.
The thoughts expressed in this post represent opinions on matters of public concern and safety. They are protected by the First Amendment of the US Constitution and the Anti-SLAPP Statute of the Great State of Texas.
https://i0.wp.com/reduceflooding.com/wp-content/uploads/2021/06/20210626-RJR_8673.jpg?fit=1200%2C800&ssl=18001200adminadmin2021-06-27 12:35:382022-01-03 15:25:38Looking Through the Wrong End of the Drainpipe: The Politics of Misdirection
Location of six six high-income watersheds used in the same analysis
Voter turnout for the 2018 Harris County flood-bond referendum
Damage from Harvey
Ironically, low-income watersheds had the lowest turnout for the 2018 flood-bond referendum and they’re getting the vast majority of flood mitigation funding.
Previous articles in this series have shown that, out of 23 watersheds in Harris County, six low-income watersheds:
The low-income watersheds are all located primarily inside the Beltway.
Most of Greens Bayou is inside Beltway 8, though a portion of it wanders just outside.
Location of Watersheds with Highest Income
Now let’s look at the location of the six high-income watersheds.
High-income watersheds are all outside the beltway.
Who Approved that $2.5 Billion Flood Bond?
Now look at the voter turnout map below from the 2018 flood bond referendum.
Light areas had the lowest voter turnout.
Dark areas had the highest voter turnout.
Note the area inside the yellow outline. It contains all the watersheds that Commissioners Ellis and Garcia complain about the most as having the least funding: Greens, Halls, Hunting, White Oak and Sims.
To see turnout in both absolute numbers and percentages in individual precincts, go to the interactive version of this map. Click on the visual above or here.
Some precincts in those watersheds had 0 voters. That’s right. No one showed up at the polls. At all. Many precincts had less than 1% turnout. Those light tan-colored areas generally had 1-5%.
The darkest areas, such as those around Kingwood, had turnout in the 20 to 30% range – generally 5-20 times higher than in the neighborhoods where most of the money is going.
Compare damage in Harvey (below) with the area outlined in yellow in the map above.
When you consider these four maps together with the historical funding data discussed in previous posts (see links below), they show that most of the money is already going where most of the damage was.
But large pockets of damage exist elsewhere that get comparatively little to no funding.
For instance, in the map above, note the curving arc of damage along Cypress Creek in the northern part of the county which extends into the Humble/Kingwood area.
People in those damaged areas turned out in high percentages for the flood bond. But they are seeing the vast majority of flood-mitigation projects being built in neighborhoods that didn’t even bother to vote in many cases. That doesn’t bode well for future bonds referendums.
Misleading Statements Undermine Trust in Government and Future
Some political leaders are telling poor people that flood-mitigation projects are all going to rich neighborhoods and the Houston Chronicle blindly repeats what they say without checking the real numbers. Or even bothering to mention projects already completed.
Twitter feed of Chronicle writer who wrote the article above.
But as I’ve shown in previous articles (see links below), depending on how you measure it, up to three quarters of the money is actually flowing to poor neighborhoods.
Funding in six highest and lowest income quartiles.
Funding in six low income watersheds compared to 15 higher income watersheds
Yet poor people believe all the money is going to rich watersheds – because that’s what their leaders tell them. And rich people see the lion’s share of the money going in the opposite direction.
Everyone believes someone else is getting the funding. So who would vote for another flood bond at this point? No one.
How are you going to convince people that taxed themselves $2.5 billion – and think they aren’t receiving any benefit from it – to vote for the next bond?
We need to restore trust in government by giving people accurate information, not misleading them with racial rhetoric for political gain. More on that tomorrow.
The thoughts expressed in this post represent opinions on matters of public concern and safety. They are protected by the First Amendment of the US Constitution and the Anti-SLAPP Statute of the Great State of Texas.
https://i0.wp.com/reduceflooding.com/wp-content/uploads/2021/06/Voting-Map-W-Legend-and-Outline-Small.jpg?fit=1200%2C599&ssl=15991200adminadmin2021-06-26 10:05:322021-06-26 12:34:20Watersheds with Low Voter Turnout Get Most Flood-Mitigation Funding
Fifth in a series of eight articles on flood-mitigation funding in Harris County
On June 11, Russ Poppe, executive director of the Harris County Flood Control District, resigned after two years of hounding by Commissioners Rodney Ellis and Adrian Garcia over the distribution of flood-bond money. Ellis and Garcia kept pushing Poppe to accelerate flood-mitigation projects in minority/low-income neighborhoods, using racial “equity” as the justification. But the discussion should be about damage, not race.
Alleged “Back-of-the-Bus” Treatment
Ellis was particularly vocal. He described Halls and Greens Bayous as getting “back-of-the-bus” treatment. With Shakespearean flare, he would rub his bald head and perfectly frame himself in front of aggressive artwork that says “Pay,” “We are fed up,” and “No Way.” Then he would lean into his camera and pronounce, “They flood every time.” If we don’t fix that, “We’ll have blood on our hands.”
Precinct One Commissioner Rodney Ellis during the Feb. 9, 2021, Commissioners Court Meeting.
But there was also a Shakespearean irony to Ellis’ monthly melodrama. As the posts in this series have shown…
Those minority, low-income neighborhoods have received the vast majority of flood-control district funding since 2000.
Narrow Questions Lead Viewers to Wrong Conclusion
This is a manufactured melodrama, born from a lie, and then exploited for political gain. Ellis even sweeps up community groups and flood survivors into his monthly melodrama. He would trot them out in meeting after meeting to anecdotally embellish his narrative, as he grilled Poppe like a prosecutor.
“Russ Poppe, is it not true? Did you not tell me that FEMA evaluates flood control projects with a benefit/cost ratio?”
Poppe would respond, “Yes, Commissioner.”
Ellis continued to ask pointed questions that demanded yes or no answers and could only lead to the conclusion he wanted. “Are the home values in Kingwood higher than around Halls Bayou?”
“Yes, Commissioner.”
“Would that not raise Kingwood’s benefit/cost ratio?”
“Yes, Commissioner.”
You get the idea. Ellis would focus on a narrow sliver of truth that bolstered his narrative of discrimination. Basically, it was a story of systemic racism – that the white man built the system to favor white men. He led listeners to conclude that areas like Kingwood got all the flood mitigation money, and that poor black and Hispanic neighborhoods got none.
However, Ellis had viewers looking through the wrong end of the telescope. He focused them on process, not outcomes. Had he bothered to check the facts, he would have found two problems:
Kingwood has NEVER received a Harris County Flood Control District Capital Improvement Project.
Halls’/Greens’ Funding vs. Kingwood’s as of March 31, 2021.
Benefit/Cost Ratios Factor in Far More than Home Value
The federal grant-funding process includes dozens of other factors besides home values. And when you combine them all, watersheds such as Greens, Brays, and Sims came away with benefit cost ratios as high as 6 or 7, while areas like Kingwood struggled to get above 1. The Flood Control District’s Federal Briefing document shows the benefit-cost ratios for all Federal Projects. See for yourself.
Percentage of low-to-moderate income residents in an area
Number of structures that can be removed from the floodplain by a project.
When you look at outcomes, instead of one small part of the process, you see that poorer, inner-city watersheds get the vast majority of funding in Harris County.
Dollars Flow to Damage
The two tables below compare actual flood-mitigation funding since 2000 in high and low quartiles when ranked by “damaged structures” in four major storms: Allison, Tax Day, Memorial Day, and Harvey. The last column ranks watersheds by LMI%. That’s the percentage of low-to-moderate-income residents with less-than-average income for the region. Halls has the highest LMI rank of any watershed – 71%, making it the lowest income watershed.
Capital improvement funds; includes no maintenance dollars. Listing omits Vince. It lies almost wholly within Pasadena and is the City’s responsibility.Omits Little Cypress Creek, which includes the Flood Control District’s experimental “frontier program.”
In comparing these two groups, several things become clear:
Dollars flow to damage.
Damage happens primarily in low-income watersheds.
Low-income watersheds received a billion more than the high-income (low LMI%) watersheds
Low-income watersheds averaged 3X more dollars
The median for low-income watersheds was 4X higher.
Stats Show No Racial Bias in Distribution of Flood-Mitigation Funding
Harris County does not discriminate against minority, low-income groups in the allocation of flood-mitigation funds. Dollars flow to damage. Of all the factors I examined, flood-mitigation funding most closely tracked damage. That’s a logical, valid basis for distribution of funding.
The most money went to the watersheds with the highest damage. They just also happened to be watersheds with high percentages of minority and low-income residents.
The discussion should be about flood damage, not race.
The real factors that contribute to flooding have become lost in the racially charged rhetoric. The sooner we lose the racial rhetoric, the easier it will be to address flooding.
The real factors that contribute to flooding become apparent when you look at the maps below. They correspond to the tables above.
Watersheds with the most damage lie mostly inside Beltway 8.
Watersheds with the least damage all lie outside Beltway 8.
Low Income Watersheds
All mostly inside Beltway. Part of Greens skirts north side of Beltway
Higher Income Watersheds
All outside Beltway
Neighborhoods inside the Beltway:
Are older
Were developed decades ago, with lower drainage standards
Have more structures built in floodplains and closer (lower) to street level
Have structures built right up to the edges of ditches and streams
Are downstream from newer areas, often in other counties that don’t mandate detention ponds
Are more densely populated, and thus have higher percentages of impervious cover
Two giant detention ponds straddle I-69 along Halls Bayou. Before HCFCD could build these ponds, they had to buy out the areas circled in red.
The sooner we can focus this discussion on issues such as these, the sooner we will solve our flooding problems. Polluting the discussion with antagonizing, racial rhetoric will only delay solutions and drive off more good people like Russ Poppe. Poppe’s only “sin” was that he was appointed in 2016, a year when Republicans controlled Commissioner’s Court. So, he became an easy target, like so many other department heads before him.
The thoughts expressed in this post represent opinions on matters of public concern and safety. They are protected by the First Amendment of the US Constitution and the Anti-SLAPP Statute of the Great State of Texas.
https://i0.wp.com/reduceflooding.com/wp-content/uploads/2021/06/20210209-Screen-Shot-2021-02-09-at-5.16.24-PM.jpg?fit=1200%2C669&ssl=16691200adminadmin2021-06-25 06:49:082022-06-27 21:09:23Racial Rhetoric Distracts from Focus on Real Solutions to Flooding Problems. Here is Why.
Fourth in a series of eight on flood-mitigation funding in Harris County
Since 2019, Commissioners Ellis and Garcia have harped on the need for more “equity” in flood-mitigation funding. They and some residents in their precincts allege that all the money is going to high-income watersheds while minority, low-income watersheds get “none.” Ellis repeatedly complains that Harris County Flood Control District gives those minority neighborhoods “back-of-the-bus” treatment. Garcia says he feels like he was “hit with a baseball bat.”
Unfounded Allegations of Racism in Construction Funding
In March, I became so alarmed at the allegations of racism, that I submitted a Freedom of Information Act Request to see if they were true. They aren’t. Funding data for new construction projects dating back to 2000 shows that:
Those first three articles in this series should suffice to disprove discrimination against minority, low-income watersheds. But more statistics just keep jumping out of the data.
So, today let’s compare watersheds with percentages of low-to-moderate-income (LMI) residents above and below 50%:
The low-income group has 7 watersheds, comprising 584 square miles.
The high-income group has 14 watersheds, comprising 1123 square miles.
The two groups vary radically in number and geographic size. So, to provide a valid comparison, we must evaluate them first on a per-square-mile basis. This pie chart shows how the smaller, low-income group gets triple the dollars per square mile.
On a per-square-mile basis, low-income watersheds (blue) have received 3X more capital improvement funding than high-income.
Watersheds Above/Below 50% LMI
Here are the percentages of LMI residents in each group.
Shows proportion of low-to-moderate-income residents in each watershed. Those with higher percentages actually have lower average income. So to avoid confusion, I refer to these groups as low- and high-income.
Lower Income Watersheds Get 3X More Construction Funding Per Square Mile
On a per-square mile basis, the low-income group averaged $2.5 million. The high-income group averaged only $0.8 million. See Table 2 below.
Includes dollars for funding of construction projects (not maintenance) since 2000.Remember: ABOVE 50% LMI actually means BELOW AVERGE INCOME.
When looking at funding per square mile, the low-income group averaged 3X more.
Smaller, Low-Income Group Also Receives About a Third More in Total Dollars
Comparing the total dollars (not $/square mile) received between the two groups is also illuminating.
In total dollars, the low-income group of 7 received $400 million dollars more than the high-income group of 14 since 2000. That skewed the averages back toward 3X again. See Table 3.
The small low-income group received a third more funding in total dollars since 2000. And the average per watershed was 2.6X higher than the high-income group.
But More Damage in Low-Income Group
As we have seen elsewhere in this series, dollars flow to damage. Low-income watersheds had twice the total damage despite being half the size and number.
In four major storms since 2000 (Allison, Tax Day, Memorial Day and Harvey), the seven low-income neighborhoods had 146,832 structures damaged, compared to 70,719 for the higher income group of 14. However, on a per square mile basis, low-income group had four times as much (251 vs. 63).
Structures damaged in four major storms in the groups of watersheds listed above in Table 1. Note that these averages can conceal wide variations within groups. Cypress Creek, for instance, had 20 times more damage than several other watersheds in its group.
Together with other data in previous posts, this proves HCFCD does not discriminate against minority low-income neighborhoods in flood-mitigation spending.
Dollars flow to damage – not affluent communities.
Low-income watersheds still have ongoing HCFCD construction for flood mitigation projects. But they also have other large problems that contribute to flooding for which HCFCD is not responsible. I’m talking about issues related to street flooding such as:
Aging storm sewers with low capacity built to old development standards
Roadside drainage swales filled with sediment
Homes not elevated enough above street level
Other people and groups are responsible for fixing such problems – including the City of Houston and Harris County Precinct Commissioners themselves.
In conclusion, elected representatives have misled Harris County residents. This raises the question, “Why?” I will discuss my opinion in a future post.
*Vince Bayou omitted from the first group because it lies almost wholly within the City of Pasadena and is the City’s responsibility. Little Cypress Creek also omitted from second group because it is a newly developing area. Very few people live there and that skews statistical comparisons. HCFCD spending in Little Cypress relates to an experimental “frontier program.”
https://i0.wp.com/reduceflooding.com/wp-content/uploads/2021/06/Screen-Shot-2021-06-24-at-7.44.08-AM.png?fit=1112%2C340&ssl=13401112adminadmin2021-06-24 09:56:492021-06-24 10:05:34Low-Income Watersheds Get Three Times More Flood-Mitigation Funding Per Square Mile
The 2019 Federal Briefing (page 56) separates Brays improvements into two areas:
Upstream (west of Sam Houston Tollway)
3 detention basins: 595 surface acres; 9,623 acre-feet of storage – enough to hold a foot of water falling over 15 square miles (13% of entire watershed)
3.7 miles of channel conveyance improvements, including control structures, from Old Westheimer Rd. to SH 6
Downstream (east of Sam Houston Tollway)
17.5 miles of channel conveyance improvements from the mouth to Fondren Rd.
1 detention basin: 252 surface acres; 1,865 acre-feet of storage – enough to hold a foot of water falling over 3 square miles
30 bridge replacements/modifications, and/or channel conveyance improvements under bridges (16 due for completion this year)
Harris County Flood Control District (HCFCD) manages, designs, and builds the projects; buys land, easements, rights-of-way; relocates utilities; adjusts bridges (except for railroads); and operates and maintains the channel after construction.
Benefits and Costs
After completion, upstream improvements should give residents a 100-yr. level of flood protection (1% annual chance).
Likewise, downstream improvements should reduce the number of structures:
In the 4% or 25-year flood plain from 3,520 to 50.
In the 100-year flood plain from 16,800 to 1,800.
Total Cost Estimate: $480M though 2019 (Source: 2019 HCFCD Federal Briefing, Page 45)
Benefit-Cost Ratio: 7.0 (Source: 2019 HCFCD Federal Briefing, Page 56)
The size of the cost in conjunction with the benefit-cost ratio makes these numbers impressive. The primary requirement for the ratio is that it exceeds 1.0, i.e., that the benefits exceed the costs.
Brays’ watershed includes 114 square miles. That makes the cost per square mile a whopping $4.4 million throughout the watershed. However, one must also consider that the population of Brays is the largest of any watershed in Harris County – more than 700,000 of which (57.5%) qualifies as low-to-moderate income.
The map below, taken from a 2020 HCFCD grant application to the US Department of Housing and Urban Development (HUD), shows the distribution of income throughout the watershed. Areas such as West University and the Medical Center in the middle (blue) rank higher in income than areas east and west (tan/red).
LMI quartiles within Brays Bayou Watershedas of 2020.Source: HCFCD HUD grant application.
Possible Reasons for Large Investment
You could justify this extraordinary level of investment any number of ways. By the:
Large population
High population density
High benefit/cost ratio
Protection of critical infrastructure, such as the Texas Medical Center
Number of homes and businesses flooded historically – also the largest in Harris County: 32,194 structures since Allison (Source: 2019 Federal Briefing: Pages 16-21)
Length of time projects have been in the pipeline (most before Harvey and some even before Allison)
Proximity to older, central part of county
Do not underestimate the last two points. Funding for many flood-mitigation projects can take decades.
Disproven Theories
Regardless of the reasons why Brays has received so much investment, one can also look at what this example does not show. It does not support the “equity” narrative propounded by some. That narrative asserts low-to-moderate-income neighborhoods receive less flood-mitigation funding because of lower home values compared to more affluent neighborhoods. Those affluent neighborhoods theoretically get more flood-mitigation funding because they allegedly support higher benefit-cost ratios (BCRs).
Home Value Alone Does Not Determine Benefit/Cost Ratio
The 7.0 BCR in Brays proves that low-to-moderate income neighborhoods are not automatically disadvantaged. Population density can offset lower property values. A whole apartment complex can sit on the same amount of land as one suburban home, yet the apartments would have higher value.
Direct Physical Damages to Buildings, Contents and Inventory
Essential Facility and Critical Infrastructure Serivce Loss
Human Impacts
Economic Losses
Environmental Benefits
Provisioning Services
Regulating Services
Supporting Services
Cultural Services
Social Benefits
Recreational Benefits
Health Benefits
Aesthetic Benefits
Economic Revitalization
Brays Watershed Investment Not Suffering From Discrimination
The Brays watershed cuts across racial, ethnic and socio-economic boundaries. Flooding has been recognized as a problem here for decades and HCFCD has successfully obtained many grants during that time. HCFCD has also invested more in Brays than any other watershed. Like Halls Bayou and Greens Bayou, the narrative re: Brays is far more complex than some acknowledge.
Photos of Improvements in Bray’s Bayou Watershed
On May 26, I flew from Beltway 8 West to the Ship Canal east of downtown along Brays Bayou. Out of more than 1100 images, here are 16 that represent what you see along the way. Lots of detention ponds, channel improvements, and new bridges. The bridges are higher and often wider, with wider supports to avoid constrictions and blockages. New bridges never have more than two supports in the water flow; some old ones had seven.
Arthur Storey Park at Beltway 8 West and Bellaire Blvd. Looking N toward Westchase District.
Southern part of same park. Looking NE across BW8 West.
Looking NNE at Hilcroft and North Braeswood Blvd.
Looking WSW across same new bridgeat Hillcroft.Note wide spans and wings designed to prevent erosion.
Looking north at new bridge over Brays at Chimney Rock
SW Corner of Loop 610 looking toward downtown in upper right.
Same intersection south of Galleria area. Note complexity where seven streams of traffic intersect.
Looking east toward downtown along Brays just inside of Loop 610 at detention pond. Note sewage treatment plant across bayou.
Looking north across new bridge over Brays along Buffalo Speedway toward Greenway Plaza in background.
Looking NE toward downtown in background along Main Street. Medical Center is in middle of frame.
Looking NE toward downtown where Fannin St. crosses Brays at UT Health Science Center.
Looking NE toward Med Center and downtown in background across another new bridge over Brays. Note the electrical infrastructure next to the bayou.
288 and Brays. Bridge construction on Almeda.
New Bridge over Brays at South 75th.
Looking NE across Brays at new railroad bridge near Tipps Street.
Downstream end of Brays near Buffalo Bayou. The ship canal and Port of Houston are in background.
As these pictures show, flood mitigation funding isn’t all about home value. Brays traverses some of Houston’s most critical infrastructure, job centers, rail lines, diverse neighborhoods and employment centers.
https://i0.wp.com/reduceflooding.com/wp-content/uploads/2021/06/20210520-RJR_6999.jpg?fit=1200%2C800&ssl=18001200adminadmin2021-06-03 10:53:512021-08-24 15:07:33Brays Bayou Received Approximately Half Billion in Flood Mitigation Funding In Last 23 Years
Tuesday, Harris County Commissioners Court voted 5-0 to transfer $315 million of toll road revenue, unallocated County road bonds and other county funds to accelerate the construction of certain flood-bond mitigation projects. They will allocate the funds to mitigation projects using the 2018 Flood Bond Prioritization Criteria.
The transfer will provide backstop funding for 100% of the projects in the Road & Bridge Subdivision Drainage Program of the 2018 Flood Control Bond Program, removing the risk that partner-funding shortfalls prevent projects from being completed.
Text of Motion
The final language as amended and approved reads as follows:
Create a new funding facility of $115 million, made up of County road bonds or HCTRA surplus revenue, to free up Flood Control bond capacity currently used for the Subdivision Program. The Flood Control bond capacity will be allocated by utilizing the 2018 Flood Bond prioritization criteria.
Create an additional funding facility of $200 million, comprised of HCTRA surplus revenue or other County resources, to support completion of projects that are part of the 2018 bond program with the required transportation nexus.
The Subdivision Program consists of 91 projects which, according to HCFCD estimates, reduce the risk of flooding to more than 45,000 homes.
Background
The projects benefit neighborhoods with outdated drainage infrastructure or which never had modern drainage systems in the first place. Furthermore, multiple projects are located in watersheds that have been historically disadvantaged in securing federal funds for flood control. According to the Office of the County Engineer, the Subdivision Program has a current estimated total cost of $535 million (or ~$590 million including an approximately 10% contingency).
Among the objectives:
Provide backstop funding for partnership projects in case grants don’t materialize or are delayed beyond a reasonable time
Let projects with mature or advanced partner funding opportunities pursue those opportunities for a defined (but not unlimited) period of time..
The background sheet contains a list of eligible projects in each precinct. Any Subdivision Program project costs that have not received a notice or award of partner funding by August 31, 2021, would be eligible to receive additional money from the backstop funding.
Discussion
Discussion on the motion and amendment lasted about an hour. It became clear that commissioners believe they:
Must complete all projects in the bond.
Expect not to find partnership funds for some projects, leaving those projects underfunded.
Need more money.
Must use diverted funds on flood projects that have some connection to transportation, i.e., problems created by new highway construction.
This approval will remove a cloud of uncertainty from projects that rely on partnership funding which has not yet materializedfor some projects.
Including projects from all four precincts helped ensure a unanimous vote.
Another Bond? Not So Fast
Commissioners talked about the possibility of another flood-bond offering. However, the likelihood of that passing is slim. Poor people feel the money is going to affluent neighborhoods and affluent people feel the money is going to poor neighborhoods. If no one is happy with the way the current bond money has been handled, why would anyone vote to approve more?
Flood Control will try to collapse a ten-year timeline down to five years.
It’s unclear at this time how today’s development will affect HUD grants in the pipeline, the interest costs on borrowed money, or the availability of qualified contractors.
Posted by Bob Rehak on 4/28/2021
1338 Days since Hurricane Harvey
https://i0.wp.com/reduceflooding.com/wp-content/uploads/2021/04/20210303-RJR_6475.jpg?fit=1200%2C800&ssl=18001200adminadmin2021-04-27 22:07:242021-07-29 16:21:50Harris County Commissioners Supplement Flood-Bond Funds with Highway Money to Accelerate Mitigation
In the March 30, 2021 Harris County Commissioner’s Court Meeting, Harris County Flood Control District (HCFCD) gave a Flood Bond update. Here’s where projects in the 2018 Flood Bond program stand.
Accept 25 grants totaling approximately $960 million with Bond funds providing around $259 million in local matching funds
Execute 326 engineering agreements totaling $241 million
Award 39 construction agreements totaling $296 million
Procure 19 staff augmentation agreements providing 113 contract staff members
Acquire nearly 340 properties at a value over $208 million for construction projects, floodplain preservation, and wetland mitigation banks
Make $115 million available to the Office of the County Engineer to manage and construct drainage improvements in nearly 100 subdivisions across Harris County
Conduct 140 community engagement meetings with over 11,413 attendees
Complete nearly 630 home buyouts at a value over $130 million with over 680 additional in process for a buyout (since Hurricane Harvey)
Complete over $125 million repair program to address damages to District infrastructure caused by Hurricane Harvey
19 Projects Completed, 372 Underway
The flood bond update shows that of the 19 projects completed so far, investigations, analyses and studies comprised 15.
Altogether there are 372 individual HCFCD projects in progress related to the Bond Program. The table below shows the stages of those projects.
88% of all projects identified in the flood bond are currently underway and at some state of completion.
Only 21 Projects Not Yet Started
Only 21 Bond projects have not yet started. They are all in the fourth quartile of the bond prioritization framework and will begin between July 2021 and March 2022. Of those, two are in the San Jacinto watershed: CI-61 (East Fork, West Fork, and Lake Houston Dredging) and F-15 (General Drainage Improvements near Atascocita).
Dredging included a $10 million match with estimated partner funds of $40 million.
FEMA/Army Corps, TWDB and City of Houston funds have covered dredging in the river to date.
Status of Lake Houston Area Projects
Other projects in the Lake Houston Area at least partially underway.
Luce Bayou and Huffman
Project underway include right-of-way acquisition, design and construction of general drainage improvements in the Luce Bayou Watershed and near Huffman (total $20 million). Luce Bayou right-of-way acquisition and floodplain preservation ($10 million) has also started.
Gates on Lake Houston Dam
Design and construction of additional gates on Lake Houston ($20 million) is nearing completion of the design phase. The City of Houston has taken the lead on that project but has made no announcements on it recently.
Other Projects Lake Houston Area Partially Underway
The San Jacinto Watershed Study ($625,000)
Funding for future partnership projects based on the SJR watershed study ($18.75 million)
Investigation of potential detention sites around the Glendale Dredge site in Partnership with the City of Houston ($50,000)
Conveyance improvements along Panther Creek ($10 million)
General drainage improvements east of Lake Houston ($10 million)
General Drainage Improvements near Kingwood ($10 million)
One Third of Projects Now Past Design Phase
One third of all projects have already begin work outside.
Ellis Not Content with 40% of Construction Going into Two Bayous in His Precinct
40% of all projects under construction are in Greens and Halls Bayou Watersheds, the two Precinct One Commissioner Rodney Ellis cares most about. He wants to slow down projects in other areas to focus more on projects in his area.
For a discussion of how the meeting went, check back tomorrow.
https://i0.wp.com/reduceflooding.com/wp-content/uploads/2021/03/Screen-Shot-2021-03-30-at-6.47.59-PM-e1617154465150.png?fit=1200%2C740&ssl=17401200adminadmin2021-03-30 20:32:292021-07-29 16:23:44HCFCD Issues Flood Bond Update as of March 30, 2021