Worse than Harvey, Libyan Flood Kills Thousands

4PM Tuesday 9/12/2023 – A Libyan flood in Derna (also spelled Darnah) killed thousands and authorities say more than 10,000 are missing.

At this hour, exact numbers are hard to come by as large areas are still cut off from rescue workers and reporters. But to put those estimates in perspective, Harvey killed 36 in Harris County.

The Cause: Months of Rain Fall in Day

Torrential rains from Mediterranean storm Daniel burst two dams, wiped out four bridges and flooded large areas of Derna. The flash floods swept homes, bodies and vehicles into the sea while knocking out communications in large parts of the area.

Daniel dumped months of rain in one day on a large swath of northern Libya.

Libya is normally one of the driest countries in the world. The Sahara dominates most of the country’s climate. But the Mediterranean also influences rainfall along the northern coast.

Wikipedia says the annual rainfall in Derna is around 11 inches. But CNN reported that in Derna, eight months worth of rain fell in one day.

In Al Bayda, about 50 miles west, Libya’s National Meteorological Centre said that 16 inches of rain fell between 10 Sep 8am and 11 Sep 8am, a new rainfall record.

Weather Spark shows that average precipitation in Derna during September amounts to less than an inch. And even in the wettest years, Derna receives at most 4 inches per month.

Average September Rainfall in Darnah equals .2 inches, Courtesy of Weather Spark.

Weather Spark also indicates that Derna receives rainfall on less than one day in an average September.

Terrain Funneled Floodwater Toward City

Derna lies along the coast of the Mediterranean Sea, at the end of a long, narrow, natural valley, called a wadi, which is dry for much of the year.

New York Times image compiled from Google Earth

As the city was inundated by Daniel, which made landfall in Libya on Sunday night, the wadi funneled rushing water into the center of the city. Riverbanks swelled, bridges were washed out and two dams farther up the wadi burst, adding their waters to the deluge.

Tropical-like storms rarely happen in the Mediterranean, but they do happen occasionally. And when they do, meteorologists call them “Medicanes,” short for Mediterranean hurricanes.

World and Social Media Focus on Flood

YouTube is awash in videos from the Derna flood.

NBC reported that a quarter of the city of 125,000 people was destroyed.

This CBS story shows pictures of the incredible destruction. This flood didn’t invade homes slowly, but leave them standing. It pummeled homes and whole neighborhoods.

Google “flood Derna Libya” to find hundreds of links and the latest news. Stories are being updated almost hourly.

Parallels With Harvey

Perusing many of those stories revealed several parallels with Hurricane Harvey which struck the Houston area in 2017.

Rainfall Records

Both areas encountered record rainfalls. Harvey dumped far more rain than Daniel. But then Daniel’s rainfall fell over a much drier area where infrastructure was designed to handle smaller amounts. Still, both were records, and both overwhelmed local infrastructure with unexpectedly high volumes.

Dam Concerns

Both Houston and Derna lay downstream from dams. During Harvey, the SJRA cited fear of failure of the Lake Conroe Dam as the reason for its massive release. In Derna, the dams just failed.

Lack of Warning

During Harvey, downstream residents received no warning that Lake Conroe would open its massive floodgates. Many stepped out of bed in the middle of the night to find themselves in knee deep water. CNN reported that there was no warning that the Derna dams could fail and no order to evacuate. Many who tried to evacuate found themselves cut off by collapsed bridges, washed out roads, and rising water, just as in Houston.

Lack of Maintenance

Aljazeera indicated that lack of maintenance may have played a role in the Derna disaster. The dams that failed hadn’t been maintained for years, even though severe erosion had been reported in scientific journals for more than a decade. Likewise, deferred maintenance played a role in flooding the Lake Houston Area during Harvey. During the drought in 2011, the water level in Lake Houston fell so low that the City of Houston could have removed sediment with dump trucks instead of dredges. But Mayor Anise Parker refused to do so. The accumulated sediment later wound up blocking the San Jacinto West Fork and contributing to the flooding of thousands of homes in the Humble/Kingwood area.

Enforcement of Building Codes

In Libya, political turmoil since 2011 reportedly distracted government from the mundane task of enforcing building codes. As a consequence, many hastily constructed buildings went up without adequate safeguards or supervision, and were swept away during the flood. Sound familiar?

Learning from Disasters

We should learn from the past and others’ mistakes. I wonder how many other communities have been surprised by:

  • Record rainfalls
  • Dam failures or unexpectedly high dam releases
  • Warning systems that failed and left people with no time or way to evacuate
  • Impacts of deferred maintenance
  • Lax enforcement of building codes

I hope the world learns the lessons of the Derna disaster so that we can compare them to other floods and get smarter about mitigation measures that make a difference.

Posted by Bob Rehak on 9/12/2023

2205 Days since Hurricane Harvey

Earth Grows Eyeballs

We have two tropical systems in the Atlantic this morning – Hurricane Lee and Tropical Storm Margo which is projected to intensify into a hurricane by tomorrow.

I love looking at the satellite imagery of earth on the National Hurricane Center website. It lets you verify all the complex descriptions of weather developments. And this morning when I went to look at the satellite imagery of the full Atlantic, I was startled by what appeared to be a pair of eyeballs staring back at me, perfectly centered in the sunrise.

And the cloud formations below them loosely resembled a nose and a frown.

Frankly, it looked a bit spooky to me. A cosmic coincidence? But one that triggered thoughts of Halloween a little more than a month away.

Please share with your kids and grandkids. This could be an interesting way to teach them to keep their eyes on the weather.

Posted by Bob Rehak on 9/11/2023

2204 Days since Hurricane Harvey

Peak of Hurricane Season is Today!

Today, September 10 is the statistical peak of hurricane season.

NOAA calculates the peak by looking at the number of storms per day in the last hundred years. And September 10th takes the prize with approximately 95 named storms. That’s almost one per year on this date. You would have about a 5% chance of NOT having a named storm in the Atlantic Basin on September 10th, according to this data.

peak of hurricane season

And true to form, today, the Atlantic has two named storms, Lee and Margot, as I write this. However, neither is anywhere near the Caribbean or Gulf of Mexico.

NOAA hasn’t really been collecting hurricane data back 100 years. The chart above is based on 77 years of data, but “normalized” to 100 years to make the frame of reference more intuitive.

The 77-year period extends from 1944 to 2020, starting at the beginning of the aircraft reconnaissance era.

So Far This Year Vs. Average Season

Usually, by September 9, we’ve had eight named storms in the Atlantic Basin. That would be the H storm. However, this year, we’re already on the M storm. That puts us five storms ahead of the average year.

But wait! This year we also had a bonus storm in January. Only after re-analysis did the National Hurricane Center realize that it should have named the storm. But it didn’t. So, we’re really six storms ahead of the average season so far. And that’s far above the average.

Only two named storms in the Gulf so far this year. Neither has come close to Houston.

The chart above is updated monthly and does not include the two named storms now in the Atlantic.

Forecast vs. Actual to Date

So, at the mid-point, how does this season compare to predictions? If the second half of the season is anything like the first, we could easily have more named storms and more major hurricanes than predicted by NOAA in its August 10 seasonal update.

Earlier this year, forecasters increased their predictions from a normal season to an above normal season. They predicted 14-21 named storms (winds of 39 mph or greater). We’ve already had 14.

Of those, NOAA said 6-11 could become hurricanes (winds of 74 mph or greater). We’ve had 4 so far (Don, Franklin, Idalia and Lee).

And of those, forecasters said 2-5 could become major hurricanes (winds of 111 mph or greater). We’ve had 3 of those so far (Franklin, Idalia and Lee). Franklin and Idalia reached Category 4 strength. Lee briefly exploded into a Cat 5.

Forecasters have linked storm intensity to sea surface temperatures. When average storms hit very warm waters, they can intensify quickly. And that is exactly what has happened this year.

Here’s a look at sea surface temperature anomalies (departure from normal) around the world.

Virtually everything between Africa and Houston is 1-3 degrees Celsius above normal (1.8 to 5.4 degrees Fahrenheit). Sea surface temperature data is current as of Sept. 9, 2023…just one day before the peak of hurricane season.

Posted by Bob Rehak on September 10, 2023 based on information from NHC.

2203 Days since Hurricane Harvey

Damn the Downstream Consequences, Colony Ridge Expansion Continues Relentlessly

Damn the downstream consequences, including sediment pollution, increased flood risk and monstrous dredging costs. Colony Ridge, the controversial 30+ square-mile, Liberty County development that markets to Hispanics – while flaunting drainage, environmental and fire regulations – is clearing and paving thousands of additional acres.

Not even Google Earth can keep up with the developer’s relentless expansion. On 8/12/23, I flew over Colony Ridge in a helicopter and found huge areas where 3-week-old satellite imagery was already hopelessly out of date.

Google Earth image from 7/18/23. Red/yellow highlighted areas changed radically within three weeks.


With the exception of areas protected by the Houston-Conroe and Tarkington Bayou Mitigation Banks, the highlighted areas above have largely been cleared and/or paved.

The RED area now has paving not visible in the satellite image. The YELLOW area was being cleared and paving was just starting even though the image shows none of that. So what do these areas look like from a few hundred feet?

Pictures Taken 8/12/23 over Red Area

I shot the four pictures below on 8/12/23. They represent dozens of others. The red area already has most streets, but no fire hydrants.

Pictures Taken over Yellow Area

The two pictures below show some of the development activity taking pace in the yellow area.

Looking west across newly cleared area.
Looking N at part of Colony Ridge expansion.

What kind of homes will go here? To predict the future, look to the past.

Homes on Parade

Colony Ridge is the world’s largest trailer park. One Plum Grove resident who lives near a northern entrance to Colony Ridge says she routinely sees up to seven mobile homes per day going into the development – seven days per week.

It’s hard to know exactly how many new homes arrive each day, because there are other entrances. But if you assume the max for this one entrance, 50 homes a week times 52 weeks makes up to 2600 homes per year.

Colony Ridge Expansion
Manufactured home making its way through the main commercial area of Colony Ridge.
Room with a viewof severe erosion.

Note the erosion in photos above and below. It will make its way downstream into the East Fork San Jacinto. These ditches are typical of Colony Ridge. The eroded sediment will reduce conveyance of the river and contribute to flooding.

Poverty: The Mother of Pollution

Ghandi once said, “Poverty is the mother of pollution.” That’s certainly the case here. But I would modify the saying. While poverty may be the mother of pollution; greed is the father.

The poverty of the residents doesn’t cause sediment pollution. But a business plan built on high-interest-rate, owner financing that targets impoverished people with few options does.

The developer seems to have found a target market that is less concerned with their environment than survival.

It’s a market ripe for exploitation where corners can be cut. Residents have few options and can’t complain.

And the developer shows little interest in changing a business model that fuels relentless expansion and growth. Damn the downstream consequences.

In virtually every area I have photographed, he has not planted vegetation on the banks of the channels. Nor has he used silt fences or installed backslope interceptor swales to reduce erosion as Liberty County regulations require.

Instead of the developer bearing those costs, downstream residents in the Lake Houston Area do. Since Harvey, the Army Corps, Harris County and City of Houston have spent more than $220 million of your tax dollars to dredge excess sediment shed from rivers of mud like this.

Colony Ridge drainage ditch.
Working drainage is a luxury.

The poverty in Colony Ridge is crushing. I’ve seen people sleeping in tents trying to save enough money to buy a camper to live in.

No bathroom in sight. Do Liberty County health codes really allow this?
Christmas dinner. Enlargement of this photo from Christmas 2020 shows food on the table in the foreground.
One small part of Colony Ridge. The market for a piece of the American dream stretches endlessly in Liberty County.

The estimated population of Colony Ridge is now greater than the three largest cities in Liberty County (Cleveland, Dayton, and Liberty) put together. No one knows what the population is with certainty because of the large number of undocumented aliens who did not participate in the last census.

And the Colony Ridge developer is expanding into Harris and Montgomery Counties. ReduceFlooding will monitor progress of those areas to see if they, too, contribute to sediment accumulation, dredging costs, and flooding.

Posted by Bob Rehak on 9/9/23

Posted by Bob Rehak 2202 Days since Hurricane Harvey

The thoughts expressed in this post represent opinions on matters of public concern and safety. They are protected by the First Amendment of the US Constitution and the Anti-SLAPP Statute of the Great State of Texas.

Woodridge Village Excavation Activity Almost Doubles

Compared to July, Woodridge Village excavation activity almost doubled in August.

As of close of business on September 6, 2023, Harris County Flood Control District (HCFCD) contractor Sprint Sand and Clay has excavated 146,104 cubic yards of material to expand the stormwater detention basin capacity on Woodridge Village.

At the end of July, Sprint had excavated 135, 751 cubic yards. That means the company excavated another 10, 353 cubic yards in August, or 6.4 acre feet.

And that brought the total excavated to date up to 361.6 acre feet, or 94% of the Atlas 14 requirement.

Stepping Up Stormwater Detention Capacity

When Perry Homes sold the site to HCFCD and City of Houston, the site had five detention basins totaling 271 acre feet. The new basin has the potential to more than double that volume.

Think of the expansion of Woodridge Village stormwater-detention-basin capacity in four stages:

  • The starting point, i.e., what the site had when purchased from Perry Homes.
  • An additional amount that Sprint has excavated to date.
  • The Atlas-14 requirement.
  • The contract max (500,000 cubic yards).

Here’s how the various stages look in a table.

Acre Feet of Stormwater Detention% of Atlas-14 Requirement% of Ultimate
Site Had When Purchased from Perry Homes27170%47%
Has as of 9/6/23361.694%62.3%
Atlas 14 Requires385100%66%
If Sprint Excavates All 500K Cubic Feet580150%100%
As of 9/6/23.

I based all calculations on original construction plans, HCFCD monthly reports, Atlas-14 Requirements and Sprint’s contract.

Photos Taken 9/7/2023

Here’s how Woodridge Village excavation activity looks on the ground.

The site was busier today last month. Trucks constantly shuttled in and out.
Looking NE across the new basin and the main part of Woodridge Village
Looking SW toward site entrance, Kingwood Park HS and Woodland Hills Drive
Main thrust of work during August appears to be toward the east.
An excavator loaded several trucks while I watched.

Outline of Excavation

Harris County Commissioners Court approved the contract with Sprint Sand and Clay on July 20, 2021. It obligates Sprint to remove at least 5,000 cubic yards per month. Excavation started on January 27, 2022. 

Woodridge Village Excavation and Removal
Sprint can take material wherever it wants, but must excavate from within the red boundary line.

Sprint will make only $1,000 from its Woodridge Village excavation contract with HCFCD, but will make its profit by selling the dirt at market rates. An engineer familiar with HCFCD operations estimates that if HCFCD had to pay market rates to have that 146,000 cubic yards moved, it would have cost taxpayers between $1.46 million and $2.9 million. He based those numbers on recent bids.

So, the Sprint contract is a good deal for taxpayers, but it carries some uncertainty with it.

If the demand for dirt dries up, excavation could slow or stop.

Next Steps

But simply excavating the dirt isn’t the end of the job. Harris County still needs to slope the sides, plant grass, and tie the new basin into the site’s existing stormwater-detention-basin network. 

HCFCD awarded the engineering project for all that to Halff, based on the company’s qualifications. HCFCD is currently negotiating the scope of the project with Halff.

At the current rate of excavation, Sprint could reach Atlas 14 requirements by the end of the year. But the contractor is still less than a third of the way through its contract maximum of 500,000 cubic yards.

Construction of Taylor Gully conveyance improvements cannot move forward until the appropriate stormwater mitigation on Woodridge Village is in place first. Only one thing is certain at this point. That could still be awhile.

But there is good news. In the meantime, the extra Woodridge Village detention basin capacity will go a long way toward reducing flood risk for people downstream.

Posted by Bob Rehak on 9/7/23

2200 Days since Hurricane Harvey

Upcoming HCFCD Projects Scarce in Precinct 3

On August 28, 2023, Harris County Flood Control District (HCFCD) published two lists of projects that it will advertise in the next year. The first contains upcoming HCFCD projects going out for construction bids. The second contains requests for qualifications and proposals (RFQs and RFPs) for engineering designs and studies.

Of the 50 total projects on the two lists, only one pertains to the Lake Houston Area, a request for qualifications (RFQ) on the Kingwood Diversion Ditch design.

Another is for Barrett Station Drainage Improvements, but Barrett Station is about 5 miles south of the Lake Houston dam near Highway 90 and FM2100.

There were no upcoming construction projects listed anywhere in the Kingwood/Lake Houston area.

In fact, only one construction project out of 24 even pertains to Precinct 3, a TC Jester stormwater detention basin.

Construction Projects Going Out for Bid

Virtually all projects on both lists pertain to precincts led by Democratic commissioners. Given how long it takes to get projects into construction, it could take years before the Kingwood Diversion Ditch project moves into construction.

Upcoming construction projects going out for bids in the next year.

It normally takes 3-4 months from the time HCFCD advertises a construction project before a shovel goes in the ground.

Engineering/Design Studies Being Advertised

From the time an engineering study goes out for bid, it normally takes 12-18 months until shovels turn, but the time can vary widely depending on the nature of the project. Here’s the most recent list of engineering jobs being advertised.

Upcoming engineering design projects, studies/surveys.

For printable lists of both types of projects in PDF format, click here.

Precinct 3 Commissioner Tom Ramsey also pointed out that he hopes to move forward with several Lake Houston Area drainage projects using his own budget, not HCFCD’s. So the picture isn’t quite as bleak as the lists above make it look. However, his team is not yet ready to talk about those projects.

What About Taylor Gully/Woodridge Village?

Enquiring minds will ask, “What happened to Taylor Gully, Woodridge Village and the Lake Houston Gates projects?”

The Taylor Gully and Woodridge Village engineering project(s) were previously advertised. “HCFCD awarded design to Halff based on qualifications,” said HCFCD spokesperson Beth Walters. “This effort will include both Taylor Gully and Woodridge, as the channel conveyance improvements on Taylor Gully cannot be constructed without having the appropriate stormwater mitigation in place first.”

Walters added, “We are currently negotiating scope items with Halff (the normal first step of the process once the consultant has been selected).”

After design completion, HCFCD will advertise for construction. Construction does not show up on these lists because it will be more than 12 months out.

Lake Houston Gates Being Handled by City of Houston

The City of Houston is handling the Lake Houston Gates project. So, it wouldn’t show up on the HCFCD lists either.

Mayor Pro Tem Dave Martin had this to say about the status of the gates project. “We are presently in ‘final design’ on the eleven gate structure, in the earthen embankment area, east of the existing Lake Houston Spillway Dam.”

New gates will go to the right of the existing gates in the earthen portion of the dam.

“Estimated start of construction, pending permits, environmental studies, etc. will be 2025 Q1 or Q2,” said Martin. “Our money from the 2023 State legislative session should arrive by December 2023. We also have money from the 2021 state legislature which they will allow us to reappropriate from dredging to the gates if necessary.”

Martin also pointed to two dredging projects handled by the City. Canal dredging in Huffman is already underway. And “Within the next 2-3 weeks, we will start a FEMA funded project, south of the West Fork mouth bar, near Atascocita Shores,”said Martin. “This will remove approximately one million additional yards of sediment.”

Posted by Bob Rehak on 9/6/2023

2199 Days since Hurricane Harvey

Here Come New Precipitation-Frequency Estimates…Again

NOAA’s new Atlas 15 precipitation-frequency estimates will soon replace recently introduced Atlas 14 estimates – even before the Atlas 14 estimates have been fully adopted and integrated into local regulations.

About Precipitation-Frequency Estimates

Engineers use precipitation-frequency estimates to design, plan and manage infrastructure under Federal, State and local regulations. For instance, to ensure homes are built X feet above the 100-year floodplain, engineers must “know” how much rain will fall in a 100-year storm. Predicting that is one of NOAA’s jobs.

However, haphazard adoption of the new estimates has created a patchwork quilt of regulations across Texas and the U.S. One of the dirty, little secrets in the flood mitigation business is that many jurisdictions fail to adopt the new estimates and update their regulations accordingly. It’s costly, time-consuming, and raises the bar for developers.

So, many jurisdictions continue to use lower estimates to help attract development.

But designing infrastructure around artificially low rainfall estimates can lead to insufficient mitigation that increases flood risk for everyone.

Some Estimates Now in Effect Go Back 60 Years

In 2018, NOAA introduced Atlas 14 precipitation-frequency estimates for Texas. They replaced earlier estimates published by NOAA as early as the 1960s. Some parts of the Houston region still use those earlier estimates today.

Atlas 14 estimates superseded those published in:

  1. Weather Bureau Technical Paper No. 40, Rainfall Frequency Atlas of the United States for Durations from 30 Minutes to 24 Hours and Return Periods from 1 to 100 Years (Hershfield, 1961)
  2. Weather Bureau Technical Paper No. 49, Two- to Ten-Day Precipitation for Return Periods of 2 to 100 Years in the Contiguous United States (Miller, 1964).

Newest Estimates Will Incorporate Climate Change

Compared to those, Atlas 14 estimates are more accurate. They incorporate data from newer technologies and more data collected over longer periods. Atlas 14 totals increased 30-40% for the Lake Houston Area.

The Atlas 15 estimates are just getting underway and have not yet been developed. NOAA expects to release them in 2027.

Atlas-15 timeline by NOAA

NOAA claims its Atlas-15 update will improve precipitation-frequency estimates by leveraging non-stationary climate estimates. Previous estimates, such as Atlas 14, have assumed a stationary climate.

In statistics, “non-stationary” means the underlying environment changes, say due to some strong trend or seasonality. Many people believe climate is changing and hence the desire to build that into the new precipitation-frequency estimates.

National Funding, New Updates Every 10 Years

Historically, NOAA precipitation-frequency estimates have been funded by states and other users, on a cost-reimbursable basis. However, that is changing.

Moving forward, the Federal government will fund precipitation-frequency updates. Under the Floods Act, signed into law in December 2022, NOAA will update precipitation-frequency estimates every 10 years.

Goals include:

  • Updating standards
  • Incorporating climate change
  • For the entire country.

Voluntary, Local Participation

But there’s a dirty little secret that not many people know about. Nothing forces individual cities, counties or states to adopt the estimates and work them into their regulations.

That’s a big job. And an expensive one. So, not all jurisdictions do it. Many areas surrounding Houston still plan infrastructure using data developed 60 years ago.

If you plan on less rain, channels can be narrower and stormwater-detention basins smaller. But residents are not protected as much as they should be.

Posted by Bob Rehak on 9/5/2023 based on information from NOAA.

2198 Days since Hurricane Harvey

Texas Ranks #2 in States with Most Flood Damage

It’s easy to forget flooding in the middle of a drought. But we should never forget that Texas ranks #2 in states with the most flood damage. This and other statistics below demonstrate why we shouldn’t become complacent.

Debris pile from Imelda flood in Elm Grove Village (Kingwood).

Different Measures, Similar Rankings

Many ways exist to rank flood-prone areas and Texas ranks high on most of them.

  • National Flood Insurance Plan (NFIP) payouts? Texas ranks #2 after Louisiana between 1978-2021.
  • Most hurricanes? Out of the 300 hurricanes that made landfall in the US since 1851, Texas ranks #2 after Florida with 66 hitting the Lone Star state – 22% of the U.S. total.
  • Percentage of state’s total population living in floodplains? Texas ties for 10th according to a 2017 study. But a 2023 TWDB study shows that 20% of Texans now live in floodplains; that would tie us for 3rd if nothing else changed.
  • Most disaster declarations? Texas ranks #2 when considering all types.
  • Flood deaths? Texas ranks #1. Two hundred people died between 2010 and 2022. Over a longer period of time, 1959-2014, the state had over 850 flood deaths.
  • More Texans live in floodplains (one in five) than the entire populations of 30 other states.

Harris County Ranking

As bad as the Texas statistics are, Harris County’s are even worse.

Between 1978 and 2021, Harris County led all counties in the the entire country for NFIP claims filed (171,300), about 44% of the total claims for all of Texas.

Moreover, 42% of all Texans living in floodplains live in the San Jacinto watershed. The number of floodplain dwellers in the San Jacinto watershed alone exceeds the population of 15 states and the District of Columbia.

A Big Target

It’s important to look at many different measures, because no one measure conveys the full picture. For instance:

  • Number of hurricanes also reflects miles of subtropical shoreline.
  • The sheer size and population of Texas make it rank high on many measures. Said another way, we are a big target.
  • The high clay content of our soils discourages infiltration and encourages runoff of rainfall.
  • Dollar losses may depend as much as on affluence or population density in floodplains as the severity of flooding.
  • Dollar losses in Texas also reflect old building codes in many locations.

And then there’s the huge number of mobile homes in Texas. They are notoriously susceptible to high winds, like those often associated with hurricanes.

Their placement also makes them more vulnerable to flooding than other types of housing. A study by Headwaters Economics found that one in seven mobile homes is located in an area with high flood risk, compared to one in 10 for all other housing types.

Texas, a Leader in…

Texas leads the nation in many things: oil, gas, cotton, job creation, economic expansion and more. Unfortunately, we’re also a leader in flooding.

Better land-use and building codes could certainly help reduce the flooding. But will the state’s new flood plan recommend that? The focus seems to be on flood mitigation more than flood prevention.

The San Jacinto Regional Flood Planning Group recommended $46 billion worth of studies and mitigation projects in its regional plan. And the San Jacinto is just one of 15 watersheds in the state!

In sharp contrast to the magnitude of mitigation needs, the legislature voted only approximately $1 billion for flood prevention projects this year.

That’s enough to make a dent in the state’s budget, but not the problem. Perhaps we need to re-examine our priorities.

Posted by Bob Rehak on September 4, 2023, Labor Day

2197 Days since Hurricane Harvey


Factors that Affect Flood Risk and How to Assess Them

When looking at buying property, your flood risk depends on at least ten factors. Unfortunately, people rarely consider most of them. Even if they do, they may not now how to assess them.

Harvey Flood. Photo by Sally Geis.

So, here’s a list of key factors that can increase or decrease your flood risk. I’ve also included examples and ways to explore their impact on your property or the property you’re considering buying:

  1. Geography and Topography: The natural landscape of an area plays a significant role in its flood susceptibility. Flat, low-lying areas, river valleys, coastal regions, and areas near lakes or other bodies of water are more prone to flooding because water naturally collects in these locations. To investigate a particular area, check out resources such as the USGS National Map and FEMA’s National Flood Hazard Layer Viewer.
  2. Proximity to Water Bodies: Areas near rivers, lakes, oceans, and other water bodies are at a higher risk of flooding. Riverine flooding, coastal flooding, and flash flooding can all occur in these regions. See any map or web sites such as RiskFactor.com.
  3. Rainfall and Precipitation Patterns: Areas that receive heavy or prolonged rainfall are more likely to experience flooding. Rainfall can lead to flash floods, riverine flooding, and urban flooding when drainage systems are overwhelmed. In Texas, generally the farther east and closer to the coast you go, the more rainfall increases. To see the likelihood of precipitation in any given area, check out NOAA’s Atlas-14 site then investigate local infrastructure standards to see if they meet Atlas-14 standards or something less (prior). Also understand that NOAA is revising Atlas-14 already to incorporate impacts of climate change (see Atlas-15).
  4. Climate and Weather Events: Areas prone to hurricanes, tropical storms, or other severe weather events are at risk of storm surges, heavy rainfall, and coastal flooding. Here are several sites that can help you find reliable climate data.
  5. Soil Type and Saturation: The type of soil in an area can impact its flood susceptibility. Soils with poor drainage or soils that are already saturated from previous rain events are more likely to contribute to flooding. Here’s a USDA national soil survey and how to determine whether flood mitigation projects in any given area properly account for the soil types in that area.
  6. Human Development: Urbanization and land development can increase flood risk. Paved surfaces and buildings can reduce natural drainage and increase runoff, overwhelming drainage systems. Harris County has proposed minimum drainage standards for areas draining into Harris County, but not all surrounding areas have adopted these standards yet.
  7. Deforestation and Land Use Changes: Changes in land use, such as deforestation or the construction of roads and buildings, can alter natural water flow patterns and increase flood risk. Think you’re protected? Unfortunately for homeowners, many wetlands are now being destroyed. The EPA and Army Corps amended the definition of protected “waters of the United States” in light of the decision in Sackett v. EPA in May. It narrowed the scope of the Clean Water Act and the EPA’s power to regulate waterways and wetlands.
  8. Infrastructure and Drainage Systems: The condition and capacity of drainage systems, including stormwater sewers and levees, can affect an area’s flood vulnerability. Inadequate or poorly maintained infrastructure can lead to flooding. After Harvey, Harris County Flood Control embarked on an ambitious expansion of flood-mitigation infrastructure, but recently spending has fallen. More in some areas than others. So stay alert to what’s happening in your area.
  9. Historical Flooding: Areas with a history of flooding are often at continued risk, as past floods can indicate a region’s susceptibility to future events. In Harris County, MAAPnext provides an excellent series of historical flood maps to help you understand your flood risk.
  10. Land-Use Planning and Floodplain Management: Effective land-use planning, zoning regulations, and floodplain management can help mitigate flood risk by restricting construction in flood-prone areas and implementing flood control measures. There’s no zoning in Houston and little in surrounding areas. We do have floodplain management regulations. When purchasing property, always look upstream to see if those regulations are effectively enforced.

Few things affect a property’s value more dramatically than flooding.

Yet flood risk can change over time – for better or worse. So buyer beware. Or buyer be wet.

Posted by Bob Rehak on 9/3/2023 with some help from ChatGPT

2196 Days since Hurricane Harvey

The thoughts expressed in this post represent opinions on matters of public concern and safety. They are protected by the First Amendment of the US Constitution and the Anti-SLAPP Statute of the Great State of Texas.

New Design for Northpark Entry, Construction Schedule Update

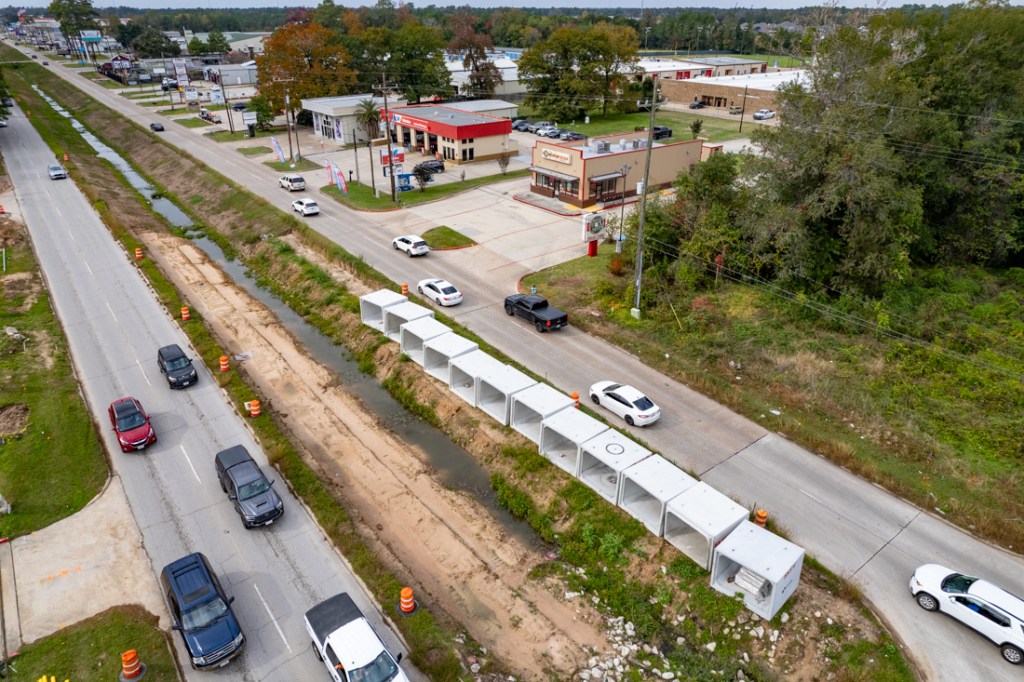
Harper Brothers Construction has encountered another unexpected problem in the Northpark Drive expansion project. While attempting to place 5’x7′ culvert in the median, it uncovered a water line much closer to the surface than it should have been. While developing a solution with the City of Houston, crews will continue to focus on other areas of the project so as not to create excessive delays.

Those areas include:

  • A new water main near 494 and the UP railroad tracks
  • Clearing land for the new Northpark entry to Kingwood at 59.

For background detail and photos, see below.

Pics of Water-Line Conflict

This week, Harper Brothers discovered a water main where it should not have been. The contractor proposed water-line workarounds to the City, but the City has not yet agreed to a solution. The issue has to do with a water main running under Northpark to the new Parkwood Baptist Church east of Russell-Palmer. See the pictures below, courtesy of the Lake Houston Redevelopment Authority (LHRA).

Surprise water line under Northpark
Workers discover a surprise. Water line under Northpark not where it was supposed to be.
Surprise water line under Northpark
Water line should have been buried several feet deeper.
Surprise water line under Northpark
One workaround could require burying a parallel line deep enough to allow placement of culvert over the top of it.

Harper Brothers Construction suggested another workaround – splicing in a U-shaped pipe that would leave enough room for the culvert it is burying in the median.

But until the City and LHRA agree on a solution Harper Brothers may have to skip past the obstruction and then go back at a later date to fill in the gap.

Second New Water Main Farther West

In the meantime, crews have already started prepping for placement of another water line that parallels Northpark closer to Loop 494. See picture below near Public Storage.

Looking SE. Note area being cleared in foreground for new water main and feeder roads next to bridge.

While Northpark will expand inward for most of its length, the feeder road next to the new bridge over 494 and the railroad tracks will expand outward. And because the City doesn’t like to run water mains under a roadway, contractors must also relocate this water main. It’s a much bigger job because it feeds numerous businesses, not just one church.

LHRA actually had to purchase additional land for this portion of the project – enough to accommodate a two-lane feeder road on each side of the bridge.

In the photo above, you can see Harper Brothers prepping land for the new water main and feeder lanes.

Plans for New Entry

The contractor will also soon start clearing the triangular area on the north side of Northpark at 59. Note construction materials stockpiled in the foreground of the photo below. Most, but not all of this area, will become a decorative pond that’s actually a stormwater detention basin in disguise. The pond will hold approximately 11 acre feet of stormwater in the space between the top of the permanent water level and ground level.

A second pond on the south side of Northpark will provide a similar amount of stormwater storage to compensate for the increase in impervious cover caused by road widening.

But not all the trees will go away. TxDoT requires that any trees removed must be replaced with trees of an identical diameter.

Site of first detention pond. Pond will be framed by trees that remain between Northpark and shopping center on right.
Some trees will be relocated to the open area currently behind the grove.

Other trees will be relocated nearby, for instance, around the south pond which is more sparsely populated with trees.

South pond will have more room for transplanted trees around it.

In addition, the ponds when complete will have sidewalks and landscaping around them. TxDoT, LHRA and the Kingwood Service Association worked collaboratively on the designs for two years. A well will serve the area and feed an irrigation system to help ensure new plantings survive and thrive.

Here’s what the finished ponds and landscaping should look like.

North pond (the first) shown on the left.

For the full entry landscaping plans, click here.

To see a video rendering of the ponds, click here and then click on the video in the lower right.

Clearing was to have begun on Tuesday morning after Labor Day. However, that may be delayed now. Late on Friday afternoon several logistical issues involved with relocating the trees became apparent.

CenterPoint Promises to Stake Out Problems Week of 9/3/23

Last week, we talked about 11 conflicts with CenterPoint along the Northpark Drive expansion project. CenterPoint has promised LHRA that it will send crews to “stake out” the problems next week. That is the first step in resolving conflicts.

Some of the CenterPoint conflicts that have culvert placement stalled.

It’s always something in construction! Stay tuned for next week’s exciting episode of “As Northpark Expands.”

For a look ahead at the next three weeks of construction activity, click here.

Posted by Bob Rehak on 9/2/23

2195 Days since Hurricane Harvey and 10 days before the peak of hurricane season