Good news: The Emergency West Fork Dredging Project is still active. The government allocated funds for the project before the shutdown. Also, because FEMA designated it an emergency, it enjoys preferred status. Dredges are still dredging.
Bad news: Every other Lake Houston area flood mitigation project that depends on federal dollars is on hold.
Watershed study? 10 months and still waiting for approval.
Additional gates for Lake Houston? Hit the pause button.
More upstream detention. Deep freeze.
Additional dredging? Why rush it?
The Really Bad News
I’d say that’s the end of the story, but it’s not. Tonight the Associated Press reports that President Trump warns the shutdown could continue for months or years. Even considering the obvious hyperbole, I shudder to think of employees’ reactions. At a certain point, people put families and futures in front of jobs that pay zero. Maybe Trump could hold out for years. But a GS-7 with a bachelor’s degree and student loans to pay off? Someone making $35K per year?
The reason most people take a pay cut to go into government service is because it’s a steady gig. But yank that paycheck out from under them. Woooooosh! That’s the sound of talent and institutional knowledge creating a vacuum as it sprints out the door.
Rebraining Projects
A prolonged government shutdown will turn the Mo down Low. Lose momentum and you have to spend more energy to regain it. You lose time. You lose money. You lose talent. And when it’s over, you have to rebrain projects. Recruitment. Training. Getting people back up to speed. Clearing out backlogs…that could really last years.
Sweating Details and Bullets
So while the mouth bar project is on hold, dredging behind the mouth bar continues. Officials hoped they could save $18 million in demobilization and remobilization fees by having the mouth bar project ready to start when the Emergency Project finished. But that window is rapidly narrowing. Back in October, when we thought we had six months to work out details, everyone felt comfy and confident. Now with three months left, officials are sweating the details while residents sweat bullets. Here’s why.
Problems Likely to Migrate Downstream
As I discussed in yesterday’s post, River Grove Park has experienced greater-than-usual flooding. Crests usually experienced every other year now happen once every other month. The river has crested over 50 feet six times in 11 months. That’s likely due to the backwater effect created by “Sand Island” (as dredgers have named it). Sand Island virtually blocks off the river creating a backwater effect. See its location relative to River Grove below.
The Army Corps has nicknamed the giant blockage immediately downstream from River Grove Park “Sand Island.”
The next picture shows how this massive dune virtually blocks the entire West Fork. I took the picture two weeks after Harvey. During floods, when water moves quickly, Sand Island has created a ten-foot difference between water upstream and downstream.
Sand Island causes higher-than-normal floods at greater -than -normal frequencies because of backwater effects.
Great Lakes Dredge and Dock, the Corps’ prime contractor on this job has finished dredging through the side bar at River Grove . Now they are attacking Sand Island (see below).
The focus of dredging has moved from the side bar at River Grove to Sand Island. Once removed, the flooding problems at River Grove will likely migrate downstream.
As they remove this blockage, downstream residents in Atascocita Point have reported water rising higher in their yards during floods. Once dredgers completely remove Sand Island, flooding problems will likely migrate downstream to the next major blockage, the mouth bar.
The mouth bar virtually blocks the West Fork where it enters Lake Houston. It stretches from Kings Point to Atascocita Point, but is not within the scope of the current dredging project. Expansion of the scope has been halted by the government shutdown.
However, there’s a big difference between Sand Island and the Mouth Bar.
Parks, vacant land, and golf courses surround Sand Island.
People, kids and homes surround the Mouth Bar.
Let’s pray that the government shutdown ends quickly. In this area, government can really make a huge and important difference – immediately.
Posted by Bob Rehak on 1/5/2019
494 Days since Hurricane Harvey
https://i0.wp.com/reduceflooding.com/wp-content/uploads/2019/01/Locator.jpg?fit=1500%2C1000&ssl=110001500adminadmin2019-01-05 03:25:172019-01-06 12:24:47How Government Shutdown Affects All Lake Houston Area Flood Mitigation Projects
Three months after supposedly reaching an agreement in principle to remove the mouth bar, FEMA, the Army Corps, the State and City still have no agreement in writing. From Day 1 of negotiations, FEMA and the Corps have consistently said they can’t address pre-Harvey conditions. I’m beginning to believe them. How did we reach this impasse and how can we move forward?
FEMA’s Dilemma
The Stafford Act (FEMA’s enabling legislation) prohibits FEMA from funding repairs not directly related to Harvey. But, because the City conducted no surveys after the Memorial or Tax Day Floods, it cannot prove how much came from Harvey. Yet it has asked FEMA and the Corps to remove the entire mouth bar.
The City’s Dilemma
The City of Houston has done little to maintain Lake Houston, especially the West Fork of the San Jacinto near Kingwood. Lack of regular surveys and maintenance dredging make city officials look like they’re trying to get others to clean up their mess.
Historical Perspective
Decades ago, after the 1994 flood, the City hired Brown & Root to study sedimentation in the lake, which includes about 13 miles of the East and West Forks of the San Jacinto. Engineers recommended surveying the river after every major storm and dredging when necessary to reduce the risk of flooding. They even pinpointed where sediment would likely build up and pointed out that the West Fork was capturing 42% of all the sediment coming into the lake (see page 9). However, before Harvey, the City never dredged and rarely conducted surveys – decisions that haunt us today.
The mouth bar. Sand, in part from the mines, has almost totally blocked the West Fork where it meets Lake Houston. Unofficial before/after measurements show that as much as ten feet was deposited in this area during Harvey (five below water/five above).
Sedimentation: Danger that Can No Longer Be Ignored
One insidious aspect of sedimentation is its invisibility. Like gunk in pipes, you can’t see it – until water backs up and floods your home. That’s exactly what happened to thousands of homes during Harvey. The problem which had slowly built up for years, went from sub-acute to critical almost overnight because of the massive volume of sediment deposited during Harvey.
That brings us to our present impasse.
No News is Bad News
The City, FEMA, the Army Corps and the State have argued about this for at least six months. We thought they reached agreement in principle to remove the mouth bar three months ago. But still no official announcements have been made. Sadly, it didn’t have to come to this:
If only the City had followed the advice of the experts it hired…
If only the City had maintained its property…
If only the City could document how much Harvey contributed to the blockage…
If only the City had acted years ago to limit sand mining in the floodway of the river…
…we could have been working on the mouth bar already. Instead…
Problem Becoming Demonstrably Worse
In the 80 years since we started keeping records on the West Fork at US59, the river has crested over 50 feet 40 times – once every other year. But in the last 11 months, floods have reached that height SIX times – more than once every other month. We topped 50 feet in the latest flood just minutes ago. All resulted from relatively minor rains. This sudden surge in frequency did not result from global warming.
Is it all a statistical fluke? Wetter than usual weather? El Niño? Upstream development? Perhaps some of each. But one would have to be blind to dismiss the sediment buildup in the river. A delta is marching steadily downstream, creating blockages that back water up.
The West Fork just before Kingwood’s annexation in 1996 and after Harvey. Comparison shows advancing sediment buildups blocking the river.
The High Cost of Ignoring Expert Advice and Routine Maintenance
Harvey brought the high cost of ignoring expert advice and routine maintenance into sharp focus. The lack of a survey that could have been conducted in a few days is costing the City months of delays and potentially tens of millions of dollars in State and Federal assistance. This exposes hundreds of thousands of residents to needless flood risk and undermines property values.
What Needs to Happen
All of this underscores the need to budget for and maintain one’s own property. Drainage fees, which we just put a lock box around, should easily handle the City’s portion of dredging projects and surveys.
How do we break this impasse?
FEMA and the Corps need to restore the conveyance of the river that existed before Harvey. Estimate it using available evidence like aerial photos and satellite images. We’ll never have an exact figure. So quit using that as an excuse to put hundreds of thousands of people at risk. Let’s get started with dredging what we can. Legally.
In return, the City could commit to annual river surveys that document the status of the river before each hurricane season.
I’m not a mediator and I’m not the Mayor, but that sounds like a fair compromise that can protect residents as well as officials on both sides of this negotiation.
Floods don’t happen as often as police or fire emergencies, but when they do, they affect hundreds of thousands of people in ways that can be just as life altering. This is a public safety issue. Let’s go. Reach an agreement, please!
These are my opinions on matters of public policy, protected by the First Amendment of the U.S. Constitution and the Anti-SLAPP statute of the Great State of Texas.
Posted by Bob Rehak on January 4, 2019
493 Days since Hurricane Harvey
https://i0.wp.com/reduceflooding.com/wp-content/uploads/2019/01/SideBySide.jpg?fit=1440%2C590&ssl=15901440adminadmin2019-01-04 00:14:212019-01-04 09:18:39Why the City Needs Regular River Surveys and Maintenance Dredging
Last night after posting the third flash flood warning in less than a month, several flood-weary people on FaceBook flashed back to Harvey. They questioned why the SJRA wasn’t releasing water in advance of the storm. I quickly went to SJRA.net and looked at their dashboard. They WERE releasing water. The discussion then morphed into another SJRA bloodletting, borne of fear and frustration over a month of near-continuous flood risk and a year and a half of expensive flood repairs.
I’m not here to defend the SJRA. But I suspected perception and reality were currently out of sync. So I emailed a reader’s comments to Jace Houston, general manager of the SJRA, and asked what they were doing to address his concerns.
Update from Jace Houston of SJRA on Recent Releases
Here is the response I got today. I’m reprinting it word for word.
“As you know, there’s a big information gap between what we do during storm events and what the public perceives. We’re working on some significant items to begin closing that gap.”
“We have an information piece that will go out this afternoon regarding the current rainfall event, but I thought I would mention a couple of items to you just in case you get more inquiries.”
“We’ve been releasing water non-stop since the December 7th rainfall. It takes quite a while to safely lower the lake after its risen a couple of feet above normal level. Obviously the level jumped back up from the Christmas rainfall. Releases went back up to around 7000 cfs, and we’re still at over 3000 cfs. Rainfall has been in the forecast pretty much constantly the last 30 days, so we’re in the mode of trying to safely move it out of the lake before the next storm hits.”
“The forecast for this event is not too bad. Approximately two to three inches across our watershed. We’re only a few inches over 201’, so we should be able to manage this one similarly to the Christmas event.”
Jeff Lindner of Harris County Flood Control issued this update re: current rains at 7 p.m. tonight:
“A band of heavy rainfall with rainfall rates of 1.0-1.5 inches per hour is moving NNE over much of Harris County currently extending along the US 59 corridor. HCFCD gages show rainfall amounts of .75-1.5 inches with this band in an hour or less and this will likely result in some street flooding. Rises on area watersheds are likely, but creeks and bayous will be able to handle this round of rainfall.”
“Additional activity to the SW will likely move into the county over the next few hours.”
Hope that helps! Stay tuned to the National Weather Service, NOAA or your favorite source of weather information.
Here are the latest predictions from NOAA for the area around US59 and rainfall in the last 24 hours for Harris County.
https://i0.wp.com/reduceflooding.com/wp-content/uploads/2019/01/hmmt2_hg.png?fit=600%2C465&ssl=1465600adminadmin2019-01-02 21:13:272019-01-02 21:13:34SJRA Has Released Water Continuously since December 7
The developer of a proposed new high-rise resort in Kingwood plans to develop the marina portion in an area that was once the riverbed of the San Jacinto west fork.
Aerial photos taken in 1943 clearly show the outline of an old meander about .4 miles north of the current riverbed.
1943 aerial photo. Note feint outline of old riverbed above the current river.
Google Earth lets users trace a path and then save it, like I have with this orange line.
Creating an outline of the path allows you to scroll forward in time within Google Earth (see image below).
Here is the same path superimposed over current conditions.
Plans call for marina high rises along orange path just north of lake below eastern edge of Barrington.The Marina would be developed in the old river bed of the San Jacinto.
Photo of proposed marina site next to River Grove Park. The giant sand bar in the foreground of this photo taken after Harvey has mostly been dredged by the Army Corps. However, it’s appearance almost overnight during Harvey contributed to the flooding of 650 homes above the drainage ditch (center left). Future development in this floodplain would likely make flooding worse.
Dangers of Building in Old Stream and Riverbeds
During major floods, water often follows these old streams and riverbeds. Many neighborhoods in Houston discovered this danger during Harvey. Former Harris County Judge Ed Emmett often questioned the wisdom of such developments because of their susceptibility to flooding – even after mitigation.
Here are two examples that show such developments encroaching on waterways and separating them from their floodplains. In the first example, the waterway was obliterated. In the second, White Oak Bayou, the waterway still exists. However, the flood plain has been developed. Despite mitigation efforts during development, the neighborhoods around White Oak Bayou have suffered severe and repeated flooding.
Why Do We Continue to Develop Flood Plains?
This brochure, Why We Continue to Develop Floodplains: Examining the Disincentives for Conservation in Federal Policy, is a must-read for anyone who wants to understand the financial logic behind developments like this one. A group called Earth Economics developed it. Zachary Christin, Project Director for Earth Economics, and Michael Kline, from the Vermont Department of Environmental Conservation, authored it with support from the Kresge Foundation. This report investigates whether current federal policy is structured to prevent future flood damage or if incentives lead to further floodplain development.
The basic premise may rub many Texans the wrong way, but you should still read it. “Flood risk management,” the authors argue, “seeks to enable communities to live nearby by controlling rivers with levee systems and other structures. This false sense of protection places families and infrastructure at risk in a climate that is changing beyond our capacity to maintain protections against its effects. Rather than attempting to control our country’s powerful rivers, we should instead control how and where we allow human activities.”
Confining streams, they argue, merely shifts flood risk downstream. The authors explore the benefits and the natural protective qualities of healthy, functional floodplains. They then discuss the causes of floodplain destruction and investigate the policies that further incentivize their development. Finally, they outline paths forward to create new floodplain policy. You may disagree with the premise. But it contains many powerful observations and statistics.
As always, these represent my opinions on matters of public policy. They are protected by the First Amendment of the U.S. Constitution and the Anti-SLAPP statute of the Great State of Texas.
Posted by Bob Rehak on January 2, 2019
491 Days since Hurricane Harvey
https://i0.wp.com/reduceflooding.com/wp-content/uploads/2019/01/AncientMeander.jpg?fit=1500%2C1023&ssl=110231500adminadmin2019-01-02 19:38:332019-01-13 12:36:05Developer Plans to Build High-Rise Resort in Old Riverbed
Flash flooding and flooding will be possible Wednesday into Thursday. A band of heavy rainfall may form Wednesday morning from College Station to Crockett and heavy rainfall may continue to occur through the day. Gulf moisture will also move into the area and cause additional rainfall mainly east of I-45.
Southeast Texas has already had rainfall the last seven days which will cause any additional rainfall to runoff. Isolated thunderstorms may cause brief heavy rainfall of 1 inch an hour. Overall areas in the watch may get 2 to 3 inches of rainfall with isolated bands of 4 inches.
Potential Flood Impacts
In urban areas, street flooding and flooding of underpasses and typical low lying areas can be be expected. Bayous and creeks may have rapid rises and could reach out of banks. Rural low lying areas, low water crossings and poor drainage areas may flood. Rises on area rivers can be expected and this could extend river flooding that is on going.
PRECAUTIONARY/PREPAREDNESS ACTIONS
A Flash Flood Watch means that conditions may develop that lead to flash flooding. Flash flooding is a very dangerous situation. You should monitor later forecasts and be prepared to take action should Flash Flood Warnings be issued.
Additional Guidance from Harris County Flood Control
Jeff Lindner, Harris County Flood Control’s meteorologist added this:
Widespread rainfall…some heavy…will lead to rises on area watersheds and potentially some flooding of creeks and rivers.
Upper level storm system is digging into the SW US and will impact the state for the next 24-36 hours.
As moisture increases from the SSW this evening, light rain and showers will develop and spread NNE into the area. A secondary front from roughly Lake Livingston to Columbus will likely remain stationary and be the focus for rainfall production tonight into early Wednesday in that region. Expect numerous showers and thunderstorms to develop by midday along the coast and inland south of the stalled inland front…this rainfall will likely become heavier in nature and slightly more convective with potentially higher rainfall rates. Upper level system will move across the area early Thursday with rains continuing before dry WNW winds sweep across the area in the afternoon ending rainfall.
Rainfall Amounts
Widespread rainfall of 2-3 inches looks likely over much of the area with isolated totals of 4-5 inches. Some fairly decent agreement in the models today with respect to two rainfall maximums over the area…the first over our NW/N counties tonight in Wednesday and then a second Wednesday afternoon into Thursday morning from Houston ENE toward Liberty and then NE toward Lake Livingston. WPC has expended the slight risk of excessive rainfall exceeding flash flood guidance to include a larger part of SE TX. Think maximum hourly rainfall rates will be on the order of .5 to 1.25 inches which most urban areas will be able to handle. Overall fairly long duration of rainfall over a fairly large area will lead to significant amounts of run-off especially into area river systems as well as the creeks in northern Harris County.
Flash Flood Guidance
Flash Flood Guidance for the area is between 3.0-4.4 inches for 6-hrs which seems high and a review of soil saturation levels via the NASA SPORT webpage shows saturation levels of 65-70% over much of the area…or you can walk in the yard and quickly tell that the ground is still very wet from the rainfall on Sunday. Think much of what falls is going to run-off given how wet the ground is and widespread amounts of dormant vegetation.
Several watersheds are still high from the rainfall last Thursday and rainfall of this magnitude will likely result in renewed rises on nearly all watersheds. Main concern will be the Trinity and San Jacinto basins, along with the Navasota and Brazos. In Harris County, significant rises on Spring, Cypress, Little Cypress, Willow, Cedar, and the creeks that feed into Addicks and Barker Reservoirs are likely. Will also include lower Greens (east of US 59) and Halls, Hunting. Some of these watersheds may rise to levels that would impact low lying areas and roadways near the creek or bayou.
Flooding Probable on East and West Forks
Flooding on both the East and West Forks of the San Jacinto River (low lands and streets) certainly looks probable. At this time the threat for significant creek and bayou flooding as well as any flooding of structures is low.
Current thinking is that watersheds will see similar responses to last Thursday morning…although a few may see higher levels since they will be starting at higher current flows versus last Thursday.
Think hourly rainfall rates will be low enough to prevent widespread street flooding, but street flooding in areas of poor drainage and in rural areas where roadside ditches or small creeks spill onto the roadway will be possible.
Posted by Bob Rehak on 1/1/2019
480 Days Since Hurricane Harvey
https://i0.wp.com/reduceflooding.com/wp-content/uploads/2019/01/Balcom_25.jpg?fit=1500%2C1000&ssl=110001500adminadmin2019-01-01 18:30:232019-01-01 18:30:29Flash Flood Watch Issued from 6 a.m. Wednesday to Noon Thursday
Yesterday, the area where a developer proposes a new high-rise development flooded for the fifth time this year. This underscores the need for remediation before any permitting.
It wasn’t an especially heavy rain last week. Kingwood received about 2.5 inches. Areas upstream averaged 3 to 4 inches. Yet the West Fork came out of its banks and flooded River Grove Park for the fifth time this year (February 26, March 28/29, July 4, December 7/8, December 27). The USGS Gage at US59 showed that the flood crested at about midnight. The crest reached almost 50 feet at US59.
The West Fork at US 59 crested at almost 50 feet from the most recent rains. In the days preceding, SJRA released 5-7,000 cfs from Lake Conroe.
Jim Zura of Zura Productions took his drone to River Grove during the last light before the overnight crest. The video shows that although the road was still useable, many of the park’s popular amenities were not. The playground, soccer fields, boat ramp and boardwalk all flooded.
Earlier this year, the US Army Corps of Engineers found that excessive sedimentation in the river contributed to excessive flooding. The frequency of these floods supports that conclusion. The Corps began dredging in late September to remove sediment, but has completed only about 20% of the project so far. Downstream blockages remain. And the biggest – at the mouth of the West Fork – is not even within the scope of the current dredging project.
The end of Zura’s video shows the soccer fields and adjoining property, including a small lake in the floodway. This flood gives us a glimpse of how a minor rain would affect the proposed high-rise development there.
Watch all the way to the end!
The frequency of these floods underscores the need to consider the implications of permitting such a major development – especially when officials know the engineering is based on obsolete data and flood maps that in no way reflect current realities.
Until remediation efforts are complete, officials should postpone consideration of the permit. Remediation efforts include:
Dredging the West Fork all the way from US59 to Lake Houston
Creating additional upstream detention
Adding flood gates to Lake Houston
Restoring the conveyance of local drainage ditches and streams.
Rainfalls of the magnitude that caused these five floods should happen about once every 2 years according to Harris County Flood Control. This year they happened five times: 10X greater than expected. A review of peak crest data since 1929 roughly confirms these expectations. In the 80 year since then, the river crested over 50 feet only 40 times.
A review of the same data shows that the river has crested over 57 feet 9 times in the last 80 years and six times since 1994.
I believe excessive sedimentation played a role in this frequency increase. Instead of flooding every other year like this, we’re flooding almost every other month. That’s significant enough to put the brakes on development in the floodway, at least until we understand the extent of the problems and can fix them.
These are my opinions on matters of public policy. They are protected by the First Amendment of the US Constitution and the Anti-SLAPP Statutes of the Great State of Texas.
Posted by Bob Rehak on December 31, 2018
489 Days since Hurricane Harvey
https://i0.wp.com/reduceflooding.com/wp-content/uploads/2018/12/Zura2.jpg?fit=1500%2C843&ssl=18431500adminadmin2018-12-30 13:08:172019-01-26 08:03:54Drone Video Underscores Dangers of Development without Remediation
Warning: NOT for the feint of heart. Together they contain more than 300 pages! Frankly, permit evaluation is far more complex than I imagined.
Site of proposed marina after Harvey. Fresh sand deposits reached almost five feet in height. River Grove Park is beyond this, to the right of the giant sand bar which the Army Corps just dredged through. The drainage ditch it blocked drains the western third of Kingwood.
Plea for Expert Advice
I’m publishing the presentations here because thousands of engineers, project managers, and lawyers with technical backgrounds live in the Lake Houston area. With your help, I’m hoping we can sort through the material and determine a productive response to the Corps’ Public Notice.
As you review these, keep in mind what the Corps wants: “…to solicit your comments and information to better enable us to make a reasonable decision on factors affecting the public interest.” The Public Notice goes into great detail about the scope of the project but focuses largely on the environmental impact of introducing “68,323 cubic yards of fill material into 42.35 acres of wetlands and an estimated 285 cubic yards of fill material into 771 linear feet of streams adjacent to the West Fork San Jacinto River.”
Key Elements of Solicitation
Other key points to consider in the Public Notice include:
“A preliminary review of this application indicates that an Environmental Impact Statement (EIS) is not required. Since permit assessment is a continuing process, this preliminary determination of EIS requirement will be changed if data or information brought forth in the coordination process is of a significant nature.”
They say, “Our evaluation will also follow the guidelines published by the U.S. Environmental Protection Agency pursuant to Section 404 (b)(1) of the Clean Water Act (CWA).”
“The TCEQ is reviewing this application under Section 401 of the CWA and in accordance with Title 30, Texas Administrative Code Section 279.1-13 to determine if the work would comply with State water quality standards.”
“The decision whether to issue a permit will be based on an evaluation of the probable impacts, including cumulative impacts, of the proposed activity on the public interest.”
They then define the public interest as: “All factors, which may be relevant to the proposal, will be considered: among those are conservation, economics, aesthetics, general environmental concerns, wetlands, historic properties, fish and wildlife values, flood hazards, floodplain values, land use, navigation, shore erosion and accretion, recreation, water supply and conservation, water quality, energy needs, safety, food and fiber production, mineral needs and, in general, the needs and welfare of the people.”
Background Information on Corps’ Permit Evaluation Process
I pray that people, their property, and their safety count for as much as birds and fish in this process. However, I’ve talked to several birders lately who are abuzz about eagle spottings near the project site.
All of us are smarter than any one of us. Please help!
Submit Comments
Remember comments are due by January 29, 2019. If no comments are received, the Corps will assume there are no objections to the project. To submit comments: Reference USACE file number, SWG-2016-00384, and send to:
Evaluation Branch, North Unit
Regulatory Division, CESWG-RD-E
U.S. Army Corps of Engineers
P.O. Box 1229
Galveston, Texas 77553-1229
409-766-3869 Phone
409-766-6301 Fax
swg_public_notice@usace.army.mil
Posted by Bob Rehak on 12/30/2018
488 Days since Hurricane Harvey
https://i0.wp.com/reduceflooding.com/wp-content/uploads/2018/03/Harvey-SanJac_180.jpg?fit=2000%2C1333&ssl=113332000adminadmin2018-12-29 22:14:312019-01-13 12:38:25Army Corps Permit Evaluation Process
Romerica Investments, LLC has applied for a permit to develop wetlands, flood plain, and floodway in the area around Barrington and River Grove Park in Kingwood. Rumored for years, many residents, including me, assumed the project died after Harvey. After all, who would be crazy enough to build high-rises in the path of 250,000 cfs? But as they say in horror movies, “It’s baaaa-aaack.” The proposed development includes: a marina/resort district, a commercial district, a residential district, and roadway expansion.
Here’s a link to a video that describes the architect’s vision for the development. It was posted to Vimeo in February of this year. Note the sky-blue waters of the San Jacinto. (This is what you get when a developer in Mexico uses an architect in Rome.) See more specifics below.
Location of Romerica’s proposed development.
The major pieces of Romerica’s proposed Kingwood development. For details see below.
River and Floodway Alterations
The applicant proposes to construct a new navigation channel on the West Fork to the south of the proposed marina and expand the existing channel on the east for better connectivity between the proposed marina and the West Fork San Jacinto River.
Features of Proposed Resort District
The applicant proposes to develop the 25 acres north of the proposed marina into a resort district. The resort district will consist of a resort hotel, commercial, and residential space. The applicant proposes to construct:
Five towers within the resort district at a height of 90 feet for the western hotel parcel
Residential condominium towers at a height of 260 feet, and at a height of 500 feet (50 stories)for the eastern hotel and condominium parcel.
Fill material would be used to raise the elevation of the resort district 12 feet from 45 to 57 feet to raise the proposed structures above the Federal Emergency Management Agency (FEMA) 100-year floodplain of the West Fork San Jacinto River.
Features of Proposed Commercial District
In a 47 acre commercial district, the applicant proposes to construct:
Retail, residential, and office space.
Three towers ranging in height from 230 to 400 feet for the retail offices and residential condominium towers.
Additional mid-rise residential and retail spreads at a height of 70 feet.
Fill material would raise the elevation of the commercial district from 45 feet to 57 feet over base flood elevation and raise the proposed structures over the FEMA 100-year floodplain of the West Fork San Jacinto.
Parking garages with two below grade levels and concealed above grade levels to increase the footprint density.
A 19.25-acre lake (from an existing 16.25-acre lake) to create a smaller marina area for personal watercraft parking.
A 125-foot wide channel between the 80-acre marina and the 19.25-acre marina and the marina/resort district and the commercial district.
Features of Proposed Residential District
The 64-acre residential district would include:
Condominium structures, 65-feet high, on pier and beam foundations with elevated first floor parking and four stories.
They would use fill to elevate them to 58.5 feet, which is above the FEMA 100-year floodplain of the West Fork San Jacinto River.
25-story condominiums with parking garages.
Nearly 2 miles of 41 foot wide roadways with bridges over canals and streams.
Expansion of Woodland Hills Drive
The applicant also plans to bring in more than 1700 cubic yards of fill to raise and expand Woodland Hills Drive. Woodland Hills would become four lanes all the way to Hamblen.
Wetlands Mitigation: Somewhere Else
To compensate for all the fill they are bringing into the floodplain and wetlands, they would purchase mitigation credits from outside the Kingwood area. Basically this means that all of this development would be filling in local floodplains and floodway without commensurate local compensation. Said another way, it would constrict the flow of the West Fork during floods.
Comments are used to determine the need for a public hearing and to determine the overall public interest of the proposed activity. For accuracy and completeness of the record, all data in support of or in opposition to the proposed work should be submitted in writing. Concerns should contain sufficient detail to furnish a clear understanding of the reasons for support or opposition. Prior to the close of the public comment period on January 29, the Corps’ District Engineer will determine whether sufficient cause exists to hold a public hearing.
If no comments are received by that date, it will be considered that there are no objections.
Comments and requests for additional information should reference USACE file number, SWG-2016-00384, and should be submitted to:
Evaluation Branch, North Unit
Regulatory Division, CESWG-RD-E
U.S. Army Corps of Engineers
P.O. Box 1229
Galveston, Texas 77553-1229
409-766-3869 Phone
409-766-6301 Fax
swg_public_notice@usace.army.mil
Rehak’s Concerns
If not removed, the mouth bar will back flood water up into this area during major floods.
I thought Friendswood deed restrictions limited the height of commercial structures to 3 stories. When I built my commercial property, that was the limit. It was also a major point of contention during the construction of the new Emergency Hospital at 59 north of Kingwood Drive. I wonder how they’re getting around that. All these high rise buildings in the middle of a residential area will significantly change the character of the community. Most residents bought into Kingwood because of those deed restrictions.
Filling in our floodplain with mitigation credits purchased from somewhere else will significantly alter floodplain characteristics here. When KSA explored building a dog park in River Grove Park, the City engineer told us that the width of the fence posts could not reduce flood conveyance by .000001%. The maximum allowable was 0%.
Boat navigation on the West Fork has been if-fy for decades and getting worse due to sediment washed downstream from sand mines. Dredging may improve a two-mile stretch, but until the mouth bar is removed, boats will have a difficult time navigating beyond that. The Army Corps is having to dredge its way up and down the river. Any marina likely could not survive the kinds of floods we had in 2015, 2016 and 2017. Other structures would also likely be damaged.
If damaged in a future flood like Harvey, who would have pockets deep enough to repair these huge structures? Few would want to inhabit them. The one office building on Hamblen has flooded repeatedly in the 35 years I have lived here. It’s not just repairing water damage this close to the river; Harvey deposited 5 feet of sand in River Grove Park. How do you clean all of that sand out of a luxury resort?
The paving and filling of all this wetland will increase and accelerate runoff that endangers downstream properties.
It appears that no environmental impact study has been filed.
All of the floodplain calculations are based on old surveys which are currently being revised. Before these buildings could even be built, floodplain maps will be redrawn. Remember, USGS reclassified Harvey flooding at Highway 99 as a 42-year storm. The area where many of these buildings would be built has been under three feet of water at least four times this year.
I’m not an engineer, but will the soil support structures this large?
It already can take a half hour to get in and out of Kingwood at rush hour. This high density development could add thousands of additional cars when residents have indicated they do not want to widen Kingwood Drive or Hamblen Road. The information provided to date makes no mention of traffic loads.
Having said all that, the architects renderings look gorgeous. If they could solve those concerns, the development might be an asset to the community.
Please send your feelings, pro or con, to the address above.
These are my opinions on matters of public policy protected by the First Amendment of the U.S. Constitution and the Anti-SLAPP statutes of the great state of Texas.
Posted by Bob Rehak on 12/29/2018
487 Days since Hurricane Harvey
https://i0.wp.com/reduceflooding.com/wp-content/uploads/2018/12/Pieces-of-Romerica-Dev-e1546040851855.png?fit=1500%2C1095&ssl=110951500adminadmin2018-12-28 17:29:182019-01-13 12:39:04Public Notice: Army Corps and TCEQ Soliciting Comments on High-Rise Development Near River Grove Park
If they kept world records for flooding, surely Tammy Gunnels would have the gold medal. Her home flooded 10 times in 10 years, once due to Hurricane Harvey and the other times due to inadequate or damaged storm drains on her street. The lady, who works as a maid and has scrubbed toilets for 33 years, has sought help from Montgomery County, the State of Texas, and FEMA – all to no avail. But rather than walk away from her mortgage, she and her husband have spent a quarter of a million dollars on flood mitigation for an $80,000 house. This family not only slipped between the cracks, it got swallowed by them. Learn how two people’s lives changed forever when they bought a house from an unscrupulous seller who hid past flooding problems. I interviewed Tammy in her modest home in a modest neighborhood called River Club Estates. The neighborhood is between Sorters Road and the West Fork of the San Jacinto in Montgomery County.
Tammy Gunnels baking Christmas cookies in her kitchen with her son Justin Davis and husband Ronnie Gunnels.
Rehak: When did you buy this house?
Gunnels: In December of ’08, exactly ten years ago.
A low lot and inadequate drainage: a bad combination for the Gunnels family.
Rehak: When did you first flood?
Gunnels: Four months later, in April, ’09. We’ve flooded nine more times since. If the forecast calls for 2 to 5 inches, we have to prep for flooding. Before we built a concrete berm that runs 8 inches below and 8 inches above ground around the house, a heavy rain would flood us in half an hour. Now, it takes about two hours of heavy rain. It all depends on how fast it comes down.
Rehak: How do you prep for a flood?
Gunnels: We put all of our furniture up on wooden blocks that we store out in the garage. The only carpets we have now are area rugs, so we roll those up and put them up on couches or tables.
Extensive Flood Mitigation Efforts
Rehak: What else have you tried to mitigate flooding?
Gunnels: Everything anyone has ever suggested. The first thing to go was carpets. For a while, we tried indoor/outdoor carpets. A contractor told us we could just suck up the water after a flood with a shop vac and then dry it out with fans. But that theory only lasted until the septic backed up. So we ripped everything out and then painted the concrete. But floods make the paint bubble up. We repainted a couple times and spot painted for four years. Then after Harvey, we realized “NO MORE.” I wanted something that I never had to mess with again. So, we went to stained concrete.
Rehak: It’s beautiful. How do you like it?
Gunnels: When we get water, my husband shop-vacs it up and we’re good.
Rehak: What else have you done?
Gunnels: We have three-inch plastic baseboards instead of wood. They never rot. They are clipped into place so we can remove them before water starts coming in.
Removable kick plate conceals flood space under elevated cabinets.
We raised all the cabinets and sinks up off the floor, like in a motel. Some of those have removable plastic kick plates, too.
Because we usually only get a couple inches in the house, our sheetrock no longer goes all the way to the floor. It stops 2 inches short. We’ve installed pre-treated studs everywhere, even on the inside of the house. We use green board, which is made out of cement, instead of normal wall board which soaks up water. We’ve installed gutters and downspouts to carry the water away from the house. And we’ve put in French drains for the same reason. We’ve even elevated appliances like the water heater.
Wallboard stops above floor. All studs made from pre-treated timber, even in interior of house.
Rehak: How much water did you have in the house during Harvey.
Gunnels: Over 4 feet. That was from the river, not the street.
Source of Problems
Rehak: Do other people in the neighborhood have the same problems?
Gunnels: Since we’ve been here, aside from Harvey and the Tax Day Flood, no one else has flooded except for us and the house next door. When it starts to rain, water is supposed to drain out through the neighborhood. But there’s not enough slope or capacity to carry it away. We’re at a low point, in a little bowl.
First time we flooded was from a flash flood. We got 4 or 5 inches. Nobody in the whole, entire neighborhood flooded but us.
Insurance approved repairs up to two feet. Once we cut into the walls, we saw water marks three feet up on the studs. The people we bought the house from only disclosed two floods, neither more than a couple inches, and said it was because of the lack of maintenance from the county. We found evidence of other floods that were much worse when we started to investigate.
From Misrepresentation to Mitigation
Rehak: How did that affect your insurance?
Gunnels: When we bought the house, we were in the 500-year flood zone. So, our insurance was only $285.
After our very first flood, State Farm said you’ll have to go direct to FEMA; you’re high risk. That’s when we learned how bad the problem was. FEMA told us the house had flooded FIVE times. The sellers only disclosed two and said water had never gotten over the baseboards. That was an outright lie from the water marks under the wall board.
Once we found out all that, our contractor recommended that we build a concrete berm 8 inches below and 8 inches above ground around the house. So, we sunk money into that. We were good for a couple years. We later realized that our “good luck” was the drought. The following year, we flooded three times in a seven-week period. As soon as we got sheet rock cut, it would flood again. It just would not stop!
Don’t forget to step up when you leave through the front door!
When State Farm sent us to FEMA, FEMA wanted $2,000 per year. After constructing the berm, gutters, French drains, and more, my husband and I felt we would be OK without the insurance.
Hit Five Times in One Year Without Insurance
Then we got hit five times in one year. When I tried to get insurance, they now wanted $3,000 a year. But we hadn’t made any claims except for that one in ’09.
Not even a concrete wall around the exterior of the house was enough to stop the flooding. Gunnels tries to sop up the leakage with extra sheets.
We had done everything anyone had told us to do. Except for elevating the house. We got three different estimates for that. Not including electrical, plumbing or anything else, the lowest was over $100,000. That just wasn’t feasible for us.
Not Enough Claims Means No Buyout
At this point we were up to six or seven floods. Then the Tax Day flood happened. That’s when Montgomery County stepped in. They said, “We’re going to start offering buyouts. We asked for one, but they said, “You don’t qualify because you haven’t maintained insurance.”
I said, “Because I didn’t file claims, you won’t offer a buyout?” He said, “Unfortunately, that’s the way the system works.
So, we bit the bullet and got insurance in 2015. In our bathrooms, our vanities and everything are elevated. There’s nothing touching the floor.
Example of elevating cabinets to reduce flood damage.
I had my kitchen cabinets specially built. The kick plates are removable. They’re made out of plastic and clipped on. In a flood, I can pull off those kickplates and let the water go under. Usually, we only get a couple inches.
Rehak: But in Harvey the whole neighborhood flooded?
Gunnels: Pretty much. Just a few homes that sit up higher did not flood.
Advice For Others
Rehak: Knowing what you know now, what advice would you give homebuyers to avoid the situation you’re in?
Gunnels: Buy flood insurance and file a claim every time it floods.
Also, I didn’t know you could get a history. Of course, sellers should disclose. But sometimes they conceal things. Don’t take the seller’s word for it. Get a print out from FEMA. They’ll give you a history on any property that’s had a flood claim on it. Also, talk to neighbors. It’s very important to talk to the neighbors because we flooded without insurance, so it’s not on record. But our neighbors know.
FEMA had paid out a total of a quarter million dollars on this property BEFORE our claims. We’ve now made three.
Rehak: FEMA paid $250K. You put another $250K into it. So you have half a million dollars into a house that cost $80K.
Gunnels: (Laughs.) Yeah, pretty much. In a home built in 1967. It makes absolutely no sense.
Search for Help from Officials
I clean homes for a living. One of my clients is a lawyer. After Harvey, she sent some letters for me, trying to get a buyout. But the answer we got was, “No funds available, Montgomery County is no longer doing buyouts.”
I don’t know who to contact at this point. I contacted county commissioners Jim Clark and Ed Rinehart. I’ve contacted Cecil Bell, our state representative. I have already made plans to call the new county commissioner James Metz. He starts in January. We’ve talked to FEMA numerous times.
The county engineers came out and explained how the drainage works.
They said we need a wide drain that goes from Sorters Road to Lana Lane. We said, “Well, build it.” They said, “We can’t. It’s on private property.”
When the property owners gave them permission, they said, “Oh no, we can’t. It’s too much of a liability. We can’t do that.”
My neighbor uncovered some emails saying they were going to do it, and then somehow, the money wasn’t there for them anymore.
Emotional Losses Compound Financial Losses
Rehak: Financially, the floods have been devastating for you. How have you survived emotionally?
Gunnels: In every flood, I’ve lost something. I inherited things from my great grandmother, grandmother and mother. Slowly but surely, over nine or ten floods, I have lost everything they gave me. After each flood, I told myself that “It’s just stuff.” But at a certain point, I said, “It’s my stuff.”
The hundred-year-old family bible Gunnels inherited from her mother: an irreplaceable loss to flooding.
Everything that you look at in this house is brand new. Everything. From the lamps to the tables. To the throw rugs. I have lost everything. But with Harvey. This was lost. (She plops a swollen book on the table; at first I don’t recognize what it is.) This is my mother’s family bible from 1918. I can’t turn the pages because they are stuck together. (She breaks down crying.) That is what it does to me.
Gunnels’ husband and son return from an errand.
No Way Out
Rehak: What would you like to do now if you could do anything?
Gunnels: Get bought out. Give me anything. A FEMA trailer and a piece of land. I’ll be happy.
My grandkids who visit every two weeks religiously have their own room here and they have lost everything, too. They can’t keep toys or a doll house or anything here. In EVERY flood, we lose something..
The first thing people say when they hear about our situation is, “Well, just move.” “Really? Where are we going to move to?” We’ve even looked into walking away from this house and letting it go into foreclosure. But that ruins our credit. We wouldn’t even qualify to rent a plastic shed from Home Depot.”
“We also looked into buying another house while we still owned this one. But the bank wanted to see a year of payments made on two places before loaning the money.” There’s just nothing that anyone can suggest that we haven’t looked into.
Fighting a Tax Increase
Rehak: So, I’m guessing that if you’re running Tammy’s Maid Service and you’ve sunk a quarter million dollars into this place, you’re not a shirker.”
Gunnels: Right! (Laughs.) I’m not high educated, but I’ve scrubbed toilets for 33 years. We’ve worked for what we have.
The Montgomery County Appraisal District wanted to raise our taxes one year. “Oh ho ho,” I said. “You want to raise my taxes on thisplace? They tried to come at me with, “The home over here is worth this and the home over there is worth that.”
I said, “Look at the pictures. You got raw sewage in the ditch. I flooded this many times.” They dropped our valuation down to $60-something thousand dollars. At first, they tried to argue with us. But the board voted unanimously to lower our appraisal.
Montgomery County wanted to increase the appraisal on Gunnels’ flood-prone property, but ultimately backed down.
If this house didn’t flood, it would be worth about $160,000 with all the improvements we made. We upgraded everything. We even replaced all the wiring in the house. Replaced aluminum with copper. Put in smoke detectors. A new breaker box. The works.
I’m not asking for anything more than what I have. I’ll even take smaller. As long as it doesn’t flood.
Gunnel’s Husband: My family all lives near here. So it’s important to us that we stay in the neighborhood.
Impact on Retirement and Savings
Rehak: What next for the Gunnels family?
Gunnels: Every single time a claim is paid out on this house now, it’s taxpayer money. We waste taxes on this.
Rehak: How much have you received in flood insurance claim reimbursements?
Gunnels: About $180,000.
Home Wet Home! No way to live with it and no way to leave it.
Rehak: What has happened to your savings?
Gunnels: We’ve burned through his 401K and every bit of savings we had. DONE! He is 53. I will be 49 next month. To our name, we have about four grand in savings.
Gunnels’ Husband: I didn’t know we had that much!
All: (Belly laughs.)
Gunnels: He’s got a little bit left in his 401K. Maybe 20 grand.
Rehak: That’s not going to last very long in retirement.
Gunnels: One year. Maybe. Everybody I talked to has empathy, but apparently there is no sympathy … because “Here we are.”
This was going to be our retirement home. When we moved here, we still had two kids left in school between us. Now they’ve moved on and we have grandkids. This was going to be our last home ever. We were fixing to die in this home. And we probably WILL.
Everyone: (More belly laughs.)
Posted by Bob Rehak on December 28, 2018
486 Days since Hurricane Harvey
https://i0.wp.com/reduceflooding.com/wp-content/uploads/2018/12/Gunnels_01_01.jpg?fit=1500%2C844&ssl=18441500adminadmin2018-12-27 18:00:012018-12-27 21:14:49Tammy Gunnels Flooding Story: Ten Times in Ten Years
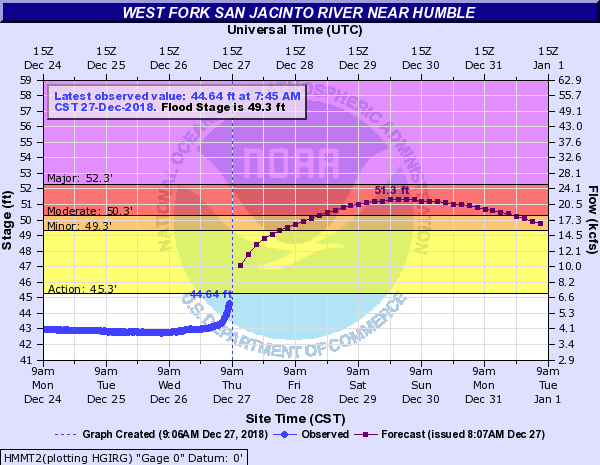
The rain overnight became pretty intense between 4:30 and 5:30 a.m. about the time the NWS issued a tornado watch. Once again, areas north and northwest of us received more rain that we did. The NWS has issued a flood warnings for the West Fork of the San Jacinto. West Fork. They expect the river to crest at 51.3 feet, well below the major classification.
The River should rise above flood stage Friday morning and crest on Sunday. The flood will impact low lying roads near the river. The north side turnaround at US 59 and low points on Thelma Rd, Aqua Vista Dr, and Riverview Dr. will begin to flood. Water levels should approximate those reached in the December 7-8, 2018 event. Nearly all of the water heading into the West Fork is from significant run-off being generated on Cypress, Spring, and Lake Creeks.
The City did not lower Lake Houston in anticipation of this flood. However, the Coastal Water Authority is currently releasing 2500 cubic feet per second through the tainter gates on Lake Houston. It will be interesting to compare the ultimate water height to the Dec. 7-8 flood when the City did lower the Lake.
Here’s what the dock at River Grove looked like this morning. Photo courtesy of Bruce Casto.
Boat dock at River Grove around 9 a.m. on Thursday 12/27/18.
On December 8, River Grove looked like this.
River Grove Flood Level on December 8. Will this flood be higher?
East Fork Crest Delayed and Prolonged
East Fork residents can breath a little easier.
River is already rising at FM 1485 and nearing bankfull at FM 2090 (Plum Grove). Heavy rainfall over the headwaters of the river will move downstream from the Cleveland area and reach Plum Grove and FM 1485 this weekend. The river should rise to flood stage midday Friday and have an extended flat crest over the weekend near 60.5 ft. FM 1485 may be threatened at these levels along with low lying roads in subdivisions downstream of FM 1485. That’s Huffman and Kingwood!
Spring Creek
Significant run-off is in progress over the upper headwaters of Spring Creek and the creek is rising along the entire channel. Hegar Rd is at bankfull this morning and near bankfull conditions will be possible along the creek downstream to SH 249 and I-45. No structure flooding is expected, but some low lying roads near the creek or that cross the creek may be impacted…especially upstream of SH 249.
Cypress Creek
Significant run-off in the headwaters into Cypress Creek. Creek may reach near flood stage later today at Katy Hockley. Harris County Flood Control does not expect any significant downstream flooding east of Hwy 290 along Cypress Creek, although the creek will be very high as upstream water moves downstream.
Posted on 12/27/18 by Bob Rehak
485 Days since Hurricane Harvey
https://i0.wp.com/reduceflooding.com/wp-content/uploads/2018/12/image002-1.png?fit=600%2C465&ssl=1465600adminadmin2018-12-27 10:21:412018-12-27 10:49:27Moderate Flooding Expected on West Fork, Minor Flooding on East Fork