Houston TranStar has upgraded its mobile app and web site in time for the 2020 Hurricane Season. They now feature more sensors and a wider area of coverage that extends throughout the Houston region. The app shows real-time traffic data and estimates areas of roadway-flooding risk during heavy rainfall.
Houston TranStar shows real-time traffic data with potential trouble spots for roadway flooding.
“Expanding the Roadway Flood Warning System’s footprint into counties adjacent to Harris allows us to warn even more people about potentially dangerous roadway flooding,” said Dinah Massie, Executive Director for Houston TranStar. “Information collected by this highly accurate technology is overlaid on the TranStar Traffic Map and mobile application. We’re warning motorists about flood risk and also helping emergency crews respond more quickly and safely during heavy rainfall.”
125,000 Users
To date, more than 125,000 people get up-to-the-minute roadway flood warning alerts using TranStar’s mobile app.
TranStar’s Roadway Flood Warning System was developed to warn motorists of streets with potentially high water so you can plan alternative routes and avoid dangerous situations.
The system uses a comprehensive network of 283 sensors to estimate areas of roadway flooding risk and can be easily accessed through the TranStar Traffic Map.
Reroute Around Trouble
With the addition of new sensors, Houston TranStar now alerts travelers to areas where roadway flooding risk is high in more places than ever before.
It helps commuters reroute transit plans around trouble spots, such as flooded roadways and underpasses. Unfortunately, many people have lost their lives driving into flood waters that weren’t visible because of darkness or heavy rain.
Increased Capacity to Monitor Water Levels
Harris County Flood Control District, the Brazoria Drainage District, the City of Sugar Land, Fort Bend County, the Galveston Drainage District, Waller County and the San Jacinto River Authority maintain sensors. The new sensors increase capacity to monitor water levels for possible local street inundation throughout TranStar’s region.
During Harvey, I relied on this system to navigate my way back into Houston from a long, vacation road trip. It works. This free app could save your car and your life.
Bob Rehak
In case you lose track of this story, you can always find the TranStar links under the Governmental tab on this website’s Links page.
Unique Partnership Saves Billions of Tax Dollars
Houston TranStar is a unique partnership of the City of Houston, Harris County, the Metropolitan Transit Authority of Harris County (METRO) and the Texas Department of Transportation (TxDOT). They share resources and exchange information under one roof to manage transportation and emergencies.
This 2 minute video shows how the system works and explains how sharing resources has saved taxpayers billions of dollars. The annual cost to operate Houston TranStar in 2018 was $25.2 million. Divided into TranStar’s annual benefit of $517 million, the benefit/cost ratio is 20.5. So, for every $1 spent on Houston TranStar, the region realizes a benefit of $20.50. Since its inception 22 years ago, TranStar has saved commuters $6.5 billion in reduced traveler delays and fuel costs.
Posted by Bob Rehak on 8/5/2020based on a story in the Westchase Wire
1072 Days after Hurricane Harvey
https://i0.wp.com/reduceflooding.com/wp-content/uploads/2020/08/Transtar-Warning-System.jpg?fit=1200%2C976&ssl=19761200adminadmin2020-08-05 12:58:262020-08-05 12:58:38TranStar Enhances Flood Warning System
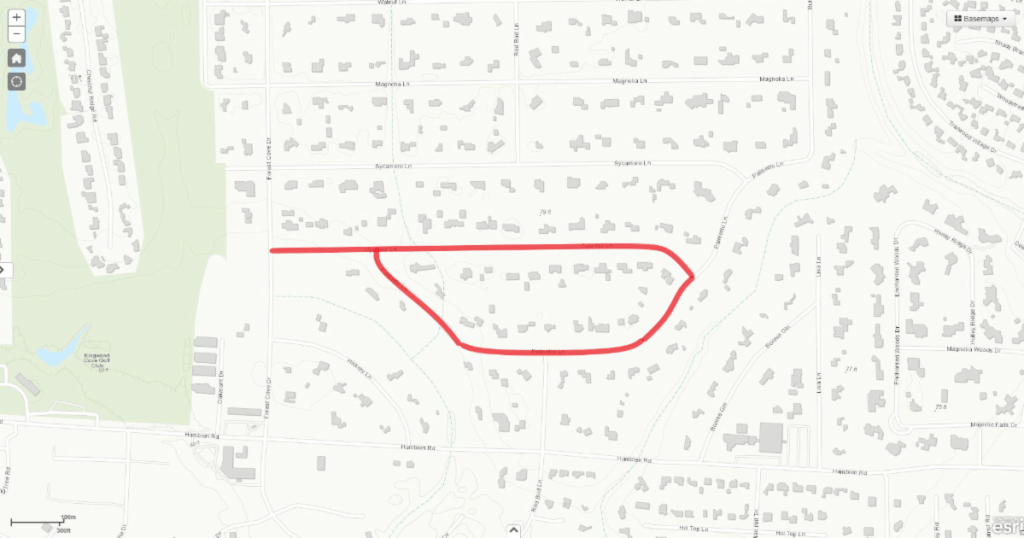
The City of Houston’s Stormwater Action Team began rehabilitating a roadside ditch in Forest Cove on Monday, July 27, 2020. The project area includes Cypress Lane and Palmetto Lane. The map below shows the project limits highlighted in red.
Location of work in Forest Cove
Crews will work Monday through Saturday, from 8:00 a.m. to 5:00 p.m. They should complete the work by November 24, weather permitting.
Scope of Work
The scope of work includes:
Regrading and re-establishing of the roadside ditches
Replacing of the culverts and resetting them to match the flow line of the ditch
Replacing the driveway where the culverts are replaced
Increasing the capacity of any culverts less than 24 inches in diameter
Removing any unpermitted culverts or other encroachments in the City Right of Way.
Impact on Traffic, Neighborhood
Construction will not impact any water or sewer services.
Expect temporary loss of driveway access, lane closures, construction noise and debris, and limited roadside parking during the project.
Flagmen and orange traffic cones will help with traffic flow through the construction zone as the project will require one lane closure. However, traffic will flow two ways at all times.
Businesses and residents will have access to driveways and sidewalks at all times, and may experience an increase in noise levels due to trucks and equipment in the area.
For More Information
For more information, please contact Mayor Pro Tem Dave Martin’s office at (832) 393-3008 or via email at districte@houstontx.gov.
Posted by Bob Rehak on 8/5/2020
1072 Days after Hurricane Harvey
https://i0.wp.com/reduceflooding.com/wp-content/uploads/2020/08/Cypress-Ln-SWAT-Project.png?fit=1200%2C630&ssl=16301200adminadmin2020-08-05 10:42:212020-08-05 10:42:33City of Houston’s Stormwater Action Team Begins Ditch Rehabilitation in Forest Cove
The New Caney ISD has removed a long swath of trees that separated Sorters-McClellan Road from the site of its new high school south of the Kingwood Medical Center. Removal of the trees – beforethe construction of the detention pond for the site – removes the last barrier between sheet flow and residents downhill.
Similarities to Woodridge Village
Clearcutting creates a condition similar to that of Woodridge Village. Woodridge contributed to flooding Elm Grove and North Kingwood Forest twice last year after Perry Homes cleared the site before installing all the required detention. With nothing to retain runoff in a major storm, water could inundate Sorters Road and the homes on the opposite side of it in McClellan Circle.
This once again raises the question of whether contractors follow best practices for construction.
The site is in both Montgomery County and the City of Houston. But Montgomery County claims the City took the lead in permitting this site. MoCo claims it does not even have any drainage plans.
Looking south along Sorters Road at the site of New Caney ISD High School #3. Land slopes from left to right and foreground to background. Recently, contractors removed all trees next to the road. A large detention pond is supposed to be installed next to the tree line at the far end of the site. See below.
Building Pad Site Complete But No Detention Pond Yet
As of July 20, 2020, New Caney ISD had this to say about the project. “The site has been cleared and rough grading is at 90 percent completion.” Contractors have completed the building pad and will start installing the concrete piers concurrent with the underground storm and sanitary systems.
General plan for New Caney High School #3. North is left, east is up.Detention pond should be at far end of the photo above.
This approximately 50-60 acre site slopes toward the corner in the upper right by 10 to 15 feet depending on where you start.Sources: Google Earth Pro and USGS National Map Viewer.USGS National Map Viewer still shows old par 3 golf course on which the new high school will be built.
This is a 5% slope compared to the 1.8% slope on Woodridge Village.
Comparing Google Earth Elevation Profiles
The steepness of the slope accelerates runoff in the absence of features to slow it down.
Current State of Site
Here are some more shots showing the current state of construction on the site.
Looking NW toward the Eagle Sorters Sand Mine in the top left.Looking NE toward HCA Kingwood Medical Center and Insperity.Looking SE toward retail establishments that front US59, barely visible in the top left of the frame.
There seem to be some berms in the corners of the property. They may slow down sheet flow in a large storm. But the berms are absent over the large area in the center where the high school building itself will go.
Peak of Hurricane Season 5 Weeks Away
Let’s hope they get the detention in before the next big storm. No one wants a repeat of Woodridge.
Posted by Bob Rehak on 8/4/2020
1071 Days since Hurricane Harvey
The thoughts expressed in this post represent opinions on matters of public concern and safety. They are protected by the First Amendment of the US Constitution and the Anti-SLAPP Statute of the Great State of Texas.
https://i0.wp.com/reduceflooding.com/wp-content/uploads/2020/08/20200803-DJI_0295-2.jpg?fit=1200%2C900&ssl=19001200adminadmin2020-08-04 19:04:222020-08-04 19:17:18New Caney ISD Clearcutting Site of High School #3 Before Installing Detention
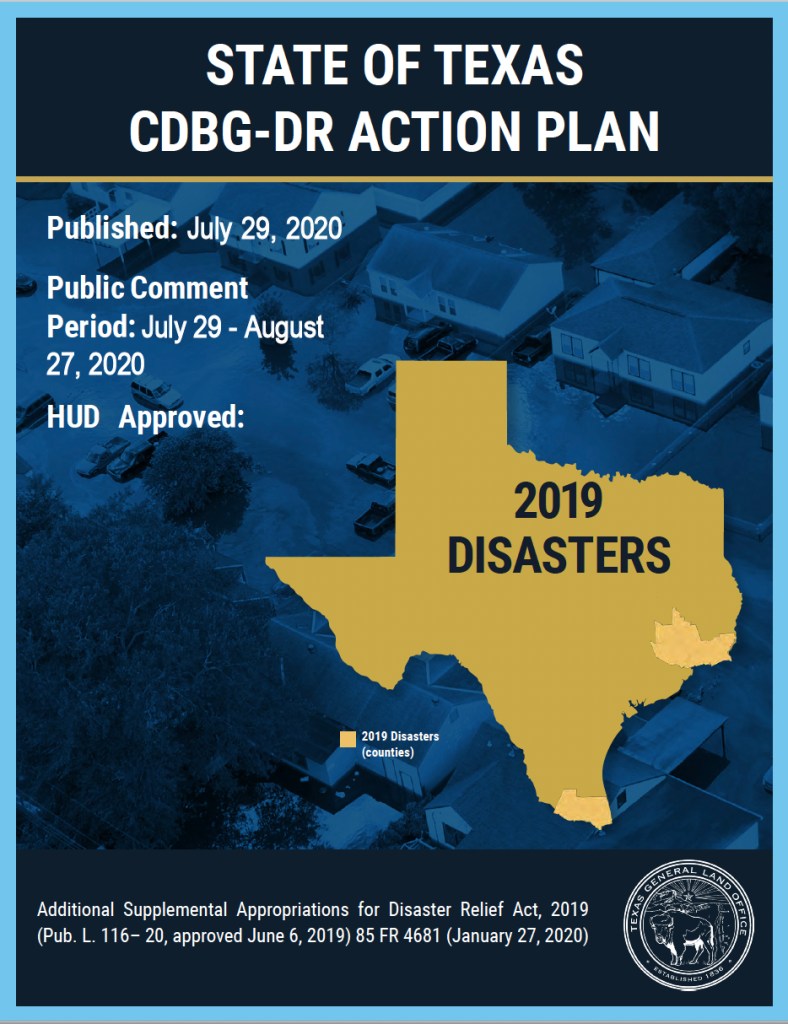
The Texas General Land Office (GLO) published its proposed Community Development Block Grant – Disaster Relief (CDBG-DR) Action Plan last week for floods in Texas during 2019. This 136-page document is available for public review and comment through August 27, 2020. It describes rules that the GLO will use to distribute $212,714 million in CDBG-DR grants from the US Department of Housing and Urban Development (HUD).
As matters of national policy, HUD has required grantees to spend at least 80 percent of the allocation on unmet needs in HUD identified most impacted and distressed (MID) areas; the remaining 20 percent will address unmet needs in other eligible counties. Also 70% of the funds must go to meet the needs of Low-to-Moderate Income persons.
The GLO is in charge of distributing money in Texas (through municipal and county governments) to people and areas affected by disasters declared as federal emergencies. In Texas in 2019 that meant ten counties in the Lower Rio Grand Valley and southeast Texas.
Eligible counties where damage occurred
From June 24 to June 25, 2019, high rain totals within Cameron, Hidalgo, and Willacy Counties in the Rio Grand Valley led to street flooding and road closures; nearly 1,200 homes destroyed or in need of major repair; and over 100 people evacuated. Rainfall totals ranged from 12 and 18 inches in some locations.
In September, Tropical Storm Imelda caused $8 billion worth of damage in Chambers, Harris, Jefferson, Liberty, Montgomery, San Jacinto and Orange Counties. Imelda, the seventh wettest storm in US history, dropped 40+ inches of rain in Chambers, Jefferson, and Liberty Counties. The highest total was in Fannett in Jefferson County where 44.29 inches fell.
How Money Will Be Distributed
HUD wants its money to increase the resiliency of homes and communities. Of the $212.714 million:
70% will go to improving housing resiliency
30% will go to improving infrastructure resiliency
Allocation by location and program in dollars and percentages.
Eligible Single-Family Home Improvements
Single-family home resiliency solutions may include:
Elevating the first floor of habitable area;
Breakaway ground floor walls;
Reinforced roofs;
Storm shutters;
Use of ENERGY STAR appliances and fixtures;
Mold and mildew resistant products.
Eligible Multifamily Solutions
Multifamily resiliency solutions include:
Elevation;
Retention basins;
Fire-safe landscaping;
Firewalls;
Landscaped floodwalls
Eligible Infrastructure Solutions
Eligible infrastructure solutions include:
Elevating critical systems, facilities, and roadways above base flood elevation;
Installing backup power generators for critical systems (water, sewer, etc.);
Avoiding an increase in impervious cover by keeping projects in their original footprint and encouraging the use of building practices that allow for more pervious coverage;
Replanting with only native vegetation to preserve the natural environment;
Storm water management including installing retention basins, larger culverts and debris guards, and erosion control solutions; and
Supporting local community efforts to enhance building codes and regulations.
Limitations on Studies
Studies funded with this money may include, but are not limited to, flood control, resilient housing solutions, homelessness, or other efforts to mitigate future housing and residential damages.
Not for Feint of Heart
Warning: these 136-pages are intended for government experts and grant writers who deal with such programs all day every day. The information and its organization will prove difficult for average citizens. Think about the brain freeze you get with the giant DQ Blizzard. Now you have the picture.
Regardless, the persistent reader will be rewarded with a wealth of data about who was impacted when, where and how. Even the homeless.
The persistent reader will also get a good feeling for what’s allowed and not allowed under these rules. For instance, in 2019 disasters, victims can use grants to pay off loans. That was not allowed in Harvey.
Keep in mind that the dollars mentioned here are just for 2019 disasters, not Harvey, which follows similar, but not identical guidelines.
Posted by Bob Rehak on 8/3/2020
1070 Days after Hurricane Harvey and 319 after Imelda
https://i0.wp.com/reduceflooding.com/wp-content/uploads/2020/08/Cover.jpg?fit=934%2C1214&ssl=11214934adminadmin2020-08-03 18:13:502020-08-03 18:32:0970 Percent of HUD Grants in Texas for 2019 Floods Going to Low-to-Moderate Income Households, Neighborhoods
On February 20th of this year, approximately 1,000 plaintiffs filed a 118-page lawsuit against 55 sand mining companies in the San Jacinto River Basin. Plaintiffs allege that the miners harmed them by decreasing the capacity and depth of Lake Houston and its tributaries by wrongfully discharging and negligently allowing the release of materials into waterways. That reduction of capacity, they say, contributed to flooding their homes and businesses.
Western half of LMI River Road mine in floodway and flood plain of San Jacinto West Fork.Note also in foreground how the mine undermined five pipelines carrying highly volatile liquids.
Background
To support their claims (¶613), plaintiffs cite violations of Texas Commission on Environmental Quality (TCEQ) regulations and the U.S. Clean Water Act. They claim:
Excessive, unauthorized discharge of silt into waterways
Failure to:
Obtain stormwater discharge permits
Prevent unauthorized discharges
Minimize generation of dust and off-site tracking
Past and Present Activities Cited
Some defendants, they say, operated above permit limits and others operated without any permits at all (¶614).
Plaintiffs say (¶615) that defendants have operated immediately adjacent to various waterways and in the flood plain, clearcutting all vegetation, and digging pits within feet of the riverbanks. Thus, there are no real barriers between mines and the rivers, they claim. Further, they allege that defendants have no plans in place for protection and preservation of their pits and loose sand during flood events, which occur frequently.
Then Came Harvey
Hurricane Harvey, they say, inundated mines and “thousands of acres of sand washed downstream, clogging the rivers and lakes, resulting in flood waters moving outside the banks and outside the flood plain, causing hundreds of millions of dollars in damages.”
Washed out road INSIDE sand mine during Harvey.Submerged sand mines in the floodway of the San Jacinto West Fork during Hurricane Harvey in 2017
Alleged Violations of Water Code
The defendants had a duty to implement procedures to reduce the discharge of sediment into waterways, but did not, according to the plaintiffs. Thus, the proximate cause of plaintiffs’ injuries involved negligence and negligence per se. Defendants allegedly breached their duties under sections 11.086, 26.039, and 26.121 of the Texas Water Code, thus causing flooding and damage to plaintiffs’ property.
To prove negligence, personal injury plaintiffs must show that the defendants’ conduct fell below the applicable standard of care and that their actions were the actual and proximate cause of harm.
In cases of negligence per se, defendants’ actions are assumed to be unreasonable if the conduct violates an applicable rule, regulation, or statute. That’s why lawyers cite the Texas Water Code, plus TCEQ and EPA regulations.
11.086 of the Texas Water Code provides that no person impound the natural flow of surface waters, or permit impounding to continue, in a manner that damages property of another by the overflow of the water diverted or impounded.
26.039 specifies that mine operators must notify the TCEQ of accidental discharges or spills that cause or may cause pollution as soon as possible.
26.121 prohibits discharge of pollutants. Both the EPA and TCEQ consider sediment a pollutant.
Specific Omissions
Specific omissions, say the plaintiffs, include failing to:
Locate sand mines outside of floodways
Increase the width of dikes
Decrease the slope of dikes
Control erosion with vegetation
Replant areas not actively being mined
Protect stockpiles from flooding
Mine only above the deepest part of the river
Flooding from Hurricane Harvey in Kingwood’s Town Center where 100% of businesses were disrupted, most for approximately a year. Some still have not reopened. Photo by John Knoezer.
Nuisance Claim
The plaintiffs also allege nuisance. Under Texas law, nuisance refers to a type of legal injustice involving interference with the use and enjoyment of property. Specifically, plaintiffs say that the defendants’ negligent conduct caused paintiffs’ flooding, thus depriving them of the use of their homes.
Complaint against Forestar by Barrington Residents
On page 108, a subset of plaintiffs (those who live in the Barrington), lodge a complaint against Forestar (USA) Real Estate Group Inc. They allege that Forestar developed, marketed and sold homes in the subdivision without any standards for determining the elevation of a house relative to flood risk.
The Long Ride to Safety During Harvey. Barrington Photo by Julie Yandell.
“Despite having actual knowledge of the possibility of flooding in the Barrington Subdivision, Forestar did not advise homebuyers to purchase flood insurance,” says the complaint (¶640). “Nor did Forestar advise the residents of the Barrington Subdivision of its location on a floodplain, or that their elevations were changed due to lots being filled with dirt” when residents purchased homes.
Nevertheless, the complaint continues (¶643), homes were built at an “unreasonably low” elevation, given their location near the West Fork San Jacinto. “Forestar knew, or should have known, that houses needed to be built at an elevation adequate to prevent and/or reduce the likelihood of flooding.”
Clean out after Harvey in the Barrington. By Joy Dominique.
Damages Alleged
Plaintiffs allege damages that include:
Cost of repairs to real property
Cost of replacing personal property
Lost of use of real and personal property
Diminution of market value
Loss of income, business income, profits and business equipment
Loss of good will and reputation
Consequential costs, such as loss of time from work and alternate living expenses
Mental anguish
Pre- and post-judgement interest
Court costs
Conscious Indifference and Gross Negligence
¶658 asserts that the conduct of all defendants (sand mines and Forestar) qualifies as gross negligence under Texas law. The plaintiffs say that the defendants acts of omission involved an extreme degree of risk, considering the probability and magnitude of harm to others. Plus, “Defendants had actual subjective awareness of the risk involved in the above described acts or omissions, but nevertheless proceeded with conscious indifference to the rights, safety and welfare of plaintiffs and others.”
Where Case Stands
129th District Court Judge Michael Gomez signed a docket control order on 2/28/2020 that calls for:
All parties in the suit to be added and served with notice by 8/19/2020
Close of pleadings and start of mediation on 12/16/2020
End of discovery on 1/15/2021
All motions and pleas heard by 1/15/2021
Trial, if necessary, on 2/15/2021
To date, there have been several motions to transfer venue, dismiss the case, and change the judge.
Only Triple PG Sand Development, LLC has filed an answer to the plaintiffs’ claims; the company filed a general denial.
In a separate case, the Attorney General of Texas is suing Triple PG for failing to prevent and repair breaches in dikes that resulted in repeated unauthorized discharges of process wastewater and sediment into Caney Creek. Caney Creek joins the East Fork San Jacinto just downstream from Triple PG. Triple PG currently operates under an injunction that bars it from dredging.
Breach of Triple PG mine into Caney Creek and the headwaters of Lake Houston
Editorial Opinion
If successful, this case may force sand mines to operate more responsibly, now and in the future. For instance, it might force them to move farther back from rivers and out of floodways. Having taken thousands of photos of leaking sand mines from the air since Harvey, in my opinion, that might benefit everyone, not just the plaintiffs.
Giant sand bar at the mouth of the West Fork which backed water up through much of Kingwood, Atascocita and Humble.Mouth bar on the East Fork San Jacinto grew by thousands of feet during Harvey and Imelda.Downstream from Triple PG and Texas Concrete Mines.
The thoughts expressed in this post represent opinions on matters of public concern and safety. They are protected by the First Amendment of the US Constitution and the Anti-SLAPP Statute of the Great State of Texas.
https://i0.wp.com/reduceflooding.com/wp-content/uploads/2019/12/20191203-RJR_5020.jpg?fit=1200%2C800&ssl=18001200adminadmin2020-08-02 08:55:112020-08-02 09:24:31Approximately 1,000 Plaintiffs File Suit Against Sand Mines in Harvey Flooding
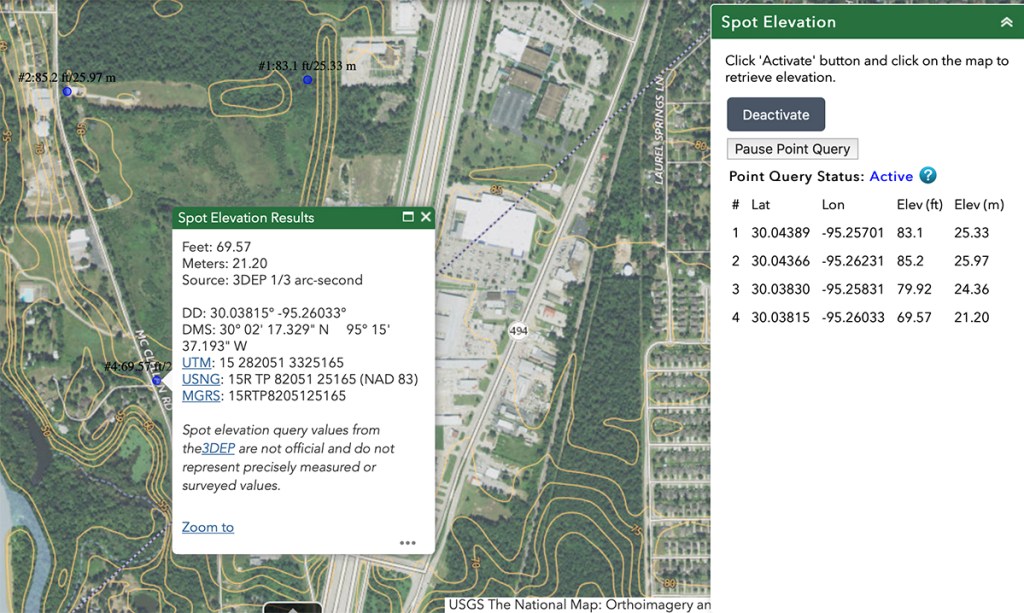
Ever wonder how high your slab is compared to the elevation of your street? Or where water is likely to collect in a neighborhood? The US Geological Survey (USGS) has given us a quick and easy way to lean more about elevation.
While the site says the elevations are not as good as a survey’s, I found the elevation for my house to be within inches. This is not something to take to the bank, but if you’re trying to:
Screen several properties for purchase
Figure out why some people in a neighborhood flooded and others didn’t
Enter an address or just zoom into the area of interest.
Select a base map by clicking on the icon with the four squares that form another square. Different base maps allow different degrees of zooming and show various features such as streets, water features, topography, etc., so experiment.
Above the map area, click on the icon that shows an XY.
A box will pop up on the right side of the screen. Within it, click “Activate.”
Click on the map location or locations that interest you.
An info box will pop up that shows the location and elevation at the blue dot(s) where you clicked.
To erase the points you selected, click “Deactivate.”
Elevations for Riverwood and East End Park Parking Lot
You can click as many different points as you want. A list of ALL the places you clicked with their elevations will show up in the right hand box.
In the example shown above, you can see that Riverwood Middle School at the intersection of High Valley and Kingwood Drive is at 65.03 feet. You can also see that the entry for East End Park is at 53.68 feet – more than 11 feet lower just a couple blocks away.
How High Is A Home Above Street Level?
This question is crucial if you want to avoid street flooding during high intensity rainfalls that overwhelm the capacity of storm drains and force water to back up in the streets.
Switch to the base map called Streets (if you were in something else)
Zoom in on the area of interest or enter an address.
Again select the XY tool.
Click on the home that interests you to see the elevation of the slab.
Click on the street in front of it.
Note 3 foot elevation difference between slab and house in Streets Basemap.
Three feet is a pretty good difference. But another home in the same neighborhood has a 4.5 foot difference!
This home sits 4.5 feet above the street.
Click around in different neighborhoods, especially those that flooded. On a block that flooded badly in Elm Grove, one home escaped. It was also 4.5 feet above street level. Others around it ranged from 1 to 3 feet above street level.
When buying a home, elevation above street level can be a valuable consideration.
Streets are usually considered part of the flood retention system. Developers size storm drains to hold a 1- or 2-year rain. Everything beyond that up to a 100-year rain backs up into the street until it can be safely released into drainage ditches. If you aren’t high enough…
Slope Within Neighborhoods
USGS offers another useful tool called elevation profiling. To the left of the XY tool, click the tool called Profile.
A box will pop up on the right of the screen. To activate this tool, click on the ruler icon in the box.
Define a path with two or more points.
In the example below, I followed the curves of a street by clicking multiple times.
When you get to the end of the area of interest, DOUBLE click.
Double clicking changes the tab in the right hand box and starts compiling an elevation profile result.
Give the site a few seconds to compile and display the profile.
When this profile popped up, I saw that this street had six feet of slope from the west end of the block to a low point in the middle and then rose back up three feet to the school on the right.
Example of Elevation Profile Tool.Note the U-shaped profile in blue and brown on the right.
It’s common practice to slope streets; developers must to ensure that water drains to storm sewers. But when the rain comes down so fast that the storm drains can’t handle it, guess where the rain will collect. I’m not sure I would want to buy the house at the bottom of the bowl. (At least not without a discount to compensate for the risk.)
Powerful Tools at Your Fingertips
USGS has given us a fascinating tool kit. I have just begun to explore the power of this site.
Several people in Kingwood’s Woodstream Village approached me about some flooding on their street. Using the tools on this site, I quickly developed a theory that accounted for all the eyewitness stories.
Have fun exploring this fascinating tool.
Posted by Bob Rehak on 8/1/2020 with thanks to Laura Norton
1068 Days since Hurricane Harveyand 316 since Imelda
https://i0.wp.com/reduceflooding.com/wp-content/uploads/2020/08/Slope-in-Neighhborhood.jpg?fit=1500%2C695&ssl=16951500adminadmin2020-08-01 17:09:142023-10-21 11:40:38Easy Way to Find the Elevation of a Home and the Slopes Around It
This morning, a For-Sale sign went up in Kings Harbor on vacant land between Chimichurri’s and the construction I reported in July. Houston Area Realtors (HAR.com) shows this property listed for sale at $1,600,000.00. After Harvey, Harris County Appraisal District valued it at $650,000. Now that most Harvey damage in the area has been repaired and there are few visible reminders of the devastation, you’ll likely see more attempts to cash in like this before flood maps are revised.
Big Money for Flood-Prone Property
Below is the sign that went up this morning.
Sign erected on 2.21 riverfront acres in Kings Harbor on 7/31/2020
The Houston Area Realtors website shows that the owner wants $1.6 million for it.
USGS shows the elevation of the property at about 10 feet above the river, which it fronts on. Note the the drop in the elevation profile below.
Source: https://viewer.nationalmap.gov/advanced-viewer/. Those two sharp dips in the elevation profile on the right are the streets that the green line crosses. Lai’s property is the big hump in the middle between 52 and 53 feet.
FEMA shows that the land is currently in the 100- and 500-year floodplains.
Mr. Lai, who reportedly bought the property in foreclosure, must be hoping that people won’t remember the flooding history of this property and that they will fall in love with the view. Since Harvey, the only major thing that has changed is that all visible signs of flooding have been repaired.
Value of Property Tied to Flooding
According to Harris County Appraisal District, Mr. Lai evidently bought the property in 2008. HCAD lists the last five years of appraised value at:
2016 $1,003,014
2017 $1,200,000
2018 $650,000 (Year after Harvey)
2019 $697,580
2020 $700,319
Note how the appraised value dropped almost 50% after Harvey. Now, Mr. Lai is trying to sell the property for about 2.5X the post-Harvey appraised value – less than three years later. Not enough has changed downstream to reduce flood risk by that much. But many people have forgotten how bad Harvey was by now. And most of the visible scars of the flood have been repaired. So here’s a refresher course for the Kings Harbor area.
In the last 25 years, floods have reached the street level of Mr. Lai’s property three times. Harvey was one of those. Harvey exceeded the height of his property by almost FIVE feet.
Flooding three times in 25 years is a far cry from any true 500-year flood plain.
Flood Maps Being Revised
FEMA last updated flood maps in this area in 2007. Mr. Lai benefited from a Letter of Map Revision (LOMR) for his property in 2008, the year he bought it. (See blue notation in floodway map above.) This means the property was likely raised out of the floodway by bringing in fill or moving it from a nearby location.
However, the County and FEMA are in the process of revising flood maps AGAIN in the wake of Harvey. Revisions have not yet been made public and probably won’t be for a year or two. But reportedly, both the 100- and 500-year floodplains are expanding – rumors say by about 50%. That means Mr. Lai’s property could soon be back in the 100-year flood plain. And that may be part of the reason for the sudden desire to sell the property.
Implications for Construction
If reclassified into a different flood zone, different regulations would apply for construction that could raise a buyer’s costs.
After flood map revisions, any buyer of this property would likely be forced to elevate buildings on a pier-and-beam foundation so that water could flow underneath them.
Condos built on adjacent property by Wan Bridge were permitted by the City of Houston because the ground floors were used only for garages. But those permits were issued before flood-map revisions.
Lai’s Kings Harbor property is also on the cut-bank (eroding) side of a large meandering river. If water gets behind the retaining wall, much of his property could wash downstream in the next big flood. (See comparable situation below.)
Bulkhead and Forest Cove townhome destroyed by Harvey upstream from Kings Harbor.
Several people in the townhomes above narrowly escaped with their lives during Harvey. The flood swept several buildings off their foundations.
Erecting condo or townhome units on Mr. Lai’s property, as has been rumored for several years, would be dangerous. Doing so would likely risk the lives of unsuspecting buyers or renters as well as the principle of investors.
Lives and More Lost in Last Flood
Every apartment building, townhome and business for two miles north of Mr. Lai’s property flooded during Harvey. Twelve seniors died at nearby Kingwood Village Estates as a result of injuries sustained during Harvey evacuations or the heartbreak of losing their homes.
I discussed Mr. Lai’s property with a flood expert. The expert almost came out of his shoes. He said, “Who’s going to evacuate all the families in a flood like Harvey? It would be impossible. Those people would be out of luck.”
People love water views so much that they sometimes forget how dangerous floodwaters can be. Buyer beware.
US59 during Harvey. Photo by Melinda Ray.
Posted by Bob Rehak on July 31, 2020
1037 Days after Hurricane Harvey
The thoughts expressed in this post represent opinions on matters of public concern and safety. They are protected by the First Amendment of the US Constitution and the Anti-SLAPP Statute of the Great State of Texas.
https://i0.wp.com/reduceflooding.com/wp-content/uploads/2020/07/Real-Estate-Sign.jpg?fit=800%2C1067&ssl=11067800adminadmin2020-07-31 18:33:592020-07-31 21:27:212.21 Riverfront Acres in Kings Harbor Listed for $1.6 million
County Judge Lina Hidalgo has asked for your opinion on the composition and by-laws of a new Community Resilience Task Force. The purpose of the task force is to make recommendations on how to allocate flood-bond spending to help minorities, low income households, and other socially vulnerable groups … even more.
Argument for Social Vulnerability
The Judge argues that low income households have a harder time recovering from floods. For instance, the inability to repair a flood-damaged home can create health consequences as mold multiplies. The loss of a vehicle can mean the loss of a job and subsequent eviction.
Data Shows Spending Favors Vulnerable Segments 4:1 So Far
Active HCFCD projects in neighborhoods that rank above and below .5 on the CDC’s social vulnerability index. The blue segment represents less affluent, minority neighborhoods, which current have 79% of the active bond projects.HCFCD buyouts in neighborhoods that rank above and below .5 on the CDC’s social vulnerability index. The blue segment represents less affluent, minority neighborhoods.They have 80% of all the buyouts.
Whether you are looking at mitigation projects or buyouts, the most socially vulnerable neighborhoods tend to get FOUR TIMES more than less socially vulnerable neighborhoods.
Yet Judge Hidalgo, Commissioner Ellis and Commissioner Garcia want to increase that percentage even more … for the next 30 years … with their Community Resilience Task Force.
Questions Posed by Lopsided Emphasis
The questions are:
What happens to everyone ELSE who floods?
Will they get NO help?
What is a FAIR and EQUITABLE distribution?
Does the NUMBER of damaged structures not merit consideration?
Will the DISPARITY in spending discourage middle class flood victims and motivate them to leave the county if they flood again?
Why are certain commissioners using the word “equity” to describe “disparity”?
Today is the end of the month and the last day to submit comments to the Judge if you want them to be considered.
Below is a poignant letter written by Jennifer Coulter, a mother with two young children. She and her husband had just started a company before Harvey. So they didn’t have the credit history to qualify for an SBA loan. And their income from the previous year threw them into the lowest category for a Homeowner Assistance Grant. Two years after applying, they’re still waiting for a call-back.
And because they lived outside the 500-year flood plain, they didn’t have flood insurance. Nevertheless, they managed to restore their home by cashing in retirement accounts. They worry now about whether they can afford college for their kids.
Jennifer Coulter’s Letter to Judge
Dear Judge Hidalgo and members of the CRTF,
Please find my public comments and questions below as they relate to the proposed draft bylaws for the Community Resiliency Task Force and the inclusion of social vulnerability guidelines in flood mitigation project considerations.
My family lives in Kingwood. We flooded in Kingwood following Hurricane Harvey, and chose to reinvest in our community by rebuilding our home. We did not have flood insurance at the time of the flood. We also did not quality for an SBA loan. We used retirement savings to fund the rebuild. As a result, our personal financial security has changed dramatically.
The Kingwood and Lake Houston area has historically received a disproportionate amount of flood mitigation project investment related to the greater Houston and Harris County area. Meaning, we have received far less. The proposed social vulnerability guidelines would continue that trend, perhaps even worsening it for this area.
As a family, we have made the difficult decision that if flooded again, we will not rebuild and again reinvest in this community. Without a fair investment in flood mitigation projects based upon flood vulnerability rather than social vulnerability, we are almost certain to flood again.
We are not alone. There are many homeowners, who if able, will relocate out of Harris County if flooded again. My questions to the task force are:
How do you intend to fund this 30-year plan if your tax base leaves?
Is making this vital tax base expendable a wise long-term solution to improve flood mitigation in ANY community within Harris County?
If you are not choosing project allocation based upon engineering and likeliness to flood, how do you intend to redirect flood waters to areas chosen to receive flood mitigation improvements? Do you have a means to tell rising flood waters to only go to those areas that received improvements and not to those that didn’t qualify for improvements because they weren’t socially vulnerable enough?
Thank you for your time, Jennifer Coulter
I know many people like the Coulters. The prospect of more flooding with no mitigation has them at the end of their tethers. Especially after they voted for the flood bond and its promise of equity. One has already moved to Montgomery County.
Contact the Judge NOW
Please email the Judge and tell her that we need more balance in flood bond spending. Do it now! Tomorrow is too late.
Email CRTF@cjo.hctx.net to submit comments. Please be polite and succinct.
https://i0.wp.com/reduceflooding.com/wp-content/uploads/2020/07/SVI-Projects-July-2020.jpeg?fit=1200%2C800&ssl=18001200adminadmin2020-07-30 15:20:232020-07-30 15:20:35Your Last Chance to Register Your Opinion on Disparity in Flood-Bond Spending
The San Jacinto Regional Watershed Master Drainage Plan (SJMDP) partners will host a virtual public meeting on August 13, 2020. The purpose: to provide information about study’s progress, and encourage public participation and input.
Heat map in draft shows where most flood damage has occurred historically by sub-watershed.
Goals of Project
The SJMDP study began in April 2019 to identify flood mitigation projects that can be implemented in the near- and long-term. Their purpose: to reduce flood risks to people and property throughout the San Jacinto River watershed.
The study area includes nearly 3,000 square miles in seven different counties and approximately 535 miles of stream. Overall, the study aims to:
Provide an up-to-date technical basis to identify flooding vulnerabilities
Understand impacts of future growth
Improve flood resiliency within the watershed.
The SJMDP is scheduled for completion in fall 2020.
Community engagement is an important component of the Harris County Bond Program. The partners want your participation as the program is implemented.
Details of Virtual Meeting
The virtual community engagement meeting will be held on:
Or by phone at 855-925-2801 with Meeting Code: 9742
Note: HCFCD says that the “Join Online” link above will convert from a registration to a presentation link on the day of the webinar.
The meeting will begin with a brief presentation to share project updates, followed by a moderated Q&A session with Flood Control District team members.
Residents will be able to submit questions and comments throughout the presentation. Any comments not addressed during the Q&A session will receive a response after the event.
For Those Who Cannot Attend…
The study partners will post a recorded version of the meeting on the Flood Control District’s website and YouTube channel after the event.
For questions, please contact the Flood Control District at 346-286-4152, or complete the online comment form.
You can also mail comments to:
Harris County Flood Control District
9900 Northwest Freeway
Houston, Texas 77092
Attn: San Jacinto Regional Watershed Master Drainage Plan
For more information about the San Jacinto Regional Watershed Master Drainage Plan, visit www.sanjacstudy.org.
For Those with Disabilities
Those with disabilities can make special meeting accommodations. If needed, please contact 346-286-4152 at least 48 hours prior to the meeting.
Project Funding
The SJMDP is jointly funded with 75 percent from the Federal Emergency Management Agency (FEMA) Hazard Mitigation Planning Program and 25 percent from the four local partners: Harris County Flood Control, Montgomery County, City of Houston and the SJRA.
Posted by Bob Rehak on July 30, 2020
1037 Days after Hurricane Harvey
https://i0.wp.com/reduceflooding.com/wp-content/uploads/2020/07/Screen-Shot-2020-07-23-at-10.42.49-AM.jpg?fit=1200%2C930&ssl=19301200adminadmin2020-07-29 21:26:182020-07-30 00:13:57Your Chance to Ask Questions About the San Jacinto Watershed Master Drainage Plan
Harris County Judge Lina Hidalgo, Precinct 1 Commissioner Rodney Ellis, and Precinct 2 Commissioner Adrian Garcia are pushing the idea of a Community Resilience Task Force focused on helping socially vulnerable neighborhoods receive a higher percentage of the $2.5 billion flood bond.
Data obtained from HCFCD via the Freedom of Information Act shows that in Harris County…
…the two most socially vulnerable quartiles are FOUR TIMES more likely to receive a buyout.
HCFCD Buyouts Favor Socially Vulnerable Population 4:1
As of 7/28/2020. Source: Data obtained from HCFCD via FOIA request. Quartiles 3 and 4 are the most vulnerable on the CDC’s Social Vulnerability Index.
Here’s how that looks as a pie chart.
HCFCD Buyouts by SVI Quartile. The two most socially vulnerable quartiles receive 80% of all buyouts.
This is not surprising. For months, Hidalgo, Ellis and Garcia have pushed the District to incorporate the Social Vulnerability Index into its priorities. It has worked.
Do We Need More Balance?
Socially vulnerable neighborhoods get 80% of HCFCD buyouts and 79% of flood bond projects. Do those seem like fair percentages to you?
You can register your opinion from now until July 30th, 2020, via one of the following methods:
Email CRTF@cjo.hctx.net and submit comments digitally, beginning July 21
Join a virtual focus group via Zoom. After registering, participants will receive a confirmation email containing information about joining the meeting.
For more information on the “equity bias,” see this series on “Where Flood Mitigation Dollars Have Really Gone.” It was developed a year ago so the focus is on historical spending.
https://i0.wp.com/reduceflooding.com/wp-content/uploads/2020/07/Pie-Chart-Percent-Buyouts-by-Quartile.jpg?fit=1200%2C802&ssl=18021200adminadmin2020-07-28 23:20:122024-11-19 16:37:47HCFCD Data Shows Socially Vulnerable Zip Codes Receive 80% of Buyouts