One of the largest construction projects currently underway in the Kingwood Area is New Caney ISD’s West Fork High School, south of the HCA Kingwood Medical Center. New Caney ISD provided degrees of completion for all the trades associated with the project as of March 2022.
Athletic fields and structures – 70%
Concrete masonry 65%
Rough electrical – 80%
Rough mechanical – 80%
Rough plumbing – 90%
Insulation – 75%
Windows – 65%
Interior metal studs – 85%
Exterior paint – 50%
Curtain wall – 65%
Exterior storefront – 90%
Concrete paving, parking lot and driveways – 95%
Gas service – 90%
Water service – 80%
Sidewalks – 45%
Interior gypsum board – 65%
Interior paint 20%
Ceramic tile – 10%
Sorters Road storm drain – 90%
Rough grade – 75%
Aerial Photos from 3/13/22
Here’s what that looks like. Aerial photos show the exterior of the main building and athletic facilities rapidly nearing completion.
Looking NE at New Caney ISD West Fork High School. HCA Kingwood Medical Center is white complex in background near horizon.Interior courtyardNew ball fields. US59 runs left to right across top of frame. North is left.Field house, football field and track. Looking east toward US 59.Looking SW toward Sorters-McClellan Road.Runners take your marks. Set. Go!The detention pond will need some erosion repair before this project is done.Sorters-McClellan Road is being expanded to handle the increased traffic. Looking N from over detention pond.Looking S at widening of Sorters-McClellan Road. Note proximity to West Fork and 59 Bridge in background.
Compare with Previous Updates
To see how the project has progressed, compare these previous posts.
https://i0.wp.com/reduceflooding.com/wp-content/uploads/2022/03/20220313-DJI_0800.jpg?fit=1200%2C799&ssl=17991200adminadmin2022-03-15 13:12:272022-03-15 13:12:31New Caney ISD West Fork High School March Construction Update
U.S. Congressman Dan Crenshaw of the Texas Second Congressional District has secured $26.4 million earmarked for six specific flood-mitigation projects in his district. They include:
Appropriations for Interior, Environment, and Related Agencies
$1.6 million for Harris County Flood Control District (HCFCD) for the Taylor Gully channel improvements.
$1.6 million for HCFCD’s Kingwood Diversion Ditch improvements.
$1.67 million for Harris County for the Forest Manor drainage-improvement project in Huffman.
$3.39 million for Memorial City Redevelopment Authority’s detention-basin improvements.
Homeland Security Appropriations
$8.2 million through Federal Emergency Management Agency’s (FEMA) Community Project Funding for the Westador Basin Stormwater Detention Basin.
$9.9 million through FEMA’s Community Project Funding for the TC Jester stormwater detention basin.
Necessary Projects, Not Pork
Kaaren Cambio, District Director for Congressman Crenshaw, pointed out that “Our earmarks were just for necessary flooding projects that the county has not funded.”
Earmarks made a comeback this year for the first time since they were banned in 2010. This Houston Chronicle story points out the pros, cons and restrictions of the new earmark system. The amounts are limited. And representatives can have no financial connection to the projects. The key word is “necessary.” This money is NOT for building bridges to nowhere just to bring money to a district.
The need for the two projects in the Kingwood Area became apparent only after the completion of the Kingwood Area Drainage Study. The projects had not been identified when the flood bond passed.
Kingwood Diversion Ditch Improvements
These improvements will divert stormwater runoff from Bens Branch to lower the risk of structural flooding along the portion of Bens Branch within the Kingwood area. This project will also provide capacity to allow for future neighborhood drainage improvements that outfall into the Diversion Ditch and Bens Branch.
Kingwood Diversion Ditch was originally built with future expansion in mind.
The Kingwood Diversion Channel was constructed with expansion in mind. So HCFCD will only need to acquire minimal additional right-of-way. The project includes:
Channel conveyance improvements
A concrete diversion structure from the confluence at Bens Branch in Montgomery County
A new proposed outfall into the West Fork San Jacinto River.
This project will remove 62 existing structures from the 100-year floodplain inundation area. It will also provide capacity for future drainage improvements that benefit an additional 586 structures – 295 and 291 from along the Diversion Ditch and Bens Branch respectively.
The proposed improvements also provide increased flood protection for Kingwood High School and Saint Martha Catholic School.
Taylor Gully Improvements
An engineering study found the upper portion of Taylor Gully insufficient. Large numbers of structures have flooded upstream of Rustling Elms Drive. This project will restore a 100-year level of service for Taylor Gully from the upper limits of the channel to Maple Bend Drive.
Rustling Elms Bridge over Taylor Gully during peak of May 7, 2019 flood.
The improvements include maintaining the existing top of banks, and constructing a concrete 20 foot by 6 foot (max) low flow channel section. This will remove 387 structures from the 100-year floodplain inundation area. It will also provide capacity for future improvements that could benefit an additional 62 structures.
Forest Manor Project in Huffman
The project would help reduce flood risk for 98 homes. Less than 15% of homes in the subdivision are in the regulatory FEMA 100-year floodplain, yet more than 40% of the homes have reported flood claims in recent years (with 30% consisting of repetitive losses).
Memorial City
The project will improve and deepen an existing detention basin. It will also better connect adjacent roads (Windhover, Westview, Cedardale, and Demaret) with the improved stormwater infrastructure. Stormwater capture will prevent structural and roadway flooding, and reduce non-point source pollutants from flood events. These pollutants result from structural and private property flooding. They include pollutants such as oil, grease, debris, and other contaminants. Without mitigation, these pollutants would end up in Galveston Bay.
TC Jester Detention Basin
This stormwater detention mitigation project will reduce flood damage within the Cypress Creek Watershed. It will retain storm runoff, and reduce floodplain width and depth. Approximately 2689 structures are currently at risk of riverine flooding during a 100-year rain. This proposed project will capitalize on an existing Harris County detention pond with an additional 0.18 acres of wetlands to create a basin footprint of 25 acres. The proposed project will capture overbank flooding so that water elevation in a 100-year storm does not exceed 0.49 feet. This proposed project will remove 87 structures from the existing 100-year floodplain. When complete, the full detention basin will remove 271 structures from the floodplain.
Cypress Creek Westador Basin
The Cypress Creek Westador Stormwater Detention will significantly reduce flood risk, the floodplain, and water levels. Phase I will be functionally independent of this multi-phase project and will remove 128 structures from the existing 100-year floodplain.
Thanks to Crenshaw and Staff
Many thanks to Congressman Dan Crenshaw and his staff. These projects will make a difference for thousands of people who have flooded repeatedly.
Posted by Bob Rehak on 3/14/22
1658 Days since Hurricane Harvey
https://i0.wp.com/reduceflooding.com/wp-content/uploads/2020/10/RJR_4304.jpg?fit=1500%2C1000&ssl=110001500adminadmin2022-03-14 15:43:432022-03-14 15:50:25Crenshaw Secures Funding for Local Flood Mitigation Projects
Then there’s the question of demolition of the old school and reconstruction of the athletic fields where the old school now stands. None of that can happen until contractors finish the new school. But even if that runs past August, it shouldn’t impose any additional hardships on students. After all, they’ve done without athletic fields for the last two school years.
Construction Pics Show Status as of Mid-March 2022
Construction started on the east and has been working toward the west for more than a year now. Here’s how the westernmost building looks as of 3/13/22. It is the least finished. As you can see, additional exterior work remains on the roof, glass, and entries.
Virtually all glass appears to be in as of mid-March 2022, but not the frames that seal it.Workers still have materials left on several of the roofs.The new back entry will provide pickup and drop-off points, relieving traffic congestion on surrounding streets.This temporary detention pond in the foreground will be replaced by……a new permanent detention pond where the parking long in the foreground is.The old school (right) must still be demolished.New athletic fields will be built on the site of the old school.
Once a building like this has been “dried in,” subcontractors can work on the interior 24/7 if necessary to make up for lost “weather days.” Interior trades include drywall, plumbing, electric, lighting, ceilings, paint, floor coverings, cabinets and other finish work.
Compare Current with Previous Pics
See the progress of work to date by comparing these pictures with those taken in previous months.
Here’s Humble ISD’s webpage on the project. It shows artist’s renderings of many of the interior areas not visible in these pictures. It will feature larger classrooms, more space for collaboration, natural light, and easier pickup/drop-off.
Careful reading of the Humble ISD copy will reveal that they have not yet promised which month in 2022 students will move from the old to the new Kingwood Middle School. However…
With each passing month, I get more excited about this project. It will make a wonderful addition to Kingwood and has the potential to become a community showcase.
Posted by Bob Rehak on 3/13/2022
1657 Days since Hurricane Harvey
https://i0.wp.com/reduceflooding.com/wp-content/uploads/2022/03/20220313-DJI_0816.jpg?fit=1200%2C799&ssl=17991200adminadmin2022-03-13 17:42:272022-03-13 17:49:54New Kingwood Middle School Scheduled to Open in Months
By accident, I stumbled across some powerful historical flood loss visualization tools on Harris County Flood Control’s MAAPnext site today. They can help you understand the capricious nature of storms as well as political claims about which neighborhoods flood the most.
About MAAPnext
In 2019, using two FEMA grants and Flood Bond money, Harris County Flood Control District launched its MAAPnext project. MAAP stands for Modeling, Assessment and Awareness. The goal: to use new methodologies and technologies to improve understanding of flood risks throughout Harris County. The project goes far beyond updating Flood Insurance Rate Maps in the wake of recent storms. It also includes:
Interactive historical flood loss visualization tools
Water surface elevation change grids (maps showing difference between effective and revised floodplains)
Flood depth grids (for various flood frequencies including 10%, 4%, 2%, 1% and 0.2% annual chance events)
Percent annual chance grids (giving you your exact probability of being flooded within a mapped floodplain)
30-Year chance grids (showing your home’s exact chance of flooding within the life of a 30-year mortgage)
Water surface elevation grids (showing the water surface elevation in various flood frequencies)
Not all of these maps have been released yet. For instance, MAAPnext/FEMA will release new preliminary flood insurance rate maps for public comment this fall. However, I did find three fascinating interactive maps showing the history of flood losses in Harris County.
Historical Flood Loss Tools
Cumulative Losses since 1978
The first map provides a visual representation of where all flooding claims have occurred throughout the county since 1978. A property’s flood risk can be a influenced by many factors but it’s important to remember that it can flood anywhere in Harris County. The darkest areas have the most cumulative flood losses. The lightest areas have the least.
Total flood losses in various census tracts within Harris County since 1978.
To understand exactly WHERE and WHEN these flood losses happened, you need to go to the next two series of maps.
Historical Inundation Map
The Historical Inundation Map shows the extent of flooding in five different major storms since 2015. These include only streams with gages, not all Harris County channels. Zoom and scroll into an area of interest and then select the storm of interest from the layer menu.
Extent of flooding along the West and East Forks in the Memorial Day 2016 flood.
You can toggle layers rapidly to see how floods compared to each other.
Flood-Loss History by Event
The map above shows the spread of flood waters in various events. However, to see the relative damage in census tracts, you need to go to the map called “Flood Loss History by Event.” Again, you’ll need to toggle layers to select the event of interest. The darker the colors, the more damage.
Tax Day 2016 Storm Damage
Selecting the Tax Day 2016 layer shows that most damage from that storm occurred in NW Harris County.
Hurricane Harvey 2017 Damage
Selecting the Harvey layer shows that that storm affected the entire county with some watersheds experiencing more losses than others.
Imelda 2019 Damage
Distribution of damage in Harris County from Tropical Storm Imelda
For More Interactive Exploration…
The four maps above only scratch the surface of what you can find on the MAAPnext site. To explore the distribution of damage in various storms, visit the page called Understanding Your Flood Risk.
Media accounts of major storms might lead you to believe that major storms affect all parts of the county equally. But they don’t. Who floods depends on upstream rainfall totals, dam releases, proximity to floodplains, development regulations, elevation above the flood plain and more.
The most interesting aspect of MAAPnext is that it will eventually incorporate all of these factors and give you an individual risk rating for your property or one that you are considering buying.
If knowledge is power, this is power cubed, because it let’s you look at flood risk in multiple dimensions.
Be Patient
I can’t wait until the project is fully finished. Check back often and click around this site as new features seem to be bolted on periodically. The bolted-on comment relates to my only complaint. All information (and there’s a lot of it) is grouped under five pages in ways that are rarely intuitive and often invisible from the highest levels. For instance, to get to the historical flood loss maps, you have to:
Click on the home page
Click on a link embedded in one of the visuals called “Flooding is Our #1 Disaster.”
It will take you to a page called (strangely enough) “Understand Your Flood Risk.”
Scroll down past 7 other topics to the bottom of page to find the interactive maps.
Presumably, helping people understand their flood risk is the most important objective of this site, but the page by that name appears nowhere in navigation. That said, have fun exploring. You’ll find many other hidden gems on this site.
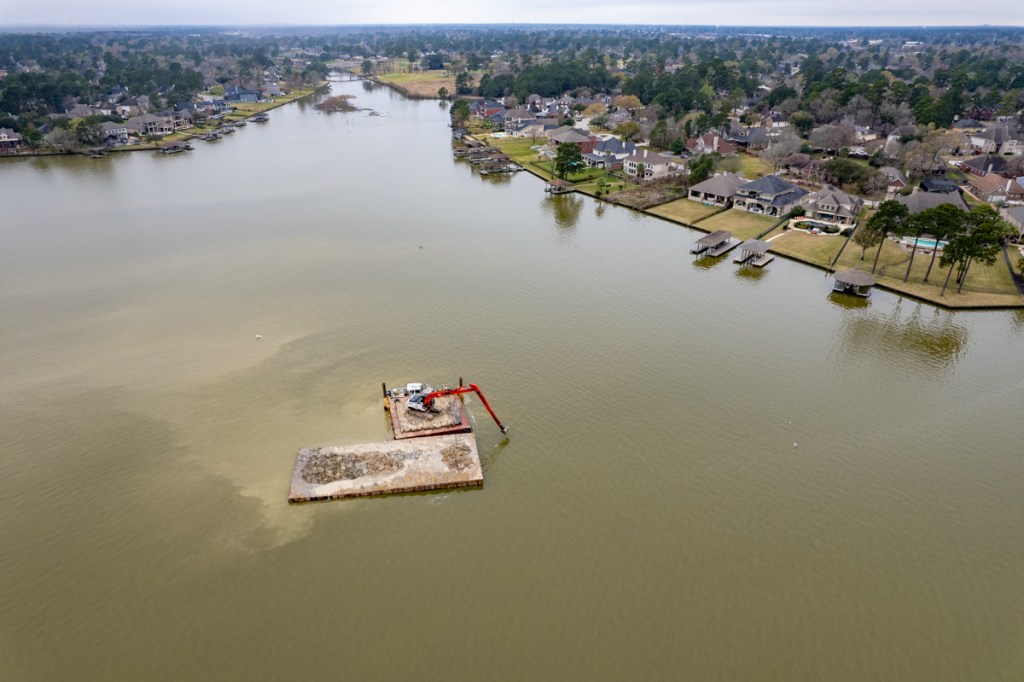
I went back to see how much of the mouth bar remained this morning and was shocked. The two dredges are still sitting far offshore, approximately where they were on March 1.
Here are several pictures that show their position this morning, 3/11/22.
Looking west from the mouth of Rogers Gully toward the dredges about a quarter mile away and the eastern shore of Lake Houston in the background.Reverse angle. Looking over one of the two dredges toward the mouth of Rogers Gully.
Curious about why the dredges were working so far out, I asked State Representative Dan Huberty “Why?” Huberty, who secured money for the dredging, texted back a one-line answer.
“Can’t get into Rogers Gulley without dredging their way in.”
It’s been almost two weeks since they started working here. And this area is far wider than the Royal Shores channel. Rogers Gully has apparently formed a wide and long “underwater” delta that extends far beyond the above-water portion.
So in answer to the question in the headline, “How blocked up is Rogers Gully?” It’s baaaad.
https://i0.wp.com/reduceflooding.com/wp-content/uploads/2022/03/20220311-DJI_0742.jpg?fit=1200%2C799&ssl=17991200adminadmin2022-03-11 16:22:472022-03-11 16:24:20How Blocked Up Is Rogers Gully?
The mini homes at the Preserve at Woodridge are going up mighty fast. These homes are so close together that you could literally pass the ketchup from the window of one to another.
Construction Update as of 3/10/22
While most new occupants fret over wall colors, these occupants will get their choice of roof colors: gray, reddish gray or bluish gray.
Life here will have some other advantages for renters, too. You’ll certainly get to know your neighbors faster than you would in a development with massive quarter-acre lots.
Plus, these quaint-as-dorm-room rental homes certainly make efficient use of land. Mowing the lawns will take even less time than vacuuming. And with on street parking, you’ll never have to worry about cleaning out the garage.
Have a habit of rolling out of bed late? You could be three steps from your car door. The sign at the bottom of the frame says, “Individual homes for lease. PreserveAtWoodridge.com. Opening Summer 2022.” However, the website says Spring.Looking east toward Kingwood Park High School.
Dogs Welcome, but Tree Space Limited
I’m told they plan to have at least six trees scattered throughout the 131 homes that will be built on roughly 12 acres. Pets are welcome according to the website, but the marketing director reportedly worries about “the male dog-to-tree” ratio. They don’t have extra trees in the budget. So they’re planning on putting in plenty of fire hydrants.
Looking west toward St. Martha Catholic Church.
All the Modern Amenities, Including Concrete
These lilliputian homes reportedly come with all the modern amenities, including indoor plumbing. The decorating allowance even covers a daisy near the front door.
While many people look for green solutions to flooding these days, the Preserve at Woodridge is unashamedly gray. “Who needs green space when you have all this beautiful low-maintenance concrete?” quipped one contractor who spoke on the condition of anonymity. “It’s very consistent with today’s busy lifestyles.” He does have a point!
But I worry there won’t be enough counter space for residents to put their jewelry boxes and laptops on in the event of a 100-year flood, which seems to happen every other year around here.
The City of Houston is launching its “Equity Indicators” project by asking for your comments to one important question: What makes a community equitable?
Reflecting Houston’s Diversity
Houston is the most diverse city in the nation, but despite the strength of our diversity and multiculturalism, Houstonians experience vast racial and ethnic disparities. The Equity Indicators Project will facilitate broader conversations on equity and inclusion, take active steps to measure disparities, and have leaders across multiple sectors be held accountable for taking action to increase equitable outcomes for all Houstonians.
The city is seeking feedback from community members to ensure that this project is reflective of Houston’s diversity and multiculturalism. Visit houstontx.gov/equity to share your thoughts on what makes a community equitable between March 6 until April 2.
“In a city where 146 languages are spoken, we must use every tool possible to ensure that every Houstonian’s voice is being heard,” said Mayor Sylvester Turner. “This survey is a direct, impactful way to participate in making the city, its services, and its opportunities more accessible to people regardless of their background.”
File Photo: Houston Mayor Sylvester Turner speaking at the Kingwood Community Center
Project Sponsored By…
The Equity Indicators project is led by the Planning and Development Department, Mayor’s Office of Resilience and Sustainability, and Complete Communities, and ties to the vision and framework for a resilient community outlined in the Resilient Houston strategy. The city has partnered with Rice Kinder Institute for Urban Research using the methodology developed by CUNY- Institute for State & Local Governance to focus on key indicators for equity in Houston. The Shell Foundation has funded this initiative that focuses on six themes:
Economic opportunity
Health
Public Safety
Environmental and Climate Risks
Built Environment
Access and Inclusion
How Data Will Be Used
The data analysis will result in an overall Equity Indicators Score for the City of Houston. The public, city departments, city programs, and community service organizations can track the score to document progress and change over time. The numerical value is based on a 100-point scale. A high score signifies Houston’s level of success toward building an equitable city, whereas a low score represents a high level of inequity and more opportunity for improvement.
For More Information or Printed Survey…
A printed survey card will also be available at city locations. Houstonians with questions or needing assistance filling out the survey may call 832-393-6637. For more information, visit Equity Indicators online atwww.houstontx.gov/equity.
Thought Starters: Aspects of Equity Measured by Various Indices
It seems everybody has a way to measure equity these days. Without trying to influence your opinion, I would simply reprint this list of indexes compiled by the Brookings Metropolitan Policy Program.
Posted by Bob Rehak on 3/9/2022 based on a press release by COH and info compiled by Brookings
1653 Days since Hurricane Harvey
https://i0.wp.com/reduceflooding.com/wp-content/uploads/2020/02/20191017-RJR_3755.jpg?fit=1200%2C800&ssl=18001200adminadmin2022-03-09 18:59:002022-03-09 19:01:40City Seeks Your Feedback on Equity Indicators Survey
About a half block west of Kingwood High School, G-103-36-03, a small drainage ditch without a name, cuts under Kingwood Drive. More than a hundred homes near this ditch flooded during Harvey. Before Imelda, Harris County Flood Control District did an emergency “de-snag” on the ditch. That means they cleaned out fallen trees that were forming “beaver dams” and backing water up.
But the right of way under Kingwood Drive has remained about half blocked by sediment. That’s what those red warning signs represent in the picture below. Clearing the right of way is the City of Houston’s responsibility.
When I clicked on the upper warning sign, I found a link to this image from 2019.
Sediment and vegetation half blocking twin culverts under Kingwood Drive in 2019.Photo by HCFCDlooking south from north of westbound lanes.
Pictures Taken Today Show Same Blockages
Here’s how the same scene looked on 3/8/22.The ditch stops before it even reaches the culvert.Closer shot of same culverts shows sediment and vegetation blocking culvert entrances.Still looking south, but across the median toward the eastbound lanes.Looking north from eastbound lanes at sediment and vegetation blocking the ditch as it goes through the median of Kingwood Drive.
I’ve brought this issue to the attention of Mayor Pro Tem Dave Martin and his staff. I’m confident this was just an oversight and look forward to doing another positive story when they complete this job, too.
Posted by Bob Rehak on March 8, 2022
1652 Days since Hurricane Harvey
https://i0.wp.com/reduceflooding.com/wp-content/uploads/2022/03/20190523-attachment1.jpg?fit=1200%2C675&ssl=16751200adminadmin2022-03-08 16:39:012022-03-08 16:42:10Next Challenge For City: Ditch Clean Out in Right of Way Under Kingwood Drive West of High School
Today, I came across an eye-popping presentation by John Blount, P.E.. Blount served as Harris County’s Engineer for decades. He left his position last year after serving the Engineering Department for 34 years. The presentation discussed how new building regs adopted in 2009 (and later amended) reduced damage rates during Harvey by approximately 20X.
Bount’s report, however, pointed out that – at the time of Harvey – 75,000 homes had been built in subdivisions developed in 2009 or later that conformed to the new, more stringent building codes. These homes were in subdivisions that used current infrastructure requirements for drainage and extreme event-flow analysis. Out of those 75,000 homes, only 467 flooded during Harvey, or 0.6%. That’s 20X less than 12%.
But even more impressive, Blount said that not one of those homes suffered substantial damage.
Factors that Made the Difference
After that, Blount’s 22-page presentation gets fairly technical. It deals with regulations that affect:
Elevation above the 100-year flood plain
Acceptable types of foundations in flood hazard areas
Building in floodways including width, depth, bracing and other construction requirements for piers
Where fill can and cannot be used
Detention pond requirements
Coordination with MUDs and Special Districts
Coastal vs. Riverine Flooding
Wind resistance
Elevation above street level and more
Photos reflect changing standards for building in floodways.
Driving around town after reading this report will be an eye-opening experience. Take any one of the factors mentioned above, for instance, elevation above street level.
As I was driving through Aldine last weekend to photograph the new detention basin along Halls Bayou, I was struck by how many homes, businesses, and apartment complexes were built several feet BELOW the street levels.
Page 12 of Blount’s presentation addresses this issue. “If the structure is a single family residence the finished floor shall be a minimum of 12 inches above the highest adjacent natural grade when measured 10 feet from the edge of the slab or 12 inches above the crown of the adjacent street whichever results in the highest elevation.”
Drive down Aldine Bender Road or Aldine Mail Route and look at the driveways that slope DOWN to properties. No wonder so many homes in this area flood.
Posted by Bob Rehak on 3/7/2022 based on a report by the former Harris County Engineer John Blount
1651 Days since Hurricane Harvey
https://i0.wp.com/reduceflooding.com/wp-content/uploads/2022/03/20220307-Screen-Shot-2022-03-07-at-6.45.35-PM.jpg?fit=1200%2C522&ssl=15221200adminadmin2022-03-07 19:07:272022-03-07 19:07:31How New Building Regs Cut Damage Rates During Harvey by Roughly 20X
Last week, the City of Houston started clearing debris from the culverts under Kingwood Drive near Kingwood High School. Local flood-fighter Chris Bloch has been working for years behind the scenes to document drainage issues such as this one and convince local officials to address them.
Un-named and Long-Forgotten Tributary Finally Getting Attention
One of Bloch’s latest investigations has been an uncatalogued and long-ignored channel under Kingwood Drive. It helps drain Kingwood High School into Bens Branch. But it doesn’t show up anywhere on Harris County Flood Control District maps.
Two Feet of Sediment Block Culverts Under Kingwood Drive
Bloch says, “The channel originates at Kingwood High School’s athletic fields. The ditch is narrow and full of sediment and vegetation. Side channels, which empty into this ditch, are also full of sediment and vegetation. This is the only ditch providing storm water drainage from the high school campus.”
The ditch in question passes through three culverts under the Westbound lanes of Kingwood Drive. They are obstructed by 24 inches of sediment and debris. See below.
Blocked culverts under Kingwood Drive are finally being cleared.Photo courtesy of Chris Bloch.
“Debris indicates stormwater runoff from the campus passes over Kingwood Drive due to the poor conveyance capacity of this ditch.”
Chris Bloch, Kingwood Resident and Retired Engineer
“If cleared of sediment, the cross section area of the three culverts would total 60 square feet.“
More Blockages Downstream
After crossing under Kingwood Drive, the ditch funnels water into a 24-inch corrugated plastic culvert. That carries it across the Kingwood Country Club Driving Range. “This cross-sectional flow area of this culvert is only about 5% of the total area of the three culverts that pass under Kingwood Drive,” says Bloch.
Later, as the ditch crosses two fairways on its way to Bens Branch, sediment and vegetation again partially block it. They also partially block the three culverts under Centerpoint’s easement near Bens Branch.
Bloch believes, “Maintenance and improvement of this ditch upstream of these outfalls would significantly improve drainage of the high school campus.”
Ensuring Long-Term Maintenance
“Although the Harris County Flood Control District (HCFCD) has no property rights for this channel, the District may be willing to partner with property owners to improve drainage,” says Bloch. “The original channel was reported to have been installed by Humble ISD (HISD) prior to the existence of the driving range.”
Bloch says he has been communicating with HISD, HCFCD and the City of Houston about the poor condition of this ditch since 2020. “I recently communicated with Mayor Pro Tem Martin’s office about this ditch and spoke with Mayor Pro Tem Martin himself about it. The de-silting is another small step forward for flood mitigation in Kingwood. I appreciate the involvement of Mayor Pro Tem Martin.”
“Recently, HCFCD indicated they would be willing to partner with the property owners of this ditch to improve drainage. Hopefully, once the City completes the sediment removal of the channel on the Kingwood Drive right of way, HISD and the Country Club can get together with the HCFCD to improve drainage across the Country Club property to Bens Branch,” says Bloch.
Posted by Bob Rehak with thanks to Chris Bloch and Mayor Pro Tem Dave Martin
1650 Days since Hurricane Harvey
https://i0.wp.com/reduceflooding.com/wp-content/uploads/2022/03/20220306-Screen-Shot-2022-03-06-at-3.41.40-PM.jpg?fit=1200%2C799&ssl=17991200adminadmin2022-03-06 16:49:082022-03-06 16:49:11City De-Silting Channel Under Kingwood Drive Near High School