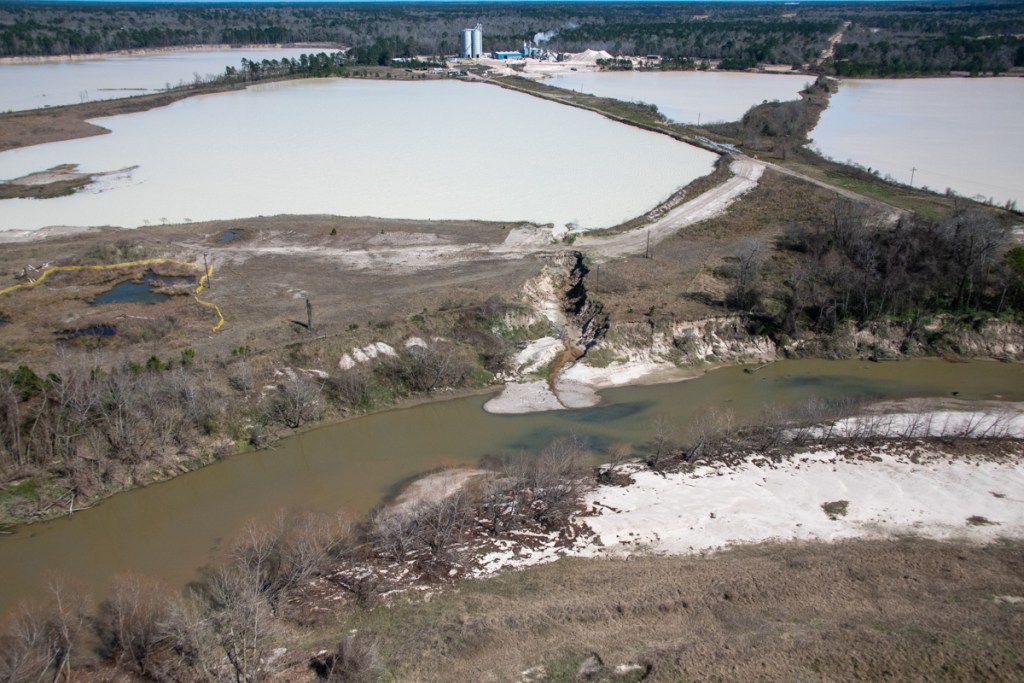
A 7.5-acre point bar outside a San Jacinto West Fork sand mine has disappeared, the apparent victim of river mining. River mining is prohibited in many countries because of its dangers. Texas does not prohibit it, but taxes it at a higher rate than floodplain mining to discourage the practice. The dangers include:
Upstream and downstream erosion
Destruction of riverbanks and river properties
Undermining infrastructure (such as bridges and pipelines)
Location of River Mining on West Fork Just South of Highway 99
No Permits on File With Key Regulatory Bodies
A check with the San Jacinto River Authority (SJRA), Texas Commission on Environmental Quality (TCEQ), and Texas Parks and Wildlife Division (TPWD) showed the following:
TPWD says they know of “no permits for stream bed excavation along the San Jacinto River.”
A TCEQ investigator has spoken to the Texas Parks & Wildlife Department (TPWD) Wetlands Conservation Program. “If the facility is digging in or very near the water’s edge,” said the TCEQ’s Jonathan Walling, “the facility would most likely need a permit from TPWD.”
Tom Heger of TPWD said Montgomery County Parks & Wildlife officials are investigating.
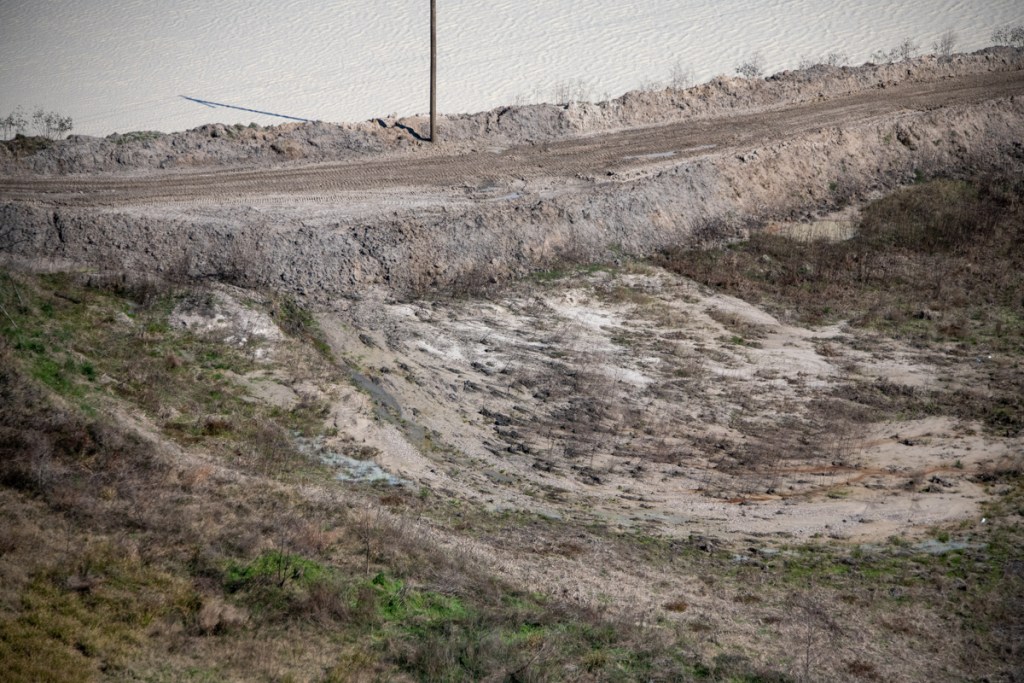
Compare the satellite image above to the shots below. Google Earth measurements show the sand bar that no longer exists was bigger than most of the pits in the mine itself.
Looking downriver, you can still see outlines of point bar and marks from excavator.Close up of marks left by teeth of excavator.Looking toward West Fork where point bar used be. Vehicle tracks lead back to mine behind camera position.Pits created in the river.Relationship of river mining to flood plain mine in background.Well-used road between excavation and mine.The disappearance of sand is not because of the seasonal release of water from Lake Conroe.Hundreds of bars both up and downstream appeared normal.Google Earth shows the river to be approximately 350 feet wide at this point.
If the stream is perennial (flows most of the time), or is more than 30 feet wide between the banks (even if it is dry most of the time), the State claims the bed and the sand and gravel in it as State-owned.
A permit from the Texas Parks and Wildlife Department is required to “disturb or take” streambed materials from a streambed claimed by the State.
According to TPWD, the operator did not have a permit. In fact, no one on the entire San Jacinto river has a permit, according to TPWD.
How River Mining Degrades River Beds/Channels: Academic Insights
…bed degradation occurs when mineral extraction increases the flow capacity of the channel. A pit excavation locally increases flow depth and a barskimming operation increases flow width. Both conditions produce slower streamflow velocities and lower flow energies, causing sediments arriving from upstream to deposit at the mining site. As streamflow moves beyond the site and flow energies increase in response to the “normal” channel form downstream, the amount of transported sediment leaving the site is now less than the sediment carrying capacity of the flow. This sediment-deficient flow or “hungry” water picks up more sediment from the stream reach below the mining site, furthering the bed degradation process.
The mine owners could not be reached for comment. Their phones went unanswered, perhaps because of the COVID crisis.
Posted by Bob Rehak on 4/23/2020
968 Days since Hurricane Harvey
The thoughts expressed in this post represent opinions on matters of public concern and safety. They are protected by the First Amendment of the US Constitution and the Anti-SLAPP Statute of the Great State of Texas.
https://i0.wp.com/reduceflooding.com/wp-content/uploads/2020/04/20200421-RJR_0918.jpg?fit=1200%2C800&ssl=18001200adminadmin2020-04-23 18:23:222020-04-23 19:54:37TPWD Investigates River Mining Without Permit on San Jacinto West Fork
Mine process wastewater flooding neighboring properties in upper right. Picture taken Jan 20, 2020.Mine process wastewater flooding neighboring properties in foreground. Picture taken Feb. 13, 2020.Triple PG wastewater on neighboring properties on March 6, 2020. See water in strip of trees in front of stockpile.
TCEQ Report on Compliance Investigation
TCEQ observed process water outside Triple PG’s property boundary and concluded, “The allegation of a discharge of process water was confirmed. As a result of the investigation conducted on March 11, 2020, one alleged violation was noted for failure to prevent the discharge of process water.” That was the fourth such finding in five years for the mine.
TCEQ says in part, “Because process water was located outside of the facility’s property boundary with a high likelihood to enter waters of the state, an unauthorized discharge had occurred.”
676% Higher Levels of Suspended Sediment than Creek Water
Wastewater was overflowing from Ponds Five and Six. Analysis of water samples showed that the overflow had levels of suspended solids in it that were 137% to 676% higher than the background level found upstream in White Oak Creek. That’s more than 2X to almost 8X above the creek water.
Discharge Not Authorized
Both TCEQ rules and the terms of the injunction prohibit any discharges of process water not authorized by the TCEQ.
The Notice of Enforcement issued by the TCEQ on 4/3/2020 cites, “Unauthorized discharge of process water: Specifically, during the investigation conducted on March 11, 2020, process water was noted outside the property boundary of Triple PG Sand Development Facility with the likelihood to enter waters of the state.”
Recommended corrective action? TCEQ simply says, “There shall be NO unauthorized discharge of pollutants.”
Additional Fines Possible
The Texas Water Code Section 7.102 allows fines up to $25,000 per day for each day of a continuing violation. See flooded neighboring properties above in January, February and March flyover photos.
That water was building up and flooding adjoining properties for at least three months. This could get expensive for Triple PG!
The Attorney General’s office did not respond yet to a request for comment about the type of penalties that it would seek, if any.
Fourth Unauthorized Discharge in Last Year
TCEQ has conducted eight other investigations at Triple PG in the previous 5 years. They included investigations into:
Failure to renew their registration
Alleged failure to maintain pollution prevention measures and controls
Failure to maintain a Stormwater Pollution Prevention Plan (SWP3)
Unauthorized discharge of process water (three times since May 2019)
This makes the fourth citation for unauthorized discharges in a year.
Editorial Comment: This mine just doesn’t seem to take the TCEQ, Attorney General, State of Texas or the health of their neighbors seriously. I hope the Attorney General shuts them down.
Posted by Bob Rehak on 4/6/2020
951 Days after Hurricane Harvey and 200 after Imelda
The thoughts expressed in this post represent opinions on matters of public concern and safety. They are protected by the First Amendment of the US Constitution and the Anti-SLAPP Statute of the Great State of Texas.
https://i0.wp.com/reduceflooding.com/wp-content/uploads/2020/03/20200306-RJR_0052.jpg?fit=1200%2C800&ssl=18001200adminadmin2020-04-06 18:39:052020-04-06 20:36:51TCEQ Alleges Fourth Unauthorized Discharge in 10 Months at Triple PG Mine
The EPA has suspended normal enforcement of air and water pollution rules during the corona virus epidemic. Critics fear it could cause more deaths. They also fear that rules forced through during the emergency could hamper future pollution control efforts. Specifically, a new, broadened rule would limit use of research based on confidential health information in regulatory decisions.
Full Text of EPA Memo
This 7-page memo from the EPA outlines the new policy. It says, the EPA will “generally not seek stipulated or other penalties for noncompliance…” The thrust of the memo: EPA is counting on industry to self-report violations. If violations relate to worker shortages due to the virus, EPA will not seek penalties. EPA will also give offenders time to remedy the situation.
Reaction from Interceptor
Sharon Lerner writes in The Interceptor that “EPA IS JAMMING THROUGH ROLLBACKS THAT COULD INCREASE CORONAVIRUS DEATHS.” The article cites the case of a Pasadena refinery exceeding benzene emission limits. It also cites problems in St. Johns, Louisiana. St. John reportedly has the highest cancer risk from air pollutants in the country. Area residents are routinely exposed to dozens of air pollutants, including the carcinogen chloroprene.
Residents worry that their weakened immune response from the chemicals will make them even more susceptible to the virus.
Review by New York Times
Lisa Friedman writes in The New York Times that “E.P.A., Citing Coronavirus, Drastically Relaxes Rules for Polluters.” The EPA, says the article, will focus during the outbreak “on situations that may create an acute risk or imminent threat to public health or the environment” and said it would exercise “discretion” in enforcing other environmental rules. In other words, they will focus primarily on the worst cases.
Ms. Friedman interviewed former EPA administrators. Gina McCarthy, who led the E.P.A. under the Obama administration and now serves as president of the Natural Resources Defense Council, called it “an open license to pollute.” Cynthia Giles, who headed the E.P.A. enforcement division during the Obama administration, said: “This is essentially a nationwide waiver of environmental rules. It is so far beyond any reasonable response. I am just stunned.”
A current spokesperson for the EPA, Andrea Woods, disagreed. “For situations outside of routine monitoring and reporting,” she said, “the agency has reserved its authorities and will take the pandemic into account on a case-by-case basis.”
Protest by 21 Environmental and Watchdog Groups
Meanwhile, Rebecca Beitsch reports in The Hill that “Coalition petitions EPA for disclosure as agency OKs suspension of environmental monitoring.” She says, “Environmental groups have characterized the memo as a license to pollute, as companies will not have to submit regular reports to the EPA showing they are not violating environmental laws.” She cites a petition spearheaded by the Natural Resources Defense Council which was signed by 21 environmental and watchdog groups. “We fully appreciate the disruption and harm caused by the COVID‐19 pandemic. But EPA’s unprecedented non‐enforcement policy creates a clear opportunity for abuse,” states the petition.
LA Times Reports on Reaction by California Officials
The Los Angeles Times reports in an article by Susanne Rust, Louis Sahagun and Rosanna Xia. “Citing coronavirus, EPA suspends enforcement of environmental laws.” The LA Times article focuses on the response of California officials. “The severity of the COVID-19 crisis should not be used as an excuse by the EPA to relax enforcement of federal environmental laws designed to protect public health and safety,” said Serge Dedina, mayor of Imperial Beach. His city, on the Mexican border, is under constant siege from pollution. “This crisis has only underscored why protecting public health and safety and our environment is more critical than ever.”
Is EPA Using Crisis as Cover to Make Concessions to Polluters?
Vox in an article by By Zeeshan Aleem claimed that “The EPA appears to be using coronavirus to make huge concessions to polluters.” It says the rule will remain in place indefinitely. And it gives factories, power plants, and other major polluters tremendous discretion. Now they can decide whether or not the coronavirus will prevent them from meeting legal requirements on air and water pollution and hazardous waste management. “Many experts and environmental advocates say that while case-by-case relaxation of rules for companies that are short-staffed due to the pandemic makes sense, the expansiveness of the EPA’s directive appears both unprecedented and designed to give a green light to polluters to act recklessly at a time when air quality is acutely important for public health.”
The list goes on. A google search returned 11,800,000 results.
Will TCEQ Follow EPA Lead?
To say this is controversial would be an understatement.
At the very time when people’s lives and health are threatened by the virus, the EPA is dialing back enforcement of pollution rules that protect their lives and health.
At best, you could characterize the reaction to the new rule as “practical” given new constrictions we all operate under.
Triple P.G. Sand Development LLC appears to have violated provisions of an injunction by dredging before its trail and flooding neighboring properties with industrial waste water.
In part, the injunction stipulated that the defendant shall:
Not conduct any dredging operations at the Facility.
Not engage in any operations at its Facility that discharge process wastewater, nor shall Defendant engage in any operations at the Facility that produce process wastewater that must be discharged off Defendant’s property without express prior approval from TCEQ.
Immediately and permanently cease and prevent all discharges of any Industrial Waste and/or Process Wastewater from the Facility into or adjacent to waters in the state.
Not allow any discharge of water that is in or has ever been in the Facility’s Dredge Ponds without the express prior approval of TCEQ.
Aerial Photos Show Potential Violations
The aerial photos below show that within eight days of agreeing to the injunction, the mine started pumping process wastewater OVER BERMS into a pit that then overflowed onto the property of adjoining landowners and lands adjacent to White Oak Creek.
Before showing you the photos, let me show you a satellite image that helps illustrate the relationship between the different elements of this report.
Overview of mine, area drainage and adjoining properties in Montgomery County. Note the location of the mine’s stockpile in the satellite photo above for orientation when viewing the photos below. Brownish creek to right of mine is Caney Creek. Blue line shows approximate path of White Oak Creek through forest. Red oval shows adjoining properties in area of interest. Solid red line shows ditch around perimeter of mine. Green lines show approximate locations of breaches in Attorney General’s lawsuit.
Water pumped out of the mine’s wastewater pond is now flooding neighboring properties within the red oval that he does not own. The mine also dug a ditch around the perimeter of its property (solid red line) through dense forest that channels the process wastewater toward White Oak Creek (solid blue line) and the wetlands along it. It’s not clear, though, whether the wastewater has actually entered the creek yet; the forest canopy limits visibility. Regardless, the injunction says they can’t discharge waste adjacent to waters of the state.
No Flooding That Lasted Months of Adjoining Properties Until Injunction
None of the historical satellite images in Google Earth dating back to 1989 show flooding in the red oval. Some of the properties in the red oval lie in the 100-year flood plain. However, there has been no widespread flooding in this area since Imelda on September 19, 2019.
Nor has there been prolonged flooding as far as I can determine. Photos taken of this exact location on 9/27/2019, ten days after Imelda, show no flooding of the adjacent properties. Likewise, the property was not flooded on 9/14/2017, two weeks after Harvey. I can find no evidence that this area has ever flooded for months before.
Looking south toward stockpile in background. Properties in the forested strip do not belong to Guniganti. On 9/27/2019, ten days after Imelda, they showed no flooding.
For months, I’ve been watching waste water build higher and higher in the area above until it overflowed the pit and invaded neighboring properties. That made me curious and prompted a review of thousands of aerial photos. Here’s what I found.
Photos Taken In November Before Injunction Show Neighboring Land Still Not Flooded
The neighboring properties were NOT flooded on November 4, 2019 (before the injunction). Notice the level of water in the foreground pit – higher than after Imelda, but still waaaay short of overflowing.
Think of the November 4th photo below as the “before” shot. Compare it with other photos below taken from December through March 2020.
Properties in the red oval are between the pit in the foreground and stockpile in background. Note level of water in pit.Photo taken November 4, 2019, looking south.The mine’s process waste water enters the pit immediately to the left of the trees.
After Injunction, Mine Starts PUMPING Waste Water OVER Dike
Eight days AFTER the injunction, on December 3, 2019, I flew over the mine again. I noticed that the mine was pumping water out of its main waste water pond and into the pit in the photo above. But the pit had not yet overflowed. Here’s how the pumping looked. (Note: You can even see the pumping from outer space if you zoom in on this area within Google Earth and look at the Dec. 1 satellite image.)
Close up of pump taken on 12/3/2019. The pumping operation can also be seen in Google Earth satellite photo dated 12/1/19.
On January 20, Pumping Continues From Different Location
I flew over the mine again on January 20, 2020; the pumping from and into the same pits continued – but from a different location.
Looking West. Notice the line running from the arc in the wastewater pond (diagonally from center to lower right).Looking south. The same line dumps water into the trench (bottom left). The trench then carries the water south (toward the top of the frame) to fill the pond next to the stockpile and flood adjoining properties with waste water.Looking SE. Here’s what it looked like closer up. Notice the waste water extending into the tree line and ending at the stockpile (upper right). The same pond that had plenty of excess capacity in September and November was now overflowing.Looking south. This wider shot shows the flooding wastewater curled around the stockpile and headed south into the woods where White Oak Creek flows toward the mine.Looking SE. Close up of the waste water turning the corner around the stockpile.
From where you lose visibility of the ditch under the forest canopy to White Oak Creek is about 80 yards according to Google Earth.
Floodwaters Even Higher on February 13
On my February 13, 2020, overflight, I captured the following images. They show the floodwater had risen even higher and backed up farther.
Looking SW. On February 13th, the flooding wastewater appeared even higher.Looking SE.It still curled down the ditch on the west (right) side of the mine and flowed into the woodstoward White Oak Creek
Water backed up so far, it even flowed into the utility corridor at the north end of the mine.
Looking East.Water in utility corridor at north end of mineon February 13, 2020
In March, Possible Dredging Observed, Still Flooding Neighboring Properties
In March, one of the first things I noticed was the dredge. The cutterhead, which had been elevated for months, was now DOWN. That usually indicates the dredge is working. And that’s something the injunction prohibited.
Dredge with its cutter head down usually means active dredging.
The pond next to the waste water pit overflowed onto neighboring properties even more. It came right up to the road. Note the huge difference between the levels of the two ponds below.
Note how high the water level is in the pond at the top of the frame compared to the waste pit at the bottom. Looking SW. Floodwaters stretch into adjoining properties. Stockpile is behind trees in upper left.Looking SE. Floodwater still fills the ditch running south along west side of stockpile.Looking NW at wastewater flooding adjoining properties.Stockpile is in lower left.Looking SE. Adjoining properties are in tree strip in front of stockpile. Notice waste water among the trees.Looking north from over stockpile toward vast areaflooded with waste water.Looking west. Even more of utility corridor is flooded in March.
Water In, Water Out
Miners use water to clean silt out of the sand before shipment. Note the damp sand coming off the conveyor belts.Looking south. A river of waste water is seen leaving the processing equipment on March 6, 2020.Looking NW. The silt-laden waste water even forms a delta in the waste pit. Flooded properties are on the other side of the road that cuts diagonally through the frame from middle left to upper right.
So water is leaving the processing equipment and going into the waste pit. It has to come in from somewhere. But where? As you can see from the photos below, the supply lines for the processing equipment come from the dredge pond.
Looking west. Water goes into the processing equipment from the dredge pond.Looking North. Wide shot showing dredge with cutterhead down and discharge pipe leading back to shore.
In the shot above, you can see that the lowest pond in the whole operation is the pond receiving ALL the waste water. Why is that?
The Big Questions and Some Possible Answers
So it appears that the mine is pumping water out of the dredge pit, into the waste pit, and finally into the surrounding forest. The big questions are these.
Why is the mine keeping the level of the water in the waste pit so low?
Why is the mine flooding the surrounding forest and neighboring properties with industrial waste water?
Is the waste water polluting White Oak Creek?
To hypothesize some answers to those questions, let’s look at two pictures: the first from February and the second from March.
Looking south. February 20, 2020. Miners have been removing sand from area with all the tracks in the center and the big pond at the lower left.
From this one photo, we can see that to avoid dredging (per the injunction), the miners have started surface mining. But the level of mining is getting down to a) the water table, and b) the level of the waste pit.
Looking NW. March 6, 2020. Three weeks later, mining is now BELOW level of water in the waste pit.
Note the differing levels of water in the forest (top) and waste pit (middle). Also note that the level of the surface mining has now gone far below the level of sediment in the waste pond.
From this photo (and others in the series) we can conjecture what happened. Please note: I have no proof of this. It is only conjecture.
Theory for the Discharge
I suspect that the mine realized that if it were to continue filling orders while it waited for trial on June 22, 2020, it would need to start surface mining AND mine below the level of water in the waste pit. So, I’m guessing they started lowering the level of the pond to keep mining as long as possible.
I’m also guessing that the terms of the injunction and heightened scrutiny by the TCEQ meant they could no longer make excuses about discharging water into the creek. So they discharged into the forest instead…most of which Guniganti owns except for that strip north of the stockpile. If the discharge drained into White Oak Creek deep in the forest, at least it wouldn’t be visible.
Is Discharge Reaching White Oak Creek?
Is the waste-water pollution reaching White Oak Creek? Because of the dense forest canopy, that’s impossible to determine from the air. One could only tell from the ground. And because Guniganti owns all the land around the mine (except for the properties in the red circle), the only way to determine that would be by trespassing. That makes it impossible for ordinary citizens to spot any illegal discharge, such as Tony Buzbee did when he was running for Mayor of Houston. Fortunately, the TCEQ has the right to inspect the property from the ground if it suspects a violation of the restraining order. And they are investigating this.
Summary of Potential Violations
This whole affair once again raises questions about whether sand mines should be permitted in floodways. This mine actually sits at the confluence of TWO. Which is part of the reason why it was sued by the attorney general in the first place. Both Caney and White Oak Creeks captured the pit last year and the TCEQ estimates millions of gallons of process waste water were discharged without a permit into the headwaters of Lake Houston.
Meanwhile, Triple PG appears to be discharging again without the benefit of storms to blame the behavior on. They also appear to be violating terms of their injunction by:
Dredging
Discharging process wastewater
Producing process wastewater that had to be discharged off their property.
Discharging water that had been in the Facility’s Dredge Ponds.
Discharging Industrial Waste and/or Process Wastewater adjacent to waters of the state (White Oak Creek)
I have contacted the TCEQ twice already about whether they permitted any of these activities. They have not responded yet, citing the ongoing investigation. However, I must believe that had they permitted the activities, they would not be investigating and would have replied immediately. They visited the site yesterday.
Posted by Bob Rehak on March 13, 2020
927 Days after Hurricane Harvey and 176 since Imelda
The thoughts expressed in this post represent opinions on matters of public concern and safety. They are protected by the First Amendment of the US Constitution and the Anti-SLAPP Statute of the Great State of Texas.
https://i0.wp.com/reduceflooding.com/wp-content/uploads/2020/03/20200306-RJR_0052.jpg?fit=1200%2C800&ssl=18001200adminadmin2020-03-13 20:13:412020-03-14 10:49:56Triple PG Mine Appears to Violate Injunction
So what made this water turn color? This is definitely a hard one:
TACA is promoting Sherwin-Williams.
It’s a Slurpee® and snow cone waste pit.
All the left-over food coloring that Randall’s couldn’t sell at 95%-off wound up here.
The country of Gabon is advertising tourism.
Cyanobacteria are taking over the pit.
And The Answer Is…
If you guessed D, you at least get points for knowing your flags. Gabon’s colors are blue, green and yellow. But you also guessed wrong. Gabon wouldn’t stoop this low.
The correct answer is E – cyanobacteria.
About Cyanobacteria
According to the TCEQ and Denise Wade at Harris County Flood Control, blue-green algae, also known as cyanobacteria, naturally occur in bodies of water. Blue-green algae have the potential to grow throughout the year. Blooms are seen more frequently during summer months in warm, stagnant, nutrient-rich water. Blue-green algae blooms can appear as in the photos above or even emerald green, blue green, pea green, red-brown, or white.
“The algae sometimes attach to sediment or plants at the bottom of a water source. Wind can even blow the algae onto soil surrounding the water source. If there has been a blue-green algae bloom, but it has collapsed (decayed), there may still be algal toxins in the water,” said Wade.
Toxins?
But it looks so pretty! Especially the blue part. Kind of reminds you of Cancun (if not Gabon). Don’t be fooled!
Cyanobacteria can be very dangerous. The World Health Organization has documented acute impacts to humans from cyanobacteria from the US and around the world as far back as 1890. While most human health impacts have resulted from ingestion, illnesses have also been attributed to swimming in cyanobacteria infested waters. Exposure to toxic cyanobacteria scums may cause various symptoms, including nausea, vomiting, diarrhea, mild fever, skin rashes, eye and nose irritations, numbness and general malaise. Some studies even suggest cyanobacteria may be linked to more serious illnesses.
NOAA warns that people often get sick by eating shellfish containing toxins produced by these algae if found in a larger water body; obviously, shellfish aren’t found in sand pits. However, the algae, they say, are often found in stagnant water which is found in sand pits.
The airborne toxins, says NOAA, may cause breathing problems and, in some cases, trigger asthma attacks in susceptible individuals.
According to Robin Cypher of the TCEQ, “Some strains of cyanobacteria can produce toxins (cyanotoxins) in concentrations that are harmful to humans, pets, fish, and wildlife. Cyanobacterial blooms can also produce secondary compounds which can cause taste-and-odor problems in public water systems.”
“Cyanobacteria are a group of photosynthetic bacteria found in surface waters throughout the country,” says Cypher. “Similar to algae, cyanobacteria can rapidly multiply forming thick blooms, especially in warm, nutrient-rich waters.”
How to Report Cyanobacteria Blooms and Learn More
Sightings of fish kills or suspected harmful blooms can be reported to Texas Parks and Wildlife Department’s 24-hour communications center at 512-389-4848.
Sources of information about harmful algal blooms include:
If you’re out hiking in the woods and you see such water:
Do not wade or swim in the water, especially near surface blooms.
Do not drink the water; avoid drawing lake water.
Do not let pets or livestock into or near the water; dogs are especially vulnerable to toxic cyanobacteria.
Now if someone asks you, “What made that water turn color,” you will know. And more important, you can warn them.
Posted by Bob Rehak on 2/24/2020 based on information from Harris County Flood Control
909 Days after Hurricane Harvey
https://i0.wp.com/reduceflooding.com/wp-content/uploads/2020/02/20200213-RJR_7615.jpg?fit=1200%2C800&ssl=18001200adminadmin2020-02-24 20:27:392020-02-25 17:17:28Pop Quiz: What Made This Water Turn Color?
After 2.5 years of examining photos and videos of the so-called “dikes” in sand mines, I have come to believe that some are designed to fail. In some cases, mines cause them to fail.
In most cases, the “dikes” are not really dikes. They’re just the edges of pits that miners have excavated. Or roads around the pits made of sand that easily erode.
And because miners mine so close to the river, when those pits fill with water, they overflow. The resulting erosion cuts channels between the pit and the river that allow the pits to discharge a portion of their wastewater. Lake Houston and public drinking water become collateral damage.
High Cost of Flimsy Construction
After the storm, miners throw some sand in the breach and wait for it to happen again. The sand creates only the appearance of a fix.
Month after month, I’ve photographed active breaches, “patched” breaches, and scars in the landscape from older breaches. Many reopen multiple times.
Breaches are so common that, in my opinion, they may be part of some miners’ business plans.
High Cost of Silt
If discharges consisted of plain water, I might not care. But the water usually carries silt with it. Miner’s settling ponds can fill with silt which has little marketable value. Flushing it downriver solves another problem.
Miners externalize their cleanup costs by foisting them off on an unsuspecting public. That sediment clogs rivers that must be dredged to avoid flooding. It reduces the capacity of the lake. And it escalates the City’s water treatment costs.
A retired high-level Public Works manager told me he routinely investigated and found breaches at sand mines during floods. In his opinion, many of the breaches were intentional and the floods created the perfect “cover” for the illegal discharges. “Blame it on Mother Nature,” he said.
West Fork Images from February Flyover
Below, a sampling of more than 1000 images I took on 2/13/2020. The first batch shows mines on the San Jacinto West Fork between SH242 and US59. I traveled NW to SE toward 59. I’ve arranged images in the same order.
Sand mine pond and water’s path to the river (right).Pond is full to the brim and will overflow on a minor rain.
Another angle looking north toward the same breach.
West Fork is migrating toward pit on right and will soon enter it. A powerful argument for reasonable setbacks from river.
Another pond at the same mine. The only thing holding back another illegal discharge is a feeble road made of sand. See close up in next pic of area near poll just left of center.
Close up of road in upper left of previous photo. Note how water seeping through it is already causing road to collapse.
Silt spreading into settling pond. See also reverse shot below.
Reverse angle from previous shot, but same pond. See West Fork in background and note how road in foreground was cut by spreading silt.
Site of previous double breach at RGI mine. Note gray area in second row of dikes. Process water from the pond behind it broke into the settling pond in the foreground and from there into the West Fork. TCEQ cited owners.
Two separate ponds may have shared this same “wash” to the river (foreground). Pond in middle right is actively discharging into river. See reverse angle in next shot.
Same discharge as in previous shot. From this angle it is easier to see the active discharge.
Same breach from third angle. From this angle, you can clearly see the path and the discharge.
This pond has been discharging into the river for months. Note the difference in the color of the river water and discharge water. This indicates the discharge water is still holding silt.
Reverse shot of same breach highlights both the path and the color difference of the discharge.
This pond is leaking into a drainage channel that parallels Northpark Drive south of Oakhurst.
Former breach at Eagle mine on Sorters Road. West Fork in foreground.
Scars from previous breaches. One of these was intentional, though I’m not sure which. See video below.
Video by resident who wishes to remain anonymous shows intentional breach at the mine above.
Another scar from previous breach.
Confluence of Spring Creek (left) and West Fork San Jacinto (right).Facing west.Note color difference in water. It’s frequently visible.
Same area looking southeast toward Humble.West Fork on left.
Same area looking NE toward Kingwood.West Fork comes in from left.Between the 59 bridge in the previous shot and this area, the Army Corps spent more than $90 million removing sediment from the West Fork. The City, County and State could spend another $35 million removing this blockage.
Wider shot shows just how much forest was blown out in this breach, leading one to wonder whether this was caused solely by nature.Another former breach into Caney Creek from the Triple PG mine. Only this eroding road stands between the mine and the creek.
Also at the Triple PG mine in Porter, this breach into White Oak Creek remained open for months. It, too, was the subject the Attorney General’s lawsuit. A restraining order against the mine calls for repairs to be certified by a professional engineer. This looks as though they may have tried to add concrete to the sand and stabilize it with rebar. However, note that the concrete, if that’s what it is, doesn’t rise much above the water. The road is made from eroding sand that will blow out in the next storm.
Reverse shot of same breach looking west. No concrete or rebar visible here – only rilling along steep sides of road. Rilling is the term for those vertical erosion channels.
Posted by Bob Rehak on 2/24/2020
909 Days since Hurricane Harvey and 158 since Imelda
The thoughts expressed in this post represent opinions on matters of public concern and safety. They are protected by the First Amendment of the US Constitution and the Anti-SLAPP Statute of the Great State of Texas.
https://i0.wp.com/reduceflooding.com/wp-content/uploads/2020/02/20200213-RJR_7753.jpg?fit=1200%2C800&ssl=18001200adminadmin2020-02-24 15:22:182020-02-24 15:29:12Are Sand Mine Dikes Designed to Fail?
Since flooding in Elm Grove and North Kingwood Forest last year, the TCEQ has completed half a dozen investigations of Woodridge Village with more in the works. Woodridge Village is the troubled Perry Homes development where contractors clearcut 268 acres while installing less than 25% of the required detention capacity.
The TCEQ has repeatedly charged Perry contractors and subsidiaries with stormwater pollution violations and unauthorized discharge of sediment. Below are results of six investigations that led to a total of 13 citations. Together the 449 pages of these investigations indicate a lax attitude toward regulations, repeated failures to comply, poor coordination among vendors, and lack of awareness of responsibilities.
Investigation 1571093 of Figure Four Partners in June 2019
On June 17 and 18, 2019, TCEQ investigators cited Figure Four Partners, LTD for “failure to prevent the unauthorized discharge of sediment-laden water from the construction site which could contribute to pollution in waters of the state of Texas.” (See Investigation 1571093 and attachments.)
Investigators found Figure Four failed to implement and maintain best management practices. They tracked the illegal discharge 2.5 miles down Taylor Gully. Where the stream entered woods, lack of access prevented tracking the discharge further.
TCEQ ordered the operator to install adequate sediment controls to minimize discharges from the site.
Investigation 1579654 of Rebel Contractors in June 2019
This was an investigation of Rebel Contractors, which had responsibility for the southern 80 acres of the site.
The TCEQ report starts by noting that two previous complaints about Rebel Contractors had been referred to Montgomery County for investigation.
In this investigation, TCEQ collected water samples upstream and adjacent to the development that were not impacted. They also collected samples above the outfall from the development and downstream of it that were.
They found that total suspended solids (TSS) in the non-impacted samples ranged from 29 to 45 milligrams/liter. The impacted samples, however, ranged from 245 to 620 milligrams per liter.
Investigators also looked at total dissolved solids (TDS). Non-impacted samples ranged from 128 to 158 milligrams per liter. Impacted samples ranged from 2053 to 2804 milligrams per liter.
Water from and below the site had significantly higher TSS and TDS.
Investigators allege Rebel failed to implement and maintain effective Best Management Practices. They cited Rebel for “failure to prevent the unauthorized discharge of sediment-laden water from the construction site which could contribute to pollution in waters of the state of Texas.” They also cited Rebel for failure to prepare a Stormwater Pollution Prevention Plan. It took Rebel six weeks to prepare and submit the plan to the TCEQ.
Investigation 1604733 of Figure Four Partners in October 2019
On October 25, 2019, investigators returned to the site and found Figure Four had violations similar to June. They ordered Figure Four, once again, to install adequate sediment controls that minimized discharges from the site. (See Investigation 1604733 and attachments.) They ordered Figure Four to install adequate controls that reduced discharges.
Investigation 1579655 of Double Oak Construction in June 2019
Double Oak Construction is responsible for clearing and grubbing on the Woodridge site. In June, TCEQ conducted an investigation during which they collected the previously mentioned water samples. They cited Double Oak for failure to prevent unauthorized discharges of sediment-laden water and failure to prepare a Stormwater Pollution Prevention Plan.
They also found that Double Oak could not identify where discharges went. They thought it was Galveston Bay.
By the end of August last year, Double Oak still had not submitted a Stormwater Pollution Prevention Plan.
Investigation 1604738 of Rebel Contractors in October 2019
Second verse same as the first. Investigators found elevated levels of suspended and dissolves solids from the site relative to non-impacted areas. TCEQ alleges Rebel failed to implement and maintain Best Management Practices. They also allege discharge of pollutants, i.e., sediment-laden stormwater and failure to post a construction permit.
TCEQ ordered Rebel to control discharges and post a permit. It took Rebel 7 weeks to post the permit.
Investigation 1604741 of D&J Construction in October 2019
TCEQ cited D&J for failure to prepare a Stormwater Pollution Prevention Plan and failure to include required information on their construction site notice.
886 Days since Hurricane Harvey and 135 since Imelda
The thoughts expressed in this post represent opinions on matters of public concern and safety. They are protected by the First Amendment of the US Constitution and the Anti-SLAPP Statute of the Great State of Texas.
https://i0.wp.com/reduceflooding.com/wp-content/uploads/2020/02/Woodridge-Erosion-by-TCEQ.jpg?fit=1200%2C910&ssl=19101200adminadmin2020-02-01 08:52:322020-02-01 08:57:21Six TCEQ Investigations Lead to 13 Citations for Woodridge Village Developer and Contractors
In response to complaints filed on October 23, 2019, the Texas Commission on Environmental Quality (TCEQ) Houston Region Office issued a Notice of Violation to the developers of Woodridge Village. Figure Four Partners, LTD, a Perry Homes subsidiary, owns Woodridge Village, which contributed to the flooding of Elm Grove Village and North Kingwood Forest in May and September of 2019.
History of Uncorrected Violations by Perry Homes
The TCEQ originally investigated Woodridge Village in response to complaints filed after the May 7, 2019, flood. At that time, the Commission found that Perry Homes, et. al., had failed to implement and maintain effective Best Management Practices. They found that sediment-laden discharges had affected at least 2.5 miles of Taylor Gully. TCEQ sent that violation to its enforcement division.
Page 5 of the report states that pollution prevention measures implemented after the first investigation “did not appear sufficient to prevent sediment-laden discharge…”
The investigator observed tainted discharge 2.5 miles down Taylor Gully to the point where it disappears into woods and then joins White Oak Creek, Caney Creek, the East Fork, and Lake Houston. Said another way, the discharge appears to be polluting waters of the State of Texas and the drinking water for 2 million people.
Sediment laden water from Taylor Gulley where it joined the East Fork of the San Jacinto on January 11, 2020.
TCEQ is requiring Perry Homes, its subsidiaries and contractors to install sediment controls on all areas under their operational control at Woodridge. “There must be adequate structural controls to minimize sediment discharges from the site,” says the TCEQ in “Recommended Corrective Action” on page 7 of the 77 page report.
Perry Contractors Also Investigated
The release of findings today indicates that four Perry contractors at this site were also investigated by the TCEQ: D&J Construction Inc., Rebel Contractors Inc, Texassite LLC, and Double Oak Construction Inc.
No New Structural Controls Appear To Be In Place Yet
No additional structural controls appear to have been installed since the last investigation on October 25th. Sediment-laden runoff from the area of wetlands on the northern section of property continues unabated, although grass planted in other areas may be helping slightly.
Looking SE toward Taylor Gully, Elm Grove and North Kingwood Forest from the northwest corner of Woodridge Village. Everything slopes toward the detention pond in the upper left, but no structural controls to reduce runoff are in place.Photo taken 1/20/2020.
Unfortunately, grass planted last summer has been destroyed by new construction activity around the southern detention ponds – the area of highest concern, where water from the site enters Taylor Gully through the double culvert seen in the picture below.
Contractors have destroyed the grass and backslope interceptor swales previously constructed around the S2 detention pond. Erosion continues to etch the walls of the S2 detention pond which should be covered with grass by now.It was substantially complete in August of last year.Construction of the S2 pond continues months after Perry Homes promised the City of Houston construction would be complete. The pond should have been complete by the start of December.
What Next for Troubled Perry Homes and Woodridge Village?
The thoughts expressed in this post represent opinions on matters of public concern and safety. They are protected by the First Amendment of the US Constitution and the Anti-SLAPP Statute of the Great State of Texas.
https://i0.wp.com/reduceflooding.com/wp-content/uploads/2020/01/20200120-RJR_7283.jpg?fit=1200%2C800&ssl=18001200adminadmin2020-01-30 19:36:142020-01-30 19:36:30TCEQ Issues Notice of Violation to Perry Homes’ Woodridge Village Development
To shine a light on the difference between the myth and reality, I’ve taken up a new hobby: sand-mine photography from a helicopter. On my December flight up the West Fork of the San Jacinto, I flew over this mine. Note the wetlands and utility corridor in the middle. Also note the trench leading through the trees on the right to that open gap in the tree line along the utility corridor.
I was curious about that gap. So I asked the pilot to go closer and got the photo below. How strange, I thought! The pipeline corridor has washed out, like at the Triple PG Mine. But this was a little different. The mine appeared to be draining the wetlands. Note the river of muck in the photo below.
Enlargement Shows Makeshift Supports
Someone had rigged “supports” under five pipelines. See the enlargement below. I put supports in quotes because they don’t seem to be working very well; note the sagging. Some look more like clotheslines than pipelines under pressure.
Pipelines Carry Highly Volatile Liquids
Investigation showed this is the SAME utility corridor bisecting the Triple PG mine miles to the southeast in Porter. These are the same five pipelines carrying highly volatile liquids (HVL). This mine, however, lies on the West Fork of the San Jacinto in Conroe near 242.
The channel under the five pipelines is up to a 100 feet wide.
Historical Images in Google Earth Show How This Happened
An investigation of historical satellite images in Google Earth shows that erosion has been a problem in this area at least since 1995 – the date of the earliest available image. Water overflowing the wetlands tried to make its way to the river on the other side of the utility corridor. The problem was manageable, however, as long as the land was flat. That was until 2014.
In 2014, when the mine first started excavating next to the corridor, a process called headward erosion started. Water flows from top to bottom. Notice how much deeper and wider the erosion is below the corridor than above. See explanation below.
In 2014, two things happened. The mine started excavating right up to the edge of the pipelines (just as Triple PG did).
Next, three back-to-back-to-back monster storms in 2015, 2016 and 2017. They were “perfect storms” where the right combination of circumstances came together: Heavy rain. Exposed, loose soil. Steeper gradient.
How “Headward Erosion” Happens
The fact that miners had excavated up to the pipeline corridor with some very deep pits created a steep drop at the edge of the pipelines. That meant water crossing the corridor tended to accelerate and erode the sandy soil beneath the pipelines faster. The soil then sagged into the pit, much as you see in the pictures above. This process is well documented and has a name: headward erosion.
Here’s an illustration of how the process of headward erosion works
Trying to make the best of a bad situation, it appears that either the miners or the pipeliners tried to shore up their pipelines with supports. But it’s not working. They keep trying to plant grass. They keep using erosion control blankets. The supports keep sinking. And the pipelines keep sagging. Here’s an even bigger blowup.
It looks as if some of these supports are anchored in quicksand. Notice the extreme difference in their heights. The cross braces supporting the weight may be adjusted as the supports sink. But not on this day.
Another factor here: What if a tree washes down this chute during a torrential rain? It happens. Regularly.
I have a hard time imagining the stress on these pipelines. An engineer calculated a range of weights for me. He made some assumptions about the thickness of the pipes and the weight of liquids inside them. Then he calculated the weight of 100 feet. The range: 20,000 to 30,000 pounds. No wonder they’re sagging. That’s more than I weigh after a dinner at Carrabbas!
Probably No Imminent Danger, But Just in Case…
They’re probably not an imminent danger. But what happens in the next big storm? We’re overdue. It’s been more than two months!
Hundreds of thousands of gallons of flammable liquids. Under high-voltage electric lines. Pipes under stress. Erosion that widens with every storm. This should be a wake up call. But…
Posted by Bob Rehak on 12/9/2019 with help from Josh Alberson
832 Days after Hurricane Harvey and 80 since Imelda
The thoughts expressed in this post represent opinions on matters of public concern and safety. They are protected by the First Amendment of the US Constitution and the Anti-SLAPP Statute of the Great State of Texas.
https://i0.wp.com/reduceflooding.com/wp-content/uploads/2019/12/Sagging-Pipelines.jpg?fit=1200%2C648&ssl=16481200adminadmin2019-12-08 21:45:292019-12-09 21:58:51Don’t Dig Near Pipelines: A TACA Safety Moment
The Liberty Materials Mine in Conroe on the West Fork of the San Jacinto was cited last month for allegedly discharging 56 million gallons of wastewater loaded with up to 25 times the normal amount of sediment. When we look at the issue of sediment in the river and how it affects flooding, such breaches contribute to the problem. But it’s not just what such sand mines discharge. It’s also about what the wetlands they were carved from don’t hold back any more.
Before there was a Liberty Materials in Conroe, the area they now occupy contained many densely forested wetlands. Now there is nothing to slow down the water during heavy rains. Much more sand and sediment are exposed. And the wetlands are no longer there to filter it. It’s a double whammy. We get it coming and going.
Visually, it appears that wetlands once covered roughly half the area of this mine. But what was actually there?
US Geological Survey (USGS) and US Fish and Wildlife Service (USFWS) use a five character alpha-numeric code to classify wetlands. Liberty Materials operates in areas that were classified as PFO1A and PEM1A.
P stands for the class: Palustrine. Palustrine wetlands include any inland wetland that lacks flowing water. The word palustrine comes from the Latin word palus or marsh. Wetlands within this category include inland marshes, swamps and floodplains covered by vegetation.
The second two letters in each case stand for the subclass: FOrested or EMergent. Forested means it had broad-leaved, deciduous trees or shrubs taller than 6 meters. Emergent means it had aquatic plants.
These were areas that could store large volumes of water during floods. Plus, they had vegetation that could suck it up.
Trees Soak Up Water, Too
Trees can soak up 50 to 300 gallons of water in a day depending on their size, age and type. They send it back into the atmosphere; let’s use 100 gallons as a conservative average and do some simple math to calculate their contribution to flood reduction.
The Liberty sand mine complex comprises more than a thousand acres. That’s 500,000 trees each soaking up 100 gallons of water per day. Or 50 million gallons of water per day.
That’s about the same amount that the TCEQ estimates the Liberty Mine discharged downstream in one breach.
Personally, I’d rather have the trees and wetlands than white water and a river that’s so silted up it contributes to flooding.
Influence of Wetlands on Flooding
Imagine a sand box that’s 1.5 miles wide and 2.5 miles long. Here’s what it looked like the day after the peak of Hurricane Harvey.
Image from 8/30/2017 of Liberty Mine one day after the peak of Harvey.
And here’s why. Note how closely the extend of flooding matches the extent of the flood plains. Like almost all mines on the West Fork, this one lies substantially within the floodway and floodplain.
Cross-hatched = floodway; aqua = 100 year; tan = 500 year floodplain.
Is Liberty’s Luck Running Low?
If these people had the strongest dikes in the world, maybe you could cut them some slack. But they don’t. They breach repeatedly.
About a month after allegedly discharging 56 million gallons of process wastewater into the West Fork, the only thing holding back another discharge at the Liberty Mine is a couple feet of sand. Photo taken on 12/3/2019.
We need sand, but not at the expense of floods and the environment. Maybe it’s time for TACA to run some of its members out of Texas. That do-good routine they stage in Austin every other year could be in jeopardy with members like Liberty. See below.
11/4/2019. The Day the West Fork Turned White.Confluence of Spring Creek and West Fork. TCEQ alleges that Liberty Mines discharged 56 million gallons of white waste water into the West Fork.
Posted by Bob Rehak on 12.5.2019
828 Days since Hurricane Harvey
The thoughts expressed in this post represent opinions on matters of public concern and safety. They are protected by the First Amendment of the US Constitution and the Anti-SLAPP Statute of the Great State of Texas.
https://i0.wp.com/reduceflooding.com/wp-content/uploads/2019/12/Liberty-Breach-12.3.19.jpg?fit=1200%2C913&ssl=19131200adminadmin2019-12-05 21:59:212019-12-05 22:04:40Liberty Materials Mine Carved Out of Many Wetlands