Why We Flood: Doom Loop, Part II
5/20/25 – Yesterday, I posted about a doom loop and virtuous cycle as they related to flooding in general. Doom Loop Part II will focus on more specific patterns that I have seen repeated in the Houston area over time.
“Doom loop” is often used in public policy debates to describe a series of events that contribute to a downward spiral, such as increased flood risk for more people.
The words and slides below are taken from a presentation delivered to the Harris County Community Resilience Flood Task Force and Infrastructure Resilience Team today. I hope they stimulate a discussion. Only through correct diagnosis of the problem can we ever hope to find a solution.
To download a copy of the presentation, click here. To review the narrative that goes with the slides, see below.
Slide One: A 75-Year Perspective
What happened in fast-growing watersheds inside Beltway 8 decades ago is now happening in fast growing watersheds outside the Beltway today. We’ve had multiple waves of expansion in the last 75 years. And we keep repeating the same mistakes.
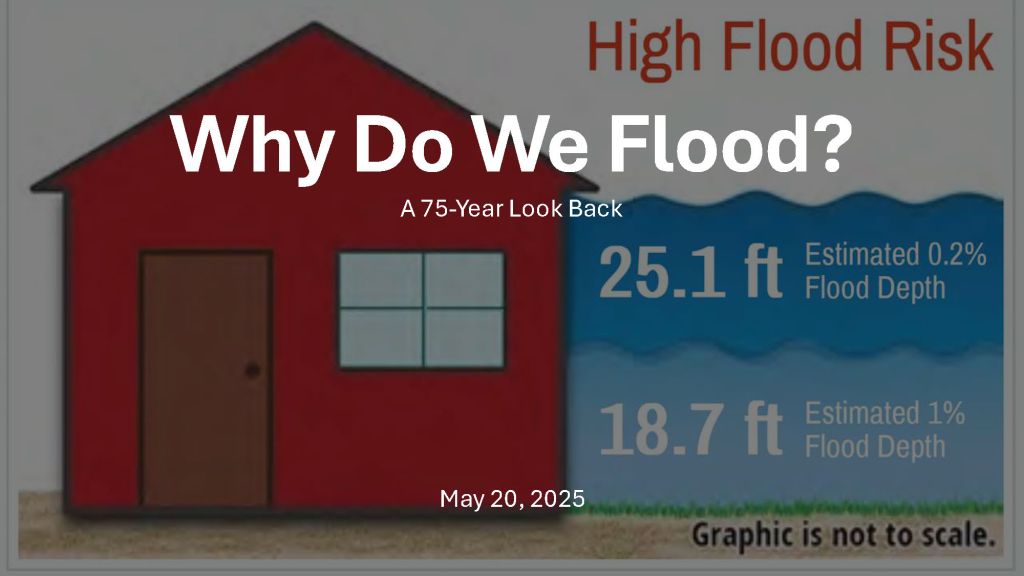
Remember this slide. We will come back to it at the end. It shows base flood elevation – the estimated depth of a 100-year or 1% annual chance flood above ground level.
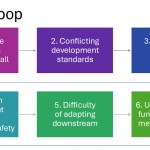
Slide 2: Doom Loop
A doom loop is the opposite of a virtuous cycle. For instance, crime increases. So people move away and tax revenue decreases. That means less money for police, crime continues to increase, etc. In flooding, in north Houston, the doom loop looks something like this.

These six things build on each other to compound risk. Let’s look at each and some real world examples inside and outside of the Beltway.
Slide 3: Inaccurate Predictions
All of our homes and infrastructure are built around estimates of future rainfall. But those estimates are a shifting target.
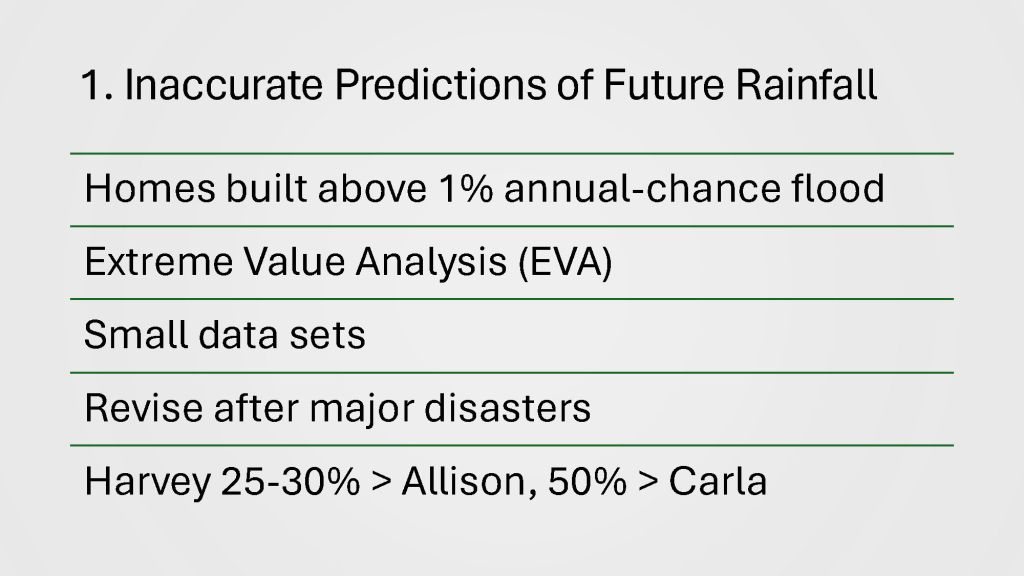
The estimates form the foundation of our building codes and development regulations.
Statisticians base them on a branch of mathematics called extreme value analysis (EVA). EVA tries to estimate the probability of unknown future events based on the frequency of extremely rare past events.
But because past superstorms are rare, the statisticians do not have much data to work with. So, they must revise their estimates every time we have a major new disaster such as Carla, Allison or Harvey.
Today, Houston and Harris County design infrastructure around rainfall estimates that are 50% greater than the those in place when most of Houston’s streets, homes and drainage systems were built.
Slide 4: Major Iterations of Stats
Since I moved to Houston 42 years ago, we’ve had three different standards.

The standard developed after Carla in 1961 predicted a 1% annual chance storm would drop 12 inches of rain in 24 hours.
But since Harvey, we now think of such a storm as one that drops 18 inches in 24 hours.
That’s 50% more than the standard that shaped much of the infrastructure Houston put in place before Allison.
But adoption of these standards is not uniform. Nor is adoption fast. Some places in the region still use TP-40 estimates developed 64 years ago.
Slide 5: Infrastructure Changes with Expected Rainfall
What depends on these statistics? Lots.

In short, the rainfall design standards form the basis of everything that determines whether you will flood in the next superstorm.
However, they aren’t uniformly adopted throughout the region. Potential homebuyers should look upstream in surrounding jurisdictions to see whether those areas are basing their development decisions on standards that are this strict.
Slide 6: Conflicting Standards Sometimes Fight Each Other
Building codes and development regulations based on those rainfall design standards also get updated periodically. But never at the same time.
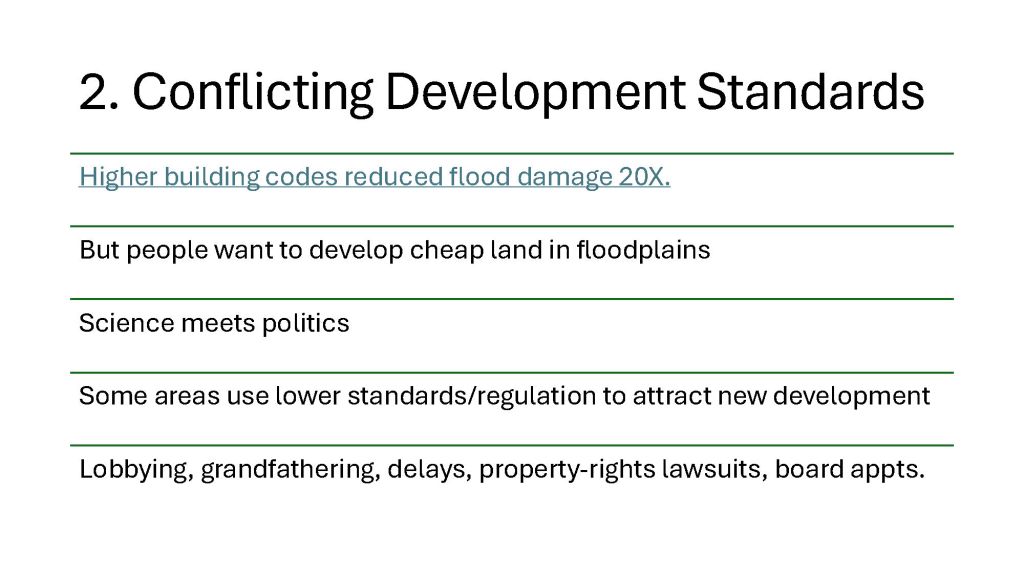
Harris County had a major building code update in 2008, requiring people to build to higher standards.
After Harvey, the county examined how all the homes built after 2008 fared during the storm. They were damaged at ONE TWENTIETH the rate of homes built before 2008.
So why didn’t all the surrounding jurisdictions immediately update their development standards and building codes?
This is where science meets politics.
Some areas use lower standards/regulations as a way to attract new development.
And some (certainly not all) developers manage to find reasons why they should be allowed to develop cheap land in floodplains.
They lobby political leaders intensely. Frequently, leaders grandfather projects. For instance, if you applied for a permit before Houston’s new regulations went into effect, you don’t need to build to the higher standards.
Some jurisdictions just delay adopting higher standards because they know it will raise costs for developers.
Some developers file property rights lawsuits to fight higher standards. I personally know two who fought in court for seven years for the right to develop property in floodplains.
Slide 7: Building Too Close to Threats
People love living near water. They pay a premium for it.
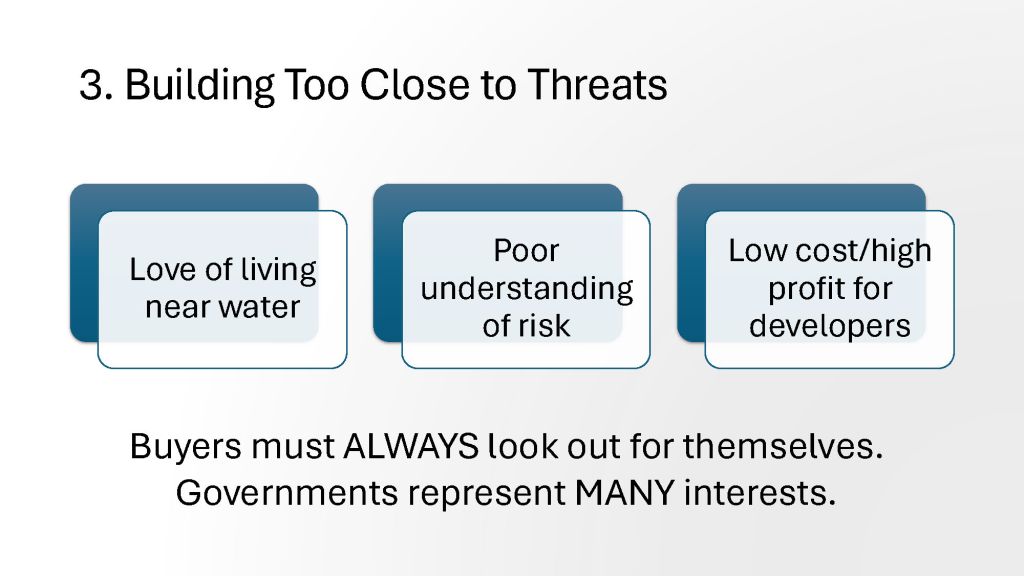
But humans usually have a poor understanding of risk. That means low cost and high profit for developers. They can buy up cheap floodplain land and sell it for a premium.
Buyers must always look out for themselves. Governments represent many interests – sometimes conflicting. They represent developers just like they represent you.
Slide 8: The Halls Bayou Example
This slide shows Halls Bayou at what would later become Sweetwater Lane in 1953. It was all farmland.
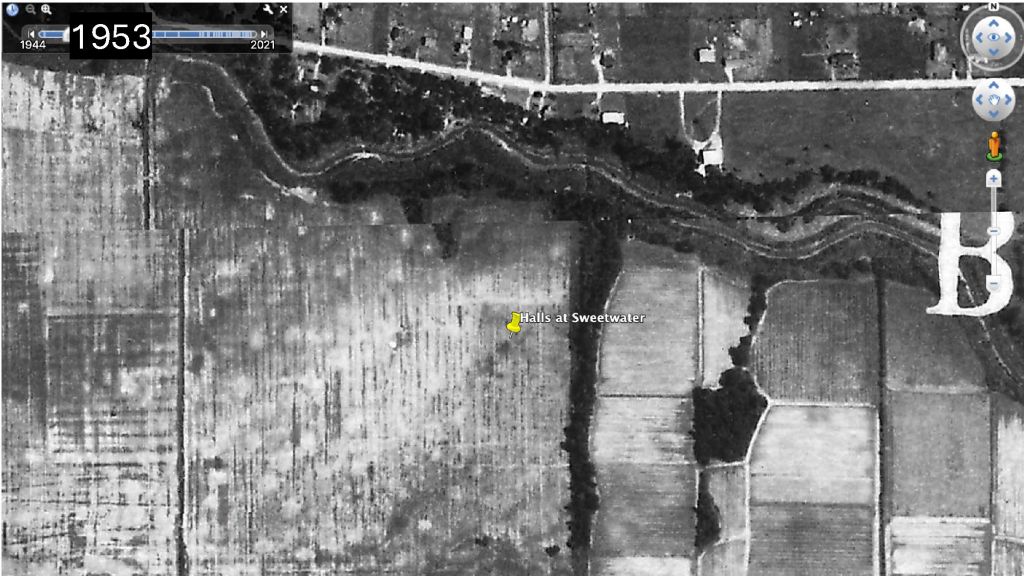
In the 1960s, the farmer sold the land to a developer.
Slide 9: Land Built Out Before FEMA
Here’s what it looked like by 1978, a year before FEMA was formed.

Slide 10: Flood Risk Today
And here’s what the flood risk looks like today…now that we have FEMA and mapped floodplains.
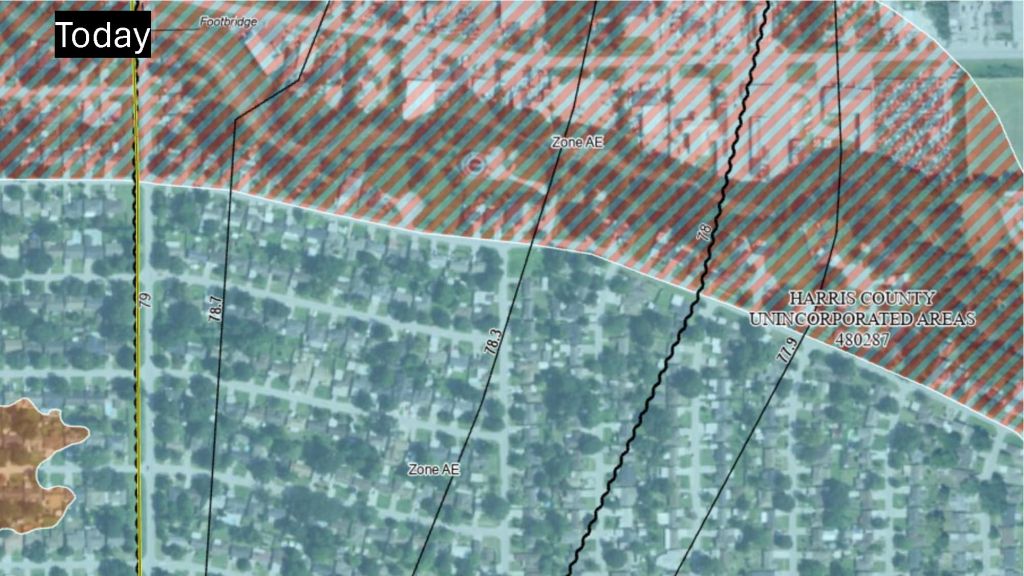
That crosshatched area is floodway. The rest is floodplains.
Slide 11: Halls Bayou Mid-reach Segment
Here’s a wider shot of Halls today. The development is so dense, it’s hard to see the bayou. So I outlined it in red.

That’s 59 angling up toward the right. Talk about density!
Slide 12: Halls Flood Risk Before Latest Updates
And here are the floodways and floodplains as FEMA mapped them in 2014. FEMA has not yet updated the floodplains using Hurricane Harvey data.
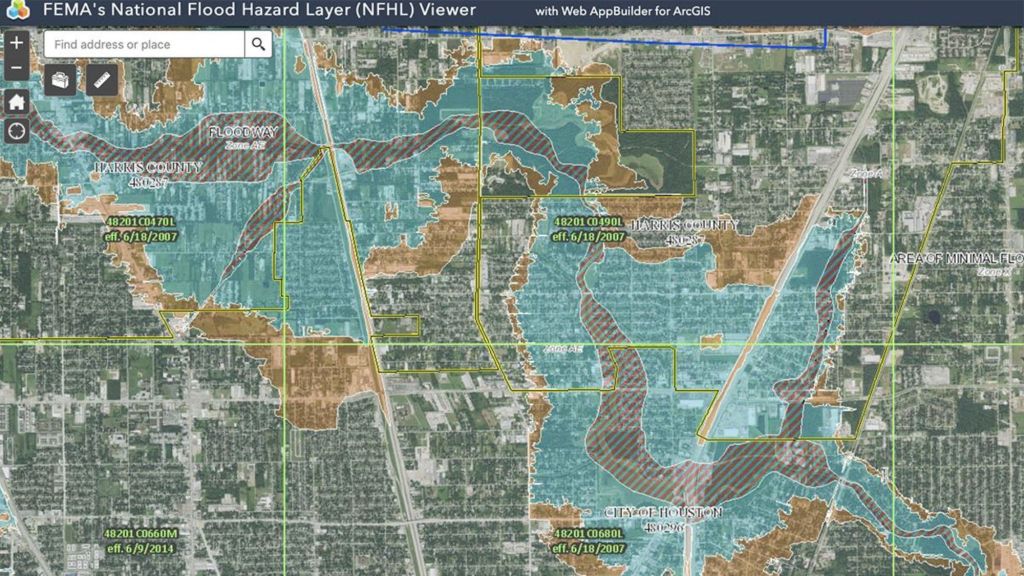
Keep in mind that these could expand 50% – 100% with MAAPnext.
Slide 13: How Upstream Development Can Undermine Downstream Safety Margins
Other watersheds, such as the San Jacinto still have a lot of undeveloped area upstream. For instance, the San Jacinto watershed north of Lake Houston is 50% larger than Harris County itself and rapidly developing.

But some jurisdictions, such as Montgomery County have not seriously updated their drainage regulations since the 1980s. So much of the new development is insufficiently mitigated.
That’s why – downstream – we get 100-year floods on 10-year rains, like we did last May. There are lots of loopholes that developers can use to game the system.
I found one that mischaracterized soil surveys to exaggerate the rate of infiltration. That allowed him to get away with building 12,000 acres in wetlands with less than 10 acres of detention basins.
Another way to get away with building less detention than you should is with hydrologic timing studies. Let’s look at those.
Slide 14: Beat the Peak
The state water code stipulates that developments can have “NO ADVERSE IMPACT’ on downstream neighbors. To prove that, engineers compare pre- and post-development runoff rates. If the post-rate is no higher than the pre-, then they can claim no adverse impact.
You can see that in the two smaller curves below on the right. They illustrate a pre/post comparison where timing surveys are prohibited.

But some jurisdictions still allow timing studies, also known as beat the peak studies or flood routing studies.
The theory is that if you can get your runoff to the river fast enough, you aren’t adding to the peak of the flood. So, you shouldn’t be forced to build detention basins. But sometimes the data they use is very old, i.e., from the 1980s in the case of Montgomery County. And it ignores the cumulative effect of development since then. MoCo, by the way, is the seventh fastest growing county in America.
But there’s another problem, too. What happens when an area sends its storm water downstream from one direction as a storm like Harvey approaches from the other?
People in the middle get squeezed. Badly. That’s the runoff curve on the left above that assumed stormwater from development would be long gone by then.
If each development took care of its own runoff, we wouldn’t have this problem. We would have to worry about the uncertainty. That’s why eliminating such studies was one of Harris County’s five main recommendations to surrounding governments after Harvey.
Slide 15: Difficulty of Adapting Downstream
Downstream, it’s difficult to adapt to insufficiently mitigated upstream development.

Everything is already built out. You can’t rip up every street in the county to increase the size of storm sewers. You can’t elevate every home in the City of Houston. And you can’t always expand drainage channels because there’s often no room.
That makes change expensive, disruptive and often politically unpalatable. And it puts political leaders in a “double bind” – a “damned if you do/damned if you don’t” situation. Many families would rather live with periodic flooding if FEMA continues to insure against it – as long as they don’t have to move. Sometimes, there’s just no way to win.
Slide 16: Too Close for Mitigation?
Here is a shot from Brays Bayou – where we’ve spent almost half a billion dollars to mitigate flooding since the start of project Brays. That includes almost $200 million since the flood bond.
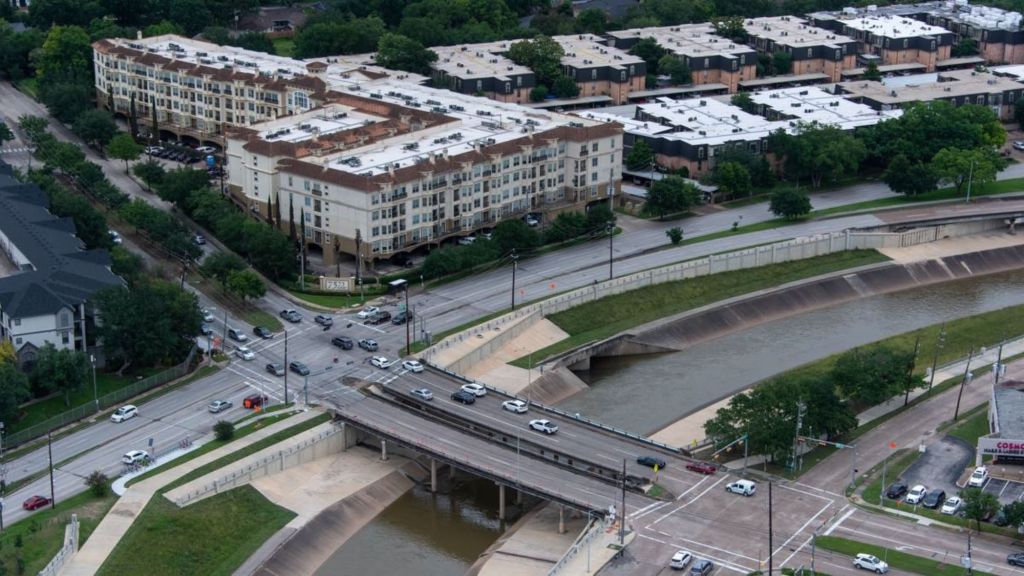
Do you think if leaders had known what they were going to be up against years ago, they would have allowed building this close to the bayou?
Slide 17: An Even Closer Shave
This apartment complex, also on Brays, is so close, it looks like it could slide in.

Slide 18: Flood-Mitigation Funding
Now consider all those problems against another one: our historical unwillingness to fund flood mitigation at meaningful levels.

Before the flood bond, HCFCD had only $60 million per year for capital improvement projects. Sometimes the district had to save up for years to build one detention basin.
After Harvey, fixing flooding was the #1 priority in the region and the state. We passed the flood bond and launched a statewide flood-planning process.
But with time and distance, people lose their sense of urgency. They want to move on. So, eight years later, we have a state flood plan with $54 billion worth of projects. And $1 billion to address them. And don’t expect the feds to bail us out any time soon. FEMA and HUD are both facing unprecedented uncertainty in Washington.
Slide 19: Step and Repeat
I hope you have seen how this doom loop repeats itself as Houston expands ever outward.

Remember that house under 25 feet of water in the opening slide. It’s located at the bottom of this area outlined in red where four streams come together about a block west of 59 and Kingwood.
A foreign developer wants to build 7,000 homes in that blue area which represents floodplains.
One hydrologist told me that building that project would be like aiming a fire hose at Kingwood.
Slide 20: Other Examples
But that’s not the only example.
Remember that development that falsified the soil tests to avoid building detention. That’s Colony Ridge, upstream on the East Fork in Liberty County. They built an area 50% larger than Manhattan over wetlands which are nature’s detention basins.

The Commons of Lake Houston fought Houston Public Works for seven years all the way to the Texas Supreme Court for the right to build 500 homes in the swampy floodplain next to the East Fork. I have pictures of it under 17 feet of water.
And Romerica tried to build 50-story high-rises with underground parking in what will soon become the FLOODWAY of the San Jacinto West Fork.
And that’s why Texas has more people living in floodplains than the entire populations of 30 states. Most of them here in Harris County.
Posted by Bob Rehak on 5/20/25
2821 Days since Hurricane Harvey
The thoughts expressed in this post represent opinions on matters of public concern and safety. They are protected by the First Amendment of the US Constitution and the Anti-SLAPP Statute of the Great State of Texas.