West Fork Sludge Fest
The San Jacinto West Fork has turned into a sludge fest again. I took the picture below on 11/11/23. Not since the day that the West Fork turned white have I seen the contrast so dramatic at the confluence with Spring Creek.

In that prior case, the cause was obvious. Two sand mines were discharging process wastewater into the West Fork. The TCEQ determined that one, the Liberty Materials mine, dumped 56 million gallons of white sludge into the river.
This time, the cause is not so obvious. I can’t even be certain I determined the cause. After taking the photo above, I spent a whole day ruling out various possibilities while searching for others.
Ruling Out Causes
The dramatic difference was not caused by huge variation in rainfall totals across the region.

The highest total on the West Fork was that 2.68 inches south of Conroe at SH242. Further investigation showed that 1 inch fell between 3 and 4PM on 11/09/23. That was the highest intensity at that gage in more than a month.
Uneven soil saturation across the region would also not cause the zebra pattern in the river. The entire region is still rated either “abnormally dry” or in “moderate drought.”
And Lake Conroe did not release any large volumes of water lately that would have scoured river banks. That eliminated another potential cause.
Now here’s where it gets really baffling.
SJRA Study Claims Most Sediment Comes from Spring/Cypress Creeks
The San Jacinto River Basin Master Drainage Study by Freese & Nichols claims that more sediment comes down Spring and Cypress Creeks than the West Fork.
In fact, they say, of all the sediment coming into Lake Houston, two thirds comes from Spring and Cypress Creeks while only 13% comes from the West Fork upstream of US59. So where is all the sludge coming from?
In my opinion, it most likely came from new developments or sand mines that move large volumes of loose sediment.
So the next day, I went out with my drone and found several possibilities.
Possible Sources for Sediment Pollution
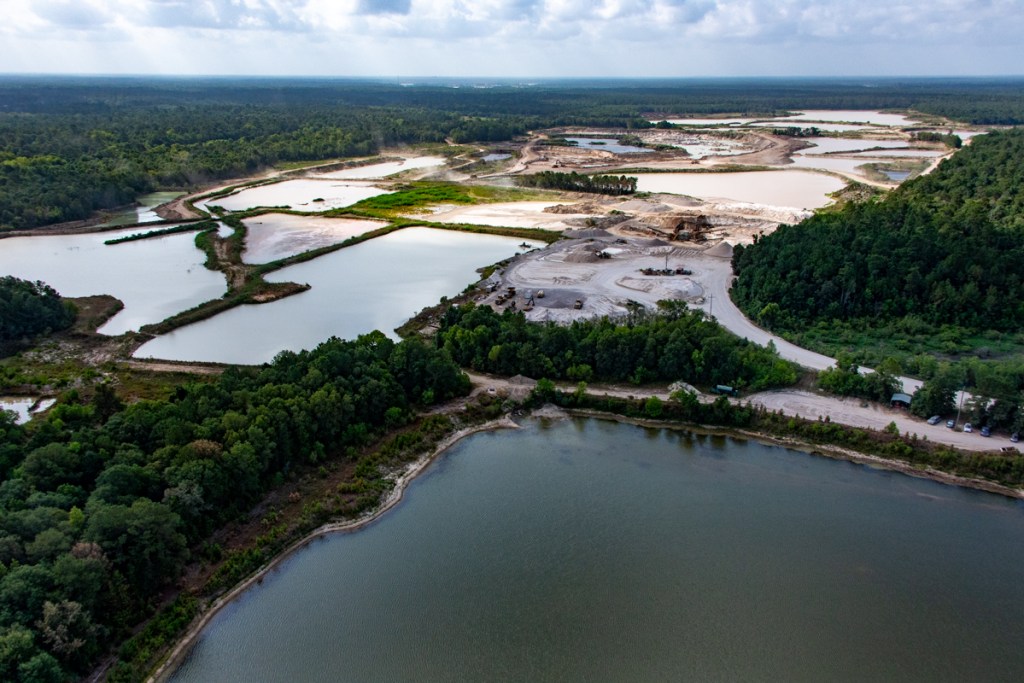
Two sand mines had pits open to the river, but I did not see large volumes of sediment oozing out of them as I sometimes do.
The most interesting possibility: new developments very near that gage on SH242 that read 2.68 inches.
Two connected developments straddle FM1314 immediately north of SH242. Early plans called them both Mavera. But now, the one on the east has a sign that says Mavera. The sign on the west section calls it Evergreen.
Both are being built on top of wetlands in a 10-year flood zone. Together, they have roughly 1400 acres of exposed soil.
Most of the development’s stormwater drains into Crystal Creek and then into the West Fork about a half mile downstream from where I took this photo.


Now let’s see what’s upstream from this breach.


The ditch above appears to be much wider than it was in January 2021, almost three years ago. Now, let’s jump back south to where this area drains into the West Fork.

Note that the picture above was taken two days after the heaviest recent rainfall, so the volume may not seem impressive.
There likely were other areas along the West Fork that contributed to the sedimentation you saw in the first photo at the top of this post. But I was not in a helicopter and it’s virtually impossible to cover the entire river with a drone. So I can’t say for sure.
How to Report Issues You May See
This is not the first time I have documented excessive sediment coming off the West Fork.

The angle of the shots above varies. But in each instance, the West Fork is the most polluted branch.
Why is sediment so concerning? After all, it’s natural, right?
Remember the mouth bar that virtually blocked off the West Fork after Harvey? Also the one on the East Fork?
When sediment reduces the conveyance of rivers, they come out of their banks faster and higher on smaller rainfalls. The rivers flood more frequently and increase your flood risk.
So, if you see unnatural situations in rivers or streams, make sure you report them to the TCEQ, which investigates such matters.
Together, we may be able to improve our safety and water quality.
Posted by Bob Rehak on 11/13/2023
2267 Days since Hurricane Harvey
The thoughts expressed in this post represent opinions on matters of public concern and safety. They are protected by the First Amendment of the US Constitution and the Anti-SLAPP Statute of the Great State of Texas.