MoCo Commissioner Taking Townsen Blvd. Extension Off 2025 Road Bond
4/17/2025 – Montgomery County Precinct 3 Commissioner Ritch Wheeler’s office says he is taking the controversial Townsen Blvd. extension off of the County’s 2025 Road Bond. However, as of 4 P.M. this afternoon, the county’s website does not yet reflect the deletion.

The change comes after a Town Hall meeting last night at which the commissioner heard a crowd of angry residents express their concerns about the Townsen Blvd. extension. The extension would open up 5,500 flood-prone acres, where a developer plans to build 7,000 homes.
No one spoke in favor of the road project, which includes three segments.
The cancellation of the County’s portion of the project could make it more difficult for a private developer to build a separate segment beyond that. The developer would have no thoroughfare to connect to.
Contractually, that separate segment must be completed by the end of 2030 if the developer hopes to get reimbursed $27 million from County tax revenues for building the road.
Road Plans Included Three Separate Segments
At the start of the meeting Wheeler explained that the entire road, as originally conceived, stretched from the Grand Parkway to Spring Creek on the south in three discrete segments. A bridge over Spring Creek was to have connected the Montgomery County portion of Townsen to the Harris County portion of Townsen Blvd.

The first segment (shown above in yellow) is currently under construction using private funds.
Going into last night’s meeting, financing of the second segment (dotted green line) was to have come from Montgomery County’s 2025 Road Bond.
The third segment (shown in red) was to have been financed through a “381 Agreement” between Ryko, Montgomery County and several utility districts.
Controversy Surrounding 381 Agreement
Under a Texas 381 Agreement, if a developer builds a road and developments around it, the county reimburses the developer for their expenses. That reimbursement comes out of future tax revenues from the new residents. Such agreements encourage economic development.
According to Wheeler, his predecessor, James Noack, initially signed the 381 agreement with Ryko in 2018. The contract required them to complete the road by the end of 2027. But they still have not started construction, jeopardizing that deadline.
So, before Noack left office at the end of 2024, he signed an agreement to extend the deadline to 2030. That gave the developer three more years.
But Noack pushed the deadline extension through Commissioners Court on a “consent agenda.” Here’s where the plot thickens. Typically, consent agendas are reserved for non-controversial items, such as fixing a pothole.
However, the portion of the road covered by this 381 agreement was and is controversial for several reasons.
Last night, residents expressed concerns about decreases in property values along with increases in crime, traffic, flooding, and taxes. Residents also worried about the impacts on traffic safety and area schools.
This deal is very controversial and according to Wheeler should never have gone on the consent agenda.
Deadline Extension Also Fundamentally Changed Developer’s Obligation
Wheeler also pointed out that the deadline extension fundamentally changed the deal. The original agreement obligated Ryko to build the bridge over Spring Creek. However, the three-year deadline extension obligates them only to build the road – not the bridge. He also said the county has no plans to build that bridge, nor is it in the 2025 Road Bond.
Wheeler explained he had little to no power to stop the road or the agreement. “You cannot deny access to a public right of way to a property owner,” said Wheeler. But residents complained nonetheless.
Wheeler said that he met with Ryko and tried to buy the land from them. But he said they wanted “nine figures.” That would be somewhere north of $100,000,000 for 5,500 acres. And that would make the price per acre a whopping $18,000…for land that is largely in a floodplain and pockmarked with wetlands.
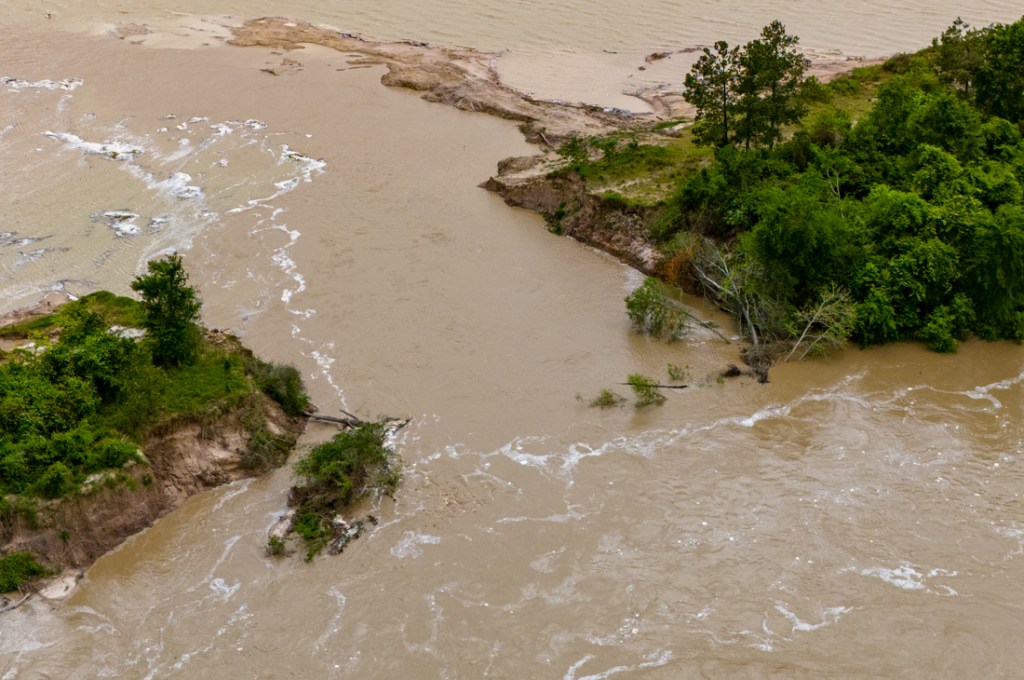
The land sits at the tip of a funnel where the San Jacinto West Fork, Spring Creek and Cypress Creek all come together. FEMA’s flood map below shows just how flood prone the area is.

Montgomery County Appraisal District currently values the land at approximately $4,000 per acre, not $18,000.
Wheeler also said that Harris County Flood Control previously offered to buy 1,800 acres of Ryko’s land – the portions closest to the West Fork and Spring Creek. However, the developer wanted $15 million. Flood Control couldn’t afford it. The land would have cost more than $8,000 per acre.
County commissioners on both sides of Spring Creek (Wheeler and Harris County Precinct 3 Commissioner Tom Ramsey), have said publicly that they would not support building a bridge over Spring Creek.
So Ryko is now battling connectivity issues to its north and south. That will limit the appeal of any developments built there. And that’s probably a good thing.
The Case for Caution
As the Federal Government reduces support for flood-mitigation and disaster relief, the financial burden will fall increasingly onto states, counties and cities to do the job by themselves. And the lowest cost way to do that is by preserving land along bayous, creeks and rivers. Prevention is always cheaper than correction.
Taking that center portion of the Townsen Blvd. extension off the Montgomery County road bond won’t prevent Ryko from developing its land. But it could make it more difficult. And, in my opinion, that is a step in the right direction.
Posted by Bob Rehak on 4/17/2025
2788 Days since Hurricane Harvey
The thoughts expressed in this post represent opinions on matters of public concern and safety. They are protected by the First Amendment of the US Constitution and the Anti-SLAPP Statute of the Great State of Texas.