Tag Archive for: water quality

West Fork Sand Mine Sending Sediment Downstream from Settling Pond

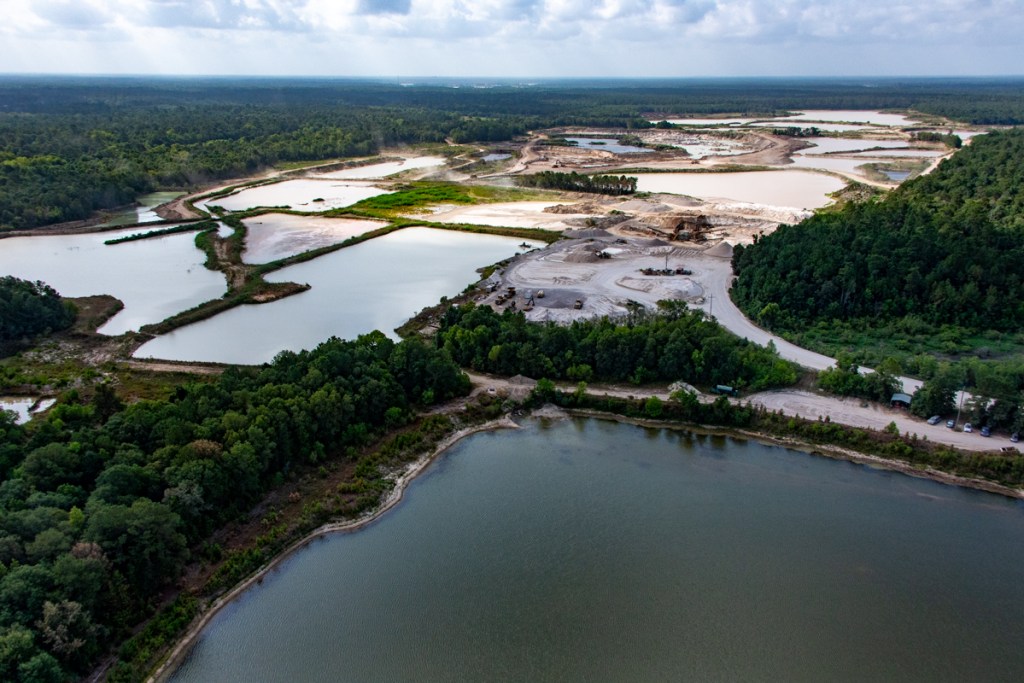
5/17/2024 – The Hallett sand mine on the San Jacinto West Fork appears to have dug a trench across the maintenance road of its settling pond to lower the pond’s level. Murky wastewater is draining into the West Fork while the SJRA is currently releasing 10,875 cubic feet per second (CFS) from Lake Conroe in the wake of yesterday’s heavy rains.

Sediment released from the mine is being picked up by the Lake Conroe water and carried downstream. Note below how sediment has discolored the West Fork.

Picture taken 5/17/24, at the confluence of the West Fork, Spring Creek and Cypress Creek. Cypress joins Spring slightly upstream on the left. The branch on the right is immediately downstream from 20 square miles of sand mines between US59 and I-45.

Where The Sludge is Coming From

In the last few weeks I’ve posted extensively about how the West Fork has breached the dikes of a pit formerly owned by Hallett. As of this afternoon, the river continues to run through that pit. No attempt has been made by the new owner to re-establish the dikes. And that certainly contributes to downstream sedimentation.

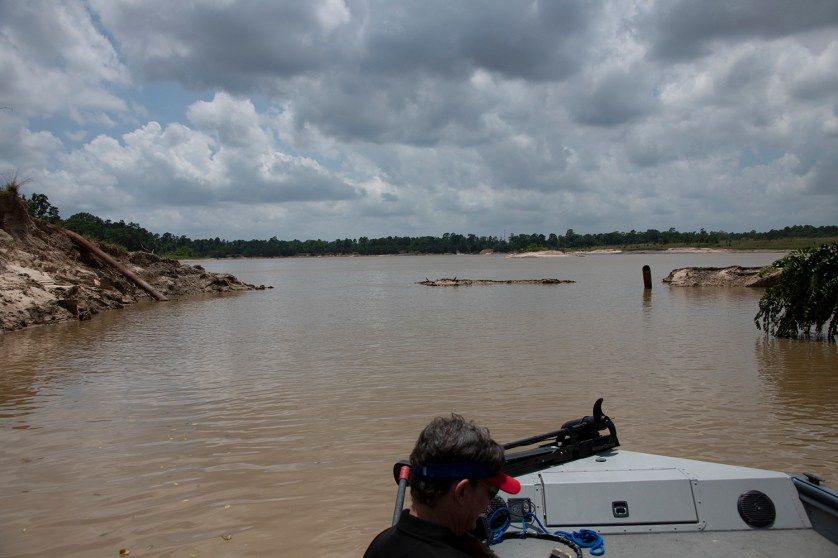
But this afternoon, I discovered an additional source of sedimentation thanks to a tip from a nearby fishermen who stumbled across a breach in Hallett’s settling pond. See video below.

Video supplied by fishermen.

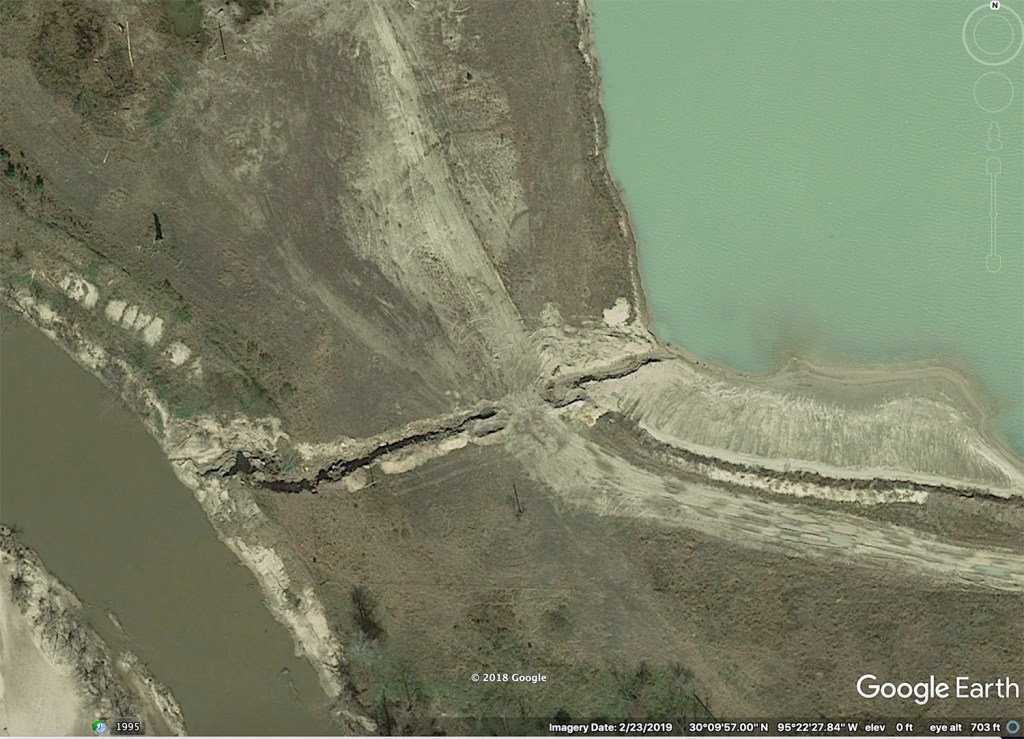
It’s hard to get a sense of the location from the close up, so here’s the location of the breach in a satellite image from Google Earth.

General location of breach and path to river in red oval.

And here’s a more detailed look at the path the water took on its way to the river.

Looking N. Silty water leaves Hallett’s settling pond through a trench dug in the tree-line. From there it flows through an abandoned sand mine and then through another breach into the West Fork.
Reverse angle shows silty water flowing out of Hallett settling pond into abandoned neighboring mine.
Detail cropped from shot above shows how heavy equipment worked the area.
Looking S downstream. Abandoned mine on left, West Fork in middle and breach through another pit on right.

Timing of Release Should Raise Eyebrows

The timing of this release is suspect: Friday afternoon just before regulators headed home for the weekend.

I’ve documented a history of breaches from this pond dating back to 2019 and the fishermen say they’ve seen breaches before that.

Hallett flushed water from this and other ponds after the January floods in 2024 but via different routes.

Lest you think I’m picking on Hallett, it isn’t the only sand mine emptying its settling pond into the West Fork.

I also documented an instance when the West Fork ran white from a release at the LMI Moorhead Mine upstream from Hallett. TCEQ estimated they released 56 million gallons of sludge into the river. That pond dropped 3-4 feet according to the TCEQ.

Regular Occurrence

The montage below shows the confluence of the West Fork and Spring/Cypress Creeks from different angles on different days. In all cases, the polluted branch was the West Fork. I took these shots while photographing West Fork sand mines from a rented helicopter.

Confluence

A former West Fork mine operator and a former water quality manager for the City of Houston tell me that releasing sediment-laden water under the cover of floods is standard operating procedure for many mines on the West Fork.

Who Will Bear the Cost of Clean Up, Dredging?

Think this doesn’t affect you? It affects your water quality and the cost of cleaning it up. Lake Houston supplies drinking water for more than two million people.

And if you live between the mines and Lake Houston, it probably will affect you another way.

Most sediment moves during floods. During Harvey, the West Fork swept through 20 square miles of sand mines between I-45 and I-69. According to the Army Corps, deposited sediment blocked the West Fork by 90%. That reduced the conveyance of the river and caused water to rise into homes and businesses. Almost 20,000 flooded in the Humble/Kingwood area.

Since then, taxpayers have spent more than $200 million on dredging. And the City is getting ready to launch another $34 million dredging program.

However, that program won’t address the mouth of the Kingwood Diversion Ditch at the River Grove Park boat launch.

KSA has obtained bids north of $800,000 to dredge the blocked area. Spending that kind of money will be necessary to keep the KSA boat launch open. It has become badly blocked by sediment during two floods since the start of the year.

Kingwood Diversion Ditch at River Grove Blocked by sediment
Here’s what that area looked like yesterday afternoon when the SJRA release rate was closer to 1500 CFS. Water level in river was still up about a foot above normal.

Living with sediment is all part of life on the river. But dredging intervals at River Grove have gone from 8 years before Harvey to 4 to 2 years since Harvey.

If this continues, KSA may be forced debate whether it can afford to keep the boat docks open.

Harris County Precinct 3 Commissioner Tom Ramsey, PE is trying to work with upstream authorities to reduce sedimentation that can lead to flooding. But it’s an uphill slog. No pun intended.

Posted by Bob Rehak on 5/17/2024

2053 Days since Hurricane Harvey

The thoughts expressed in this post represent opinions on matters of public concern and safety. They are protected by the First Amendment of the US Constitution and the Anti-SLAPP Statute of the Great State of Texas.

The Hand of Sand Miners on the San Jacinto

The hand of sand miners weighs heavily on the San Jacinto watershed. Not all miners. But many.

While exploring the river basin by helicopter last week, the contrast between two scenes struck me: 1) The natural blanket of green in Lake Houston Wilderness Park. 2) Sand mines that lined the banks of the East and West Forks for miles.

The trees and natural wetlands inhibit floods. They slow floodwaters down, hold them back during heavy rains, and reduce erosion. The sand mines do not. They may provide some floodwater detention, but the pits are often filled to the brim and their dikes often break.

How you treat the land determines how it treats you. Especially during floods. This aerial photo essay shows how the San Jacinto River Basin used to look and how it looks today.

Lake Houston Wilderness Park

Peach and Caney Creeks border Lake Houston Wilderness Park on the west. The San Jacinto East Fork borders it on the east. The shot below represents the way the whole Lake Houston area used to be.

Looking across the 5000 acres of Lake Houston Wilderness Park – the largest urban nature park in America.

Compare That With These Shots

This first provides a direct comparison.

Sand mine on Caney Creek. Lake Houston Wilderness Park in upper right.

Below, note the difference in water levels between the creek and mine. No doubt, you also noticed a difference in water color. That bright blue/green in the mine water likely comes from high chloride levels.

Site of previous breach from mine into Caney Creek, the subject of a million-dollar lawsuit by the TCEQ and the Texas Attorney General.

More Mine Photos from West Fork

I’ll provide five more shots here, all from the West Fork San Jacinto. They represent more than 500 similar shots I took on 7/22/22.

No Swimming

When I see all this environmental degradation, my mind starts swimming – despite the scary water.

  • How much sediment gets swept downstream in floods?
  • Can this land ever return to productive use?
  • Do other cities allow mining in urban environments upstream from their water sources?
  • What effect does mining have on the water quality in Lake Houston?
  • What percentage of our water bills goes to cleaning up this water?
  • Why doesn’t Texas have performance bonds that ensure sand miners leave the land in habitable shape?

The sand makes concrete. It supports growth. But is all growth good?

  • Is growth in one area at the expense of public safety in another worthwhile?
  • Should we limit the concentration of mines in an area?
  • Why do mines expect the public to pay their cleanup and reclamation costs?
  • Is it safe to build mines below a dam that releases enough water during floods to break the mines’ dikes?
  • Are there no alternatives?

Cycle Continues

New Segment H of the Grand Parkway cutting east through forests will attract more subdivisions that require more sand for more concrete.

I encourage rebuttals from any mine owner who wishes to address these questions.

Posted by Bob Rehak on July 27, 2022

1793 Days since Hurricane Harvey

The thoughts expressed in this post represent opinions on matters of public concern and safety. They are protected by the First Amendment of the US Constitution and the Anti-SLAPP Statute of the Great State of Texas.

TCEQ Commissioners to Consider Agreed Order With Double Oak Construction on Woodridge Village Enforcement Action

The month after Woodridge Village flooded Elm Grove Village and North Kingwood Forest for the first time in May, 2019, the TCEQ investigated construction practices there. In the ensuing months, six investigations found 13 violations on the Woodridge site.

More than two years later, the charges against Double Oak Construction will finally be heard by TCEQ Commissioners in their September 9 meeting. This is basically a water quality case that has to do with pollution of Taylor Gully, the San Jacinto East Fork and Lake Houston. Charges include failure to:

  • Prevent sediment-laden discharge
  • Prepare a Stormwater Pollution Prevention Plan
  • Correctly identify receiving waters for the discharge
  • Implement and maintain effective best management practices.

On TCEQ Commissioners Docket for September 9

Item 29 on their docket reads:

No. 2019-1513-WQ-E. Consideration of an Agreed Order assessing administrative penalties and requiring certain actions of Double Oak Construction, Inc. in Montgomery County; RN110478583; for water quality violations pursuant to Tex. Water Code chs. 7 and 26 and the rules of the Texas Commission on Environmental Quality, including specifically 30 Tex. Admin. Code ch. 60.

Water samples taken by the investigators showed that at the outfall:

  • Total Suspended Solids were 70 times higher compared to upstream
  • Total Dissolved Solids were almost 18 times higher.

Double Oak had been hired to clear and grub the site. That means removing trees and roots.

Unchecked erosion from site polluted water downstream with suspended solids 70 times higher than upstream.
Abel Vera had to grab his car to avoid slipping in ankle-deep sediment on Village Springs. Vera lives next to Woodridge.

Definition of Agreed Order

This enforcement action by the TCEQ falls into a category called an “Agreed Order.” A website called USLegal.com defines an agreed order as: “An Agreed Order refers to a written agreement submitted by the parties to a case resolving the issues between them. Once the agreed order is approved by the court and entered in its minutes, it becomes the order or decree of the court with all of the force and effect that any order would have after a full hearing prior to adjudication.” 

However, they add: “…until then, an ‘agreed order’ is no order at all, but merely an agreement of the parties. It has no significance … until a judicial … decision gives it significance.” TCEQ Commissioners will take that step on September 9.

Double Oak Penalties Unclear

Documents supplied in response to a FOIA request did not discuss what the penalties might entail for Double Oak. The company left the construction site long ago. It has since been sold to Harris County Flood Control and the City of Houston for a regional stormwater detention basin and sewage treatment plant. So it’s not as if Double Oak can make good by simply agreeing to clean up its act.

Typically, such cases involve a modest fine. The significance in this case: Double Oak apparently is admitting wrongdoing before a decision or settlement has been reached in hundreds of homeowner lawsuits downstream. More on those at a later date.

For More Information

For more on what led to the lawsuits, see:

Elm Grove Residents Look for Answers and Don’t Have to Look Far

What Went Wrong Part 1

What Went Wrong Part 2

What Went Wrong Part 3

What Went Wrong Part 4

What Went Wrong Part 5

Posted by Bob Rehak on 8/31/2021

1463 Days after Hurricane Harvey and 712 Days since Imelda

The thoughts expressed in this post represent opinions on matters of public concern and safety. They are protected by the First Amendment of the US Constitution and the Anti-SLAPP Statute of the Great State of Texas.

New Google Earth Image Shows Multiple West Fork Sand Mines Mixing Their Wastewater with Your Drinking Water

On its way to Lake Houston, your drinking water runs through a gauntlet of sand mines – some old, some new. Many discharge industrial process water directly into the San Jacinto River and its tributaries. The latest Google Earth LandSat images show a total of 11 between I-45 and US 59 on the West Fork doing just that. In addition, photos taken from a boat show another breach in a sand mine dike that happened more recently on Caney Creek, a tributary of the East Fork. Together, these images make a powerful case for moving mines out of the floodway and establishing best management practices for sand mines. The industry has fought both measures.

Dangers of Mining in Floodways

For miners in the Houston area, locating mines in floodways is a dangerous, but lucrative practice. Lucrative because there is less overburden for miners to move. Dangerous because rivers frequently sweep through mines during floods. The floods can then carry sediment downstream, which creates blockages that contribute to flooding.

Floods can also flush chloride-laden process water out of the mines and into your drinking water. That makes City of Houston water treatment costs more expensive. A former high level manager in the City’s water treatment department told me that he saw huge spikes in chlorides after every flood and tracked it to sand mines.

Pictures Aren’t Pretty

Massive breach in Triple-P mine on Caney Creek allows process water to mix with water in tributary for Lake Houston, source of drinking water for two million people.

After discovering the breach above, Josh Alberson whose boat we were in, spent an evening pouring over satellite images. Last week, he sent me a list of GPS coordinates to review additional suspected breaches or discharges. See the images below, all from the West Fork.

First mine north of confluence with Spring Creek. A local canoeist found three breaches in this mine last December.
Breach on right open since 2015. Breach on top left was closed after 2015. Harvey swept through all these mines in 2017.
Note the stream at about two o’clock that is carrying sediment and process water to the river.
Small pit in middle drains into West Fork.
Overflow from mine contaminating West Fork.
This pit has remained open for years at a time. Sometimes the water flows in, other times it flows out.
Follow the stream from the pit on the right to the river on the left.
It looks like someone actually installed two culverts and built a road over this breach.
Note several small breaches in the bottom of this image and how the river is about to invade the major pit in the upper right,
See the line of sediment in the clearcut area between the large green pond and the river. Discharges date back to 2006.
West Fork San Jacinto just east of I-45.

Rule Rather than Exception

I could go on. But you get the idea. The TCEQ has said 15 sand mines are currently active on the West Fork between I-45 and US59. You just looked at a dozen breaches. Historical images in Google Earth show dozens of additional breaches in this same area. This is the rule rather than the exception.

Legislative Session Ends Hope for Improvement

Meanwhile, TACA, the Texas Aggregate and Concrete association, lobbied against establishing and publishing best practices for the industry including setbacks from rivers that could prevent this type of danger.

As we went into this Texas legislative session, I had high hopes. Representative Dan Huberty introduced HB 909, a bill that would have required the TCEQ to adopt and publish a set of best management practices for sand mines.

I drove up to Austin to speak for the bill. Rob Van Til, a sand miner representing TACA, spoke against it. Watch the testimony online at this link for the Committee Broadcast Archives. Make sure you scroll down to 5/1/19 and click on the link for Environmental Regulation. It lasts about 20 minutes. Here’s a guide for those short on time. At:

  • 4:30 Huberty introduces the legislation to the committee.
  • 6:45 Adrian Shelley, representing an environmental group, speaks for the bill.
  • 8:45 Rob Van Til, representing TACA speaks against.
  • 10:45 Representative Erin Zwiener questions Van Til
  • 16.25 Bob Rehak speaks for HB 909
  • 20:00 Huberty asks for committee support

The images above show why we need to move mines out of the floodway. But sadly, HB 909 never made it out of committee. The 86th Legislature ends this week. It’s time to start gearing up for 2021.

The thoughts expressed in this post represent my opinions on matters of public policy. They are protected by the First Amendment of the U.S. Constitution and the Anti-SLAPP statute of the Great State of Texas.

Posted by Bob Rehak on May 27, 2019 with help from Josh Alberson

636 Days after Hurricane Harvey

TCEQ Lists Water-Quality Concerns About Romerica High-Rise Permit

Last week, SWCA, Romerica’s environmental consultant, requested more time to respond to concerns about the proposed high-rise development in Kingwood. On April 30, the Corps withdrew Romerica’s permit application. The Corps suggested that Romerica resubmit a new application once they worked out issues with the first submittal.

Eight Pages of Concerns

All along, Kingwood residents have expressed skepticism about the suitability of this project for the Kingwood location. Turns out the 727 residents and groups that submitted protest letters weren’t the only ones with questions.

The Texas Commission on Environmental Quality’s (TCEQ’s) letter to the Corps expresses eight pages of concerns. Keep in mind that it was dated March 1. So the developer had it for TWO MONTHS. Also remember! TCEQ was reviewing ONLY water-quality issues posed by the development.

Full Text of Letter

Reading the TCEQ letter makes one realize how deficient the original application must have been. Here is the complete text for those who want all the detail.

Summary of Key Points

For everyone else, I have summarized the main concerns below.

  1. Title 30, Texas Administrative Code (TAC), Chapter 279.ll(c)(l), states that “No discharge shall be certified if there is a practicable alternative to the proposed discharge which would have less adverse impact on the aquatic ecosystem, … ” “Please have the applicant clarify the purpose and need for the project, as portions of the proposed project are not aquatic-dependent.”
  2. From the public notice, the applicant states that “they have avoided and minimized environmental impacts by configuring the location of the proposed structures and reducing the size of the lakes within each district.” “This statement does not detail how and where wetland and stream impacts were avoided or minimized. Please have the applicant explain how and where impacts to stream and wetland resources were minimized and avoided.”
  3. “The applicant proposes to develop a mitigation site or purchase credits but says nothing more…The compensatory mitigation plan must include the objectives, site selection, the site protection instrument, baseline information, how the compensatory mitigation will provide required compensation for unavoidable impacts to aquatic resources, a mitigation work plan, maintenance plan, ecological performance standards, monitoring requirements, long-term management plan, adaptive management plan, financial assurances, and other information per the mitigation rule requirements.”
  4. “During the site visit, the resource agencies and the applicant’s representative noticed several streams that were not accounted for in the impacts tables. Please have the applicant incorporate the additional streams and revise the total amount of project impacts accordingly.”
  5. “There are several impacts within the commercial district that appear to be unaccounted for or are unidentified. Please have the applicant revise the impacts table to account for all resources that will be converted.”
  6. “Please have the applicant determine if project specific locations (PSLs) such as borrow, stockpiling, staging, and equipment parking areas associated with the project will impact wetlands. These PSL impacts should be included in the accounting of total project impacts.”
  7. “Several wetlands within the proposed project boundary will be hydrologically disconnected from the current floodplain. Please have the applicant revise the impacts tables to include wetland and stream resources that will be affected secondarily by the proposed project and address the cumulative effect of each district on the interconnectedness of the onsite wetlands.”
  8. “Please have the applicant explain in detail what measures will be taken to avoid groundwater and surface water contamination from construction activities.”
  9. “Please have the applicant provide a hydraulic analysis of the site to account for current site conditions, projected increased impervious surface runoff, as well as drainage patterns for the site, and describe how water quality on and off the project site will be protected from impacts such as erosion.”
  10. “Stormwater drainage from residential and commercial lots should be routed away from the West Fork San Jacinto River, the marina, and stream resources onsite. Stormwater should be redirected and routed to stormwater treatment features before entering the aforementioned resources. Please have the applicant provide details on how the replacement of lost onsite water quality functions will be addressed.”

Other Issues Outlined in Letter

  1. How an expanded Woodland Hills Drive would affect stream crossings
  2. The purpose and design of the so-called “water-quality ponds”
  3. The design of channels and marinas; their connectivity to the San Jacinto; and their impact on water quality
  4. The impact of boat channels on water-oxygen levels
  5. Channels that cross wetland habitat
  6. Box culverts instead of bridges
  7. Channel widths (100-foot wide for a channel 4-feet deep)
  8. Channels crossing property Romerica doesn’t own
  9. Slope of channels
  10. Diversion of stormwater from roads and parking lots away from channels
  11. Dead-end channels
  12. How domestic wastewater will be collected and treated
  13. Dissolved oxygen monitoring and reporting
  14. Applicants characterization of stream types (intermittent vs. perennial); requests “an accurate assessment.”
  15. Conservation easements on the property. (21.90 acres of wetlands are covered by a conservation easement located within the residential and commercial portions of the proposed development. “Please have the applicant verify that the conservation easement will be protected from potential development and ensure the preserved wetlands will not be impacted, directly or indirectly, from the construction of the proposed project.”

Start Over?

There may be no good answers to some of these questions and concerns. SWCA, CivilTech and Romerica must be re-evaluating the impact of these questions on the economics of their project.

This isn’t the type of stuff you need another week to figure out. These questions will make the developers rethink their commitment to the entire project.

Finding answers will likely involve a redesign of the project and that could cost more than the land itself.

Keep in mind that water quality was just one of 20 different areas that the Corps is evaluating.

TCEQ Didn’t Have Enough Info to Make Decision

I asked Peter Schaefer, a team leader within the TCEQ Water Quality Assessment Section, whether the TCEQ had made a recommendation to the Corps on this project. He said “No.”

The reason: “Because TCEQ did not receive a response to our comment letter, and the applicant had not begun the process of working with us and the Corps to address the concerns raised in the letter, TCEQ was not in a position to make a decision on the project,” said Schaeffer. Hence the detailed requests for more information.

Schaefer added, “A typical 404/401 permitting process would normally take several months, if not a year or more, for the applicant to address comments from TCEQ, Corps, resource agencies, and the public. Because of the magnitude and nature of this project, it would likely have required much more time, coordination, discussion, project revision(s), and perhaps additional public notice(s) to get to the point where the Corps was prepared to complete a Decision Document.”

Posted by Bob Rehak on 5/1/2019

610 Days since Hurricane Harvey

Dangers of Erosion when Developing Floodplains

A resident of The Commons on Lake Houston contacted me about some severe erosion in her community. I can only describe it as stunning. It destroyed trails owned by the Property Owners Association that people used for hiking, biking and horseback riding. The loss of these trails limits recreational opportunities and has physically divided large parts of the community.

Sadly, it didn’t have to be that way. Infrastructure and ditch maintenance did not keep pace with development.

As development crept closer to the East Fork of the San Jacinto over the years, the erosion worsened. In older neighborhoods on higher ground, a series of small check dams in a major drainage canal reduced erosion.

A check dam is a small dam constructed across a drainage ditch to counteract erosion by reducing water flow velocity. 

Wide grassy, gentle slopes and check dams keep erosion at bay in areas first developed.
The last check dam. Downstream, it’s different. 

Below Check Dams, Uncontrolled Erosion

The dams stop short of the East Fork. A tiny swale that residents used to step over has expanded into a steep-sided gully approximately 20 feet deep and 50-75 feet wide. Not even concrete can stop the erosion now.

Concentrated runoff below the check dams has peeled away concrete used to reduce erosion around this pipe.

Trails used to run alongside and across this ditch. Now they’ve been swallowed. Residents have nicknamed the ditch “The Grand Canyon.” They fear walking near the edge because of potential for cave-ins.

Water exits the other side of the pipe with the force of a fire hose. It has eroded a huge bowl, now eating trails and trees.
Further downstream, a shallow ditch has turned into what residents now call “The Grand Canyon.”
Resident points to where part of a horseback riding trail caved in.
Trees falling into the center force the water wider during floods, worsening erosion.
This tree created an eddy that ate away a foot path. It went from lower left to upper right.

Causes of Erosion

Erosion can result from many things. Multiple factors played a role in the Commons.

As the developer built up land to elevate foundations, he increased the slope. That accelerated runoff.

Clearing land for a new subdivision along the ditch also accelerated erosion of soft, sandy soil.

Finally, concentration of runoff also played a major role. When runoff spreads out over over acres, it poses no threat. But concentrating it turns a thousand trickles into a firehose aimed at loose, sandy soil. The result: severe erosion every time it floods.

Residents of The Commons have already seen how that erosion can destroy recreational opportunities and infrastructure. They pray that their developer will fix the Grand Canyon before it starts eating homes.

Lessons for Kingwood

This Commons story contains timely lessons for the residents of Kingwood as we consider a potential high-rise development in the floodway and floodplain of the San Jacinto.

The Commons erosion reminded me of the Kingwood Rapids. Whitewater enthusiasts gave that name to the drainage ditch that runs between Kingwood and Forest Cove near Deer Ridge Park, just south of Walnut Lane (see below).

The drainage ditch between Walnut Lane and Deer Ridge Park has jokingly been dubbed the Kingwood Rapids by whitewater enthusiasts. Ditch erosion now threatens yards and fences. Image courtesy of Google Earth.

The proposed new high-rise development would use this ditch to drain hundreds of acres that they intend to pave with concrete.

“Kingwood Rapids” in 2009 shows same processes at work here that threaten the Commons.

High-Rise Concern: Erosion and Incision

As you can clearly see, the ditch can barely handle existing runoff during storms. It’s severely eroding.

Draining high-rise, high-density commercial space into these ditches will cause them to “incise.” Incise means “cut into.” Runoff will deepen and/or widen ditches. But ditch erosion already threatens nearby homes.

This same ditch runs through River Grove Park, which already cost Kingwood residents more than half a million dollars in repairs after major storms in 2015, 2016 and 2017. The soccer program at River Grove still has not fully recovered. The lacrosse league has abandoned its lease there. One shudders to think of the damage that the loss of River Grove to do to the entire community.

Impact on Water Quality

All this erosion also has a direct impact on water quality in several ways. First, the sediment flows into the lake. There, it reduces lake capacity. The sediment also increases turbidity, which increases water treatment costs and harms riparian vegetation. That vegetation helps stabilize banks, protect property and provide cover for fish which waterfowl and eagles feed on6

More food for thought as you compose your letters to the TCEQ and Army Corps.

Posted by Bob Rehak on 1/16/2019

506 Days since Hurricane Harvey

San Jacinto West Fork Watersheds Partnership Focusing on Water-Quality Issues

The Houston Chronicle yesterday reported on a coalition called the West Fork Watersheds Partnership (WFWP), tackling water quality issues on the West Fork of the San Jacinto and its tributaries. The article claims that the West Fork and one of its tributaries fail to meet water quality standards. It also cites the dangers of fecal material in the water.

The Houston-Galveston Area Council (HGAC), Galveston Bay Estuary Program, TCEQ, and EPA are leading the WFWP, which includes a wider group of organizations, businesses and residents concerned about water quality.


The map above shows critical levels of bacteria in the upper San Jacinto River basin. Red means “impaired.” Green means “not impaired.” In fresh water the indicator bacteria is E. coli. When present, it is likely that other disease-causing bacteria, parasites, and viruses may also be present. Source: H-GAC’s Water Resources Information Map.

The Houston-Galveston Area Council Water Resources Information Map above indicates just how critical bacteria have become. It features water-quality data from the H-GAC’s Clean Rivers Program, which helps ensure safe, clean surface water for the region by providing high quality data. H-GAC works with seven partner agencies to collect and analyze data from over 450 monitoring locations throughout the region.

Bacteria levels are measured at all monitoring locations. In fresh water the indicator bacteria is E. coli. These bacteria originate in the intestinal tract of warm blooded animals and can be harmful to humans. When either of these bacteria are present, it is likely that other disease causing bacteria, parasites, and viruses may also be present.

How does bacteria get into our waterways?

According to H-GAC, bacteria can enter surface waters through many pathways. Most water bodies have most, if not all, of the following bacteria sources.

  • Malfunctioning wastewater treatment plants
  • Sanitary sewer system overflows
  • Failing Onsite Sewer Facilities (OSSFs) and septic systems
  • Runoff from livestock
  • Pet waste
  • Wildlife and feral hogs

Each water body is unique in the combination of bacteria sources and the amount from each source that makes up the total bacteria present.

Why should we care about bacteria?

The water you drink from a tap has been treated to remove bacteria. However, anyone who ingests contaminated water, i.e., when swimming or during a flood, can become ill. People with compromised immune systems or individuals with open wounds or cuts that come into contact with contaminated water are especially vulnerable. A Kingwood resident who had a cut and was exposed to floodwater during Harvey died from flesh-eating bacteria.

Contaminated water can also cause diseases such as:

  • cholera
  • dysentery
  • giardiasis
  • hemolytic uremic syndrome
  • hepatitis
  • typhoid fever

Turbidity a Complicating Factor

The U.S. Geological Survey (USGS) indicates that excessive turbidity, or cloudiness, in drinking water may also represent a health concern. “Turbidity can,” says the USGS, “provide food and shelter for pathogens. If not removed, turbidity can promote regrowth of pathogens in the distribution system, leading to waterborne disease outbreaks, which have caused significant cases of gastroenteritis throughout the United States and the world. Although turbidity is not a direct indicator of health risk, numerous studies show a strong relationship between removal of turbidity and removal of protozoa. The particles of turbidity provide “shelter” for microbes by reducing their exposure to attack by disinfectants. Microbial attachment to particulate material has been considered to aid in microbe survival. Fortunately, traditional water treatment processes have the ability to effectively remove turbidity when operated properly. (Source: EPA)”

Any increase in sedimentation beyond the baseline level of nature increases the difficulty and cost of water purification. USGS data shows a spike in turbidity after every major rain. The rain carries exposed sediment to the river. Some comes from urban environments; some comes from stream beds, agricultural land and construction sites; and some comes from sand mines.

USGS has set up a special website that lets you monitor water-quality data from dozens of gages in and around Lake Houston, many of them in real time.  If you are ever concerned about water quality issues, this is a good place to start your investigation.

Graph showing how turbidity spiked in Lake Houston after three major storms in 2015, 2016 and 2017.

Posted by Bob Rehak on September 12, 2018

379 Days since Hurricane Harvey

A Model for the Future of the San Jacinto

The rapid growth of sand mining along the San Jacinto has contributed to an increasing rate of sedimentation of the river and Lake Houston.

Consequences of Increased Sedimentation

Sediment has contributed to:

  • Flooding that cost residents and businesses billions of dollars in damages during Harvey.
  • Forcing taxpayers to spend tens, if not hundreds of millions of dollars in dredging costs to restore the river’s carrying capacity and reduce flood risk.
  • Decreasing the capacity of Lake Houston at a time when the City is about to add 1.5 million users to it’s main water system.
  • Increasing the City’s water purification costs, which are passed along to customers.
  • Impairing fish populations and recreational opportunities

Ignoring Best Management Practices for Buffer Zones

Following best management practices that are common in other states – especially those that mandate buffer zones between mines and rivers – might have prevented or reduced many of these problems. But those practices were not followed here; miners mine so close to the San Jacinto that dikes are broken repeatedly. When caught, miners pay fines averaging $800.

The Lone Exception In Texas

With one exception, Texas has shown little desire to force miners to follow best management practice for setbacks in flood prone areas. That exception is the John Graves Scenic Riverway, a pilot project on a small portion of the Brazos River near Mineral Wells, about 40 miles west of Fort Worth.

Legislation Addressed Water-Quality Impacts from Sand Mining

The legislation that created the Riverway forms a precedent for imposing stricter regulations on sand mining in the Houston region. The name “Scenic” belies the major purpose of the legislation, which was to address water-quality impacts from rock, and sand and gravel mining operations.

Perhaps there’s an opportunity to create a protected area much like that one here.

Statewide Survey Found Widespread Noncompliance

The TCEQ conducted a statewide survey of 316 quarries in 62 counties, beginning in April, 2004. It revealed that noncompliance with permits was a statewide problem. It also revealed that noncompliance sometimes resulted in significant detrimental effects to water quality. One such area was the one that eventually became the John Graves Scenic Riverway area, where best management practices were not being followed.

Key Elements of Legislation Protecting Water

Legislation that formed the area focused on stormwater discharges and their effect on water quality. Key provisions included:

  • Stricter erosion controls and effluent limits
  • Reclamation of quarries and financial provisions to ensure reclamation
  • Restoration of receiving waters in the event of an unauthorized discharge
  • Prohibition of mining within two hundred feet of the river and the hundred-year flood plain
  • Prohibitions against locating quarries in areas subject to frequent flooding.

Brazos River Authority photo shows setback of mines from the Brazos River in the John Graves Scenic Area, one of the main requirements of legislation.

Contrast the previous photo with this one. On the San Jacinto, mines operate within the floodway with as little as 40 feet of separation from the river. One mine (lower right) operated with a broken dike for more than 3 years. Dikes in this area have been broken and breached at least six times since 2015. 

Model For San Jacinto

The Brazos River protection plan could benefit not only the Lake Houston Area, but Houston itself and other upstream communities, such as Porter as well.

The San Jacinto River, one of the main sources of the area’s drinking water, flows through, not around, sand mines on a regular basis. The mines are not only located within the 100-year flood plain, many are located within the FLOODWAY! This means they are in the main flow of the river during floods and experience higher velocities. Approximately 150,000 cubic feet of water per second flowed through these mines during the peak of Harvey, washing out roads and dikes.

USGS Maps Show Mining in Floodway

Twenty-square miles of exposed sand and sediment exist within these mines between I-69 and I-45. This screen capture below is just upstream from I-69.

Some West Fork mining operations are not only in the floodplain, they are in the FLOODWAY! The Red/Aqua cross-hatched areas above show the floodway, while the Aqua shows the 100-year flood plain.

Other sand mines farther upstream are in the 100-year flood plain as well. Some are also in the floodway. See for yourself.

Photos Contradict TACA Claims

TACA, the Texas Aggregate and Concrete Association, claims that water “backs into mines during floods,” but quite the opposite is true; it roars through them, ruptures roads and dikes, and carries exposed sand downstream.

Other tributaries contribute sediment to Lake Houston and the West Fork. However, other tributaries do not have 20 square miles of exposed, unprotected surface on their banks in the form of sand mines. And other tributaries are not flushed with an additional 80,000 cubic feet of water per second when Lake Conroe opens its flood gates as it did during Harvey.

Mines Contribute to Loss of River and Lake Capacity

Lake Houston is losing capacity at a rate of increase that parallels the rate of growth in sand mining.

Houston City Council Member Dave Martin says that the San Jacinto River and Lake Houston will soon supply drinking water to more than two million people, including residents of Houston, Humble, Bellaire, Jersey Village and other cities.

However, Lake Houston is rapidly losing capacity because of sedimentation at a time when demand for its water is increasing exponentially.

The capacity of Lake Houston is decreasing at an increasing rate. By 2011, the Lake had already lost 25% of its capacity. Results of the sedimentation survey done this year have not yet been released.

Mines Contribute to Turbidity, Increasing Water Treatment Costs

When the State protected the Brazos in the early 2000’s, sand mining was not nearly the problem on the San Jacinto that it is today.

Every time it rains, turbidity in the water increases the City’s water treatment costs, by 20% to 100%, according to Houston City Council Member Dave Martin. “We also see significantly more challenges in capturing and removing the solids through the plants dewatering facilities.”

USGS shows how the clarity of Lake Houston changes before and after every major storm.

Add Dredging Costs to the Damage Assessment

Dredging a tiny 2.1 mile stretch of the West Fork of the San Jacinto is likely to cost taxpayers up to $70 million – and that does not even include the giant bar at the mouth of the West Fork that is backing water up,  contributing to flooding, rerouting the river through neighborhoods and threatening infrastructure.

That estimated $70 million is just the tip of the iceberg. Maintenance dredging that returns the river and lake to their original design capacities could cost far more.

$70 million covers dredging only from River Grove Park to a few hundred yards past the West Lake Houston Parkway Bridge. It does not include the East Fork, the West Fork between Fosters Mill and the Lake, the giant mouth bar at the junction of the West Fork and the Lake, Lake Houston above the FM1960 Bridge, or West Fork upstream from River Grove.

That’s an additional 13+ miles. And keep in mind that the U.S. Army Corps is only dredging to pre-Harvey depths. Returning the lake and river channel to their original 100-year flood design capacity would require deeper dredging. That would cost more per mile than the current project between River Grove and Kings Harbor.

Make Mines Part of the Solution, Not the Problem

Prohibiting mining within the 100-year flood plain will create a natural buffer between mines and the river that can trap sand before it becomes a problem.

As mines play out in the area between I-69 and I-45, they can help solve our sedimentation and flooding problems by being:

  • Restored as wetlands
  • Refilled to their natural grades with the spoils from dredging
  • Turned into detention ponds.

Previously, some miners have remediated sand pits after they played out, but many others have not. This pit, for instance, one block north of Townsen next to North Houston Ave. in Humble has been left unfenced, ungraded and unplanted for years. It currently poses a danger to children who play in it and businesses building around it.

Defunct Humble sand pit on North Houston Road just north of Townsend Blvd. Note steep, unvegetated slopes, lack of berms, lack of fencing, and proximity to back of new bank building on adjacent property – all violations of best practices in most states. 

Fortunately, the U.S. Army Corps of Engineers plans to use this pit and one other as a placement site for the spoils from its current emergency dredging project.

Let’s create a protected waterway on the San Jacinto, much like the John Graves area on the Brazos.

Posted July 1, 2018 by Bob Rehak

306 Days since Hurricane Harvey