Tag Archive for: NWS

NOAA Predicts Below-Normal 2026 Atlantic Hurricane Season

5/21/2026 – Forecasters with NOAA’s National Weather Service predict a below-normal hurricane season for the Atlantic basin for 2026. The Atlantic season runs June 1 to November 30. NOAA predicts a 35% chance of a near-normal season, a 10% chance of an above-normal season, and a 55% chance of a below-normal season.

The agency predicts a total of 8-14 named storms (winds of 39 mph or higher). Of those, it forecasts 3-6 will become hurricanes (winds of 74 mph or higher). That includes 1-3 major hurricanes (category 3, 4 or 5 with winds of 111 mph or higher).

An average season has 14 named storms with seven hurricanes, including three major hurricanes. 

NOAA has a 70% confidence in these ranges. If the 2026 North Atlantic hurricane season ends up below-normal, it would mark only the second season in the last decade without above-normal activity. Since the current Atlantic high-activity era began in 1995, 22 of 31 (about 70%) seasons have had above-normal activity. Only 5 (17%) and 4 (14%) have had near- and below-normal activity, respectively. That’s based on the 1951-2020 climatology.

Also, 10 (almost half) of the above-normal years (thus 32% of the 31 years) have been hyperactive (ACE of 165% of median). 

Key Factors Driving NOAA’s Forecast

NOAA based its below-normal predictions on competing factors.

  • El Niño should develop and intensify during the hurricane season. This creates wind shear in the Atlantic which discourages hurricane formation.
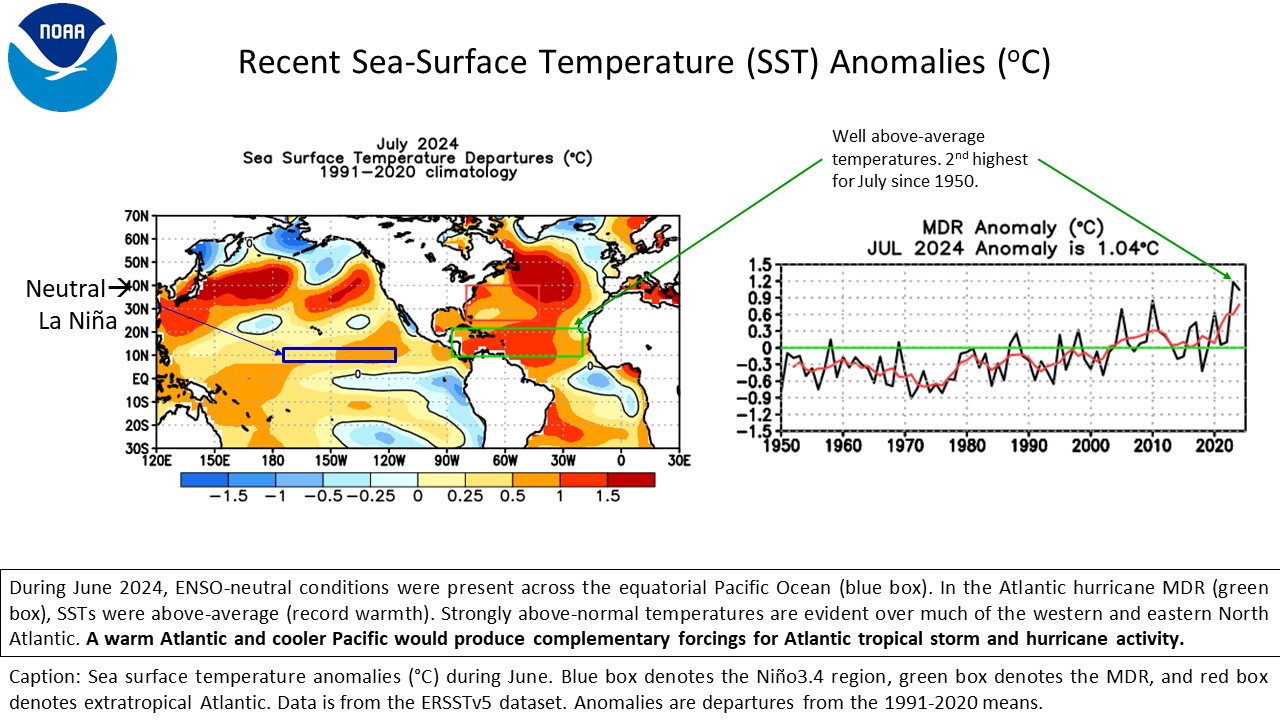
  • Atlantic ocean temperatures should range slightly warmer than normal
  • Trade winds will likely be weaker than average.

El Niño conditions tend to support fewer tropical storms and hurricanes, while warmer ocean temperatures and low winds support a more active year.

“Although El Niño’s impact in the Atlantic Basin can often suppress hurricane development, there is still uncertainty in how each season will unfold,” said NOAA’s National Weather Service Director Ken Graham. “That is why it’s essential to review your hurricane preparedness plan now.”

“It only takes one storm to make for a very bad season.”

National Weather Service Director Ken Graham

Below are the storm names for 2026.

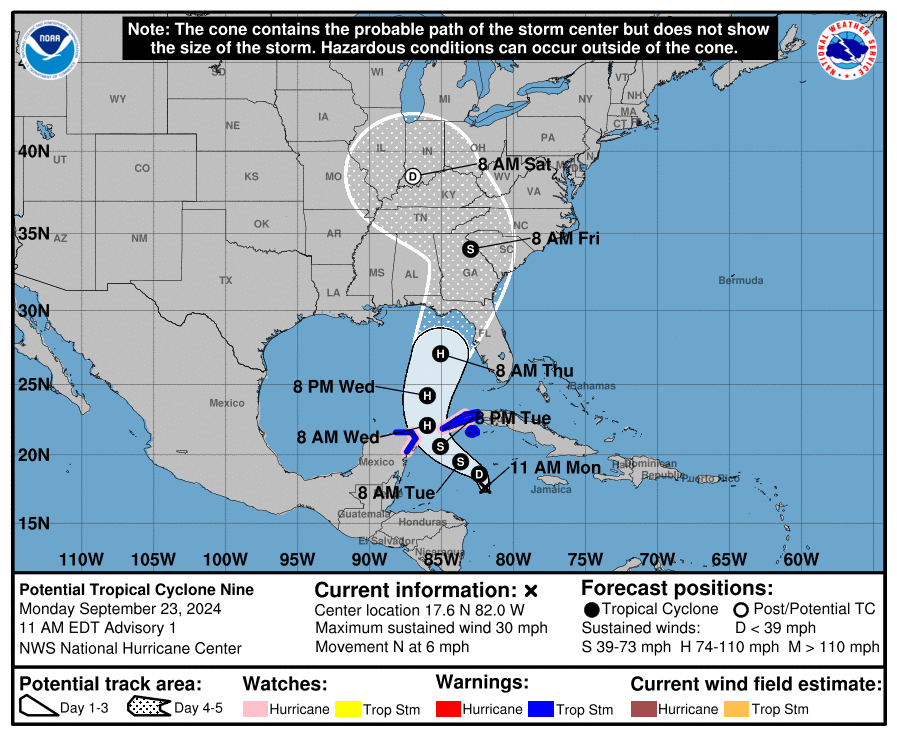
Not a Landfall Forecast

NOAA’s outlook is for overall seasonal activity based on large-scale weather and climate patterns. It does not indicate where or when any storms may affect land. That is determined by short-term and variable weather patterns. This is not a landfall forecast

Importance of Preparation

“Preparing now for hurricane season — and not waiting for a storm to threaten — is essential for staying ahead of any storm. Visit weather.gov/safety and Ready.gov for important preparedness information,” added Graham.

New, Enhanced Communication Products This Season

“NOAA’s rapid integration of advanced technology, including AI-based weather models, drones, and next-generation satellite data will deliver actionable science to safeguard the lives and livelihoods of the American people,” said NOAA Administrator Neil Jacobs, Ph.D. “These new capabilities will produce the most accurate forecasts possible to protect communities in harm’s way.”

  • NOAA’s National Hurricane Center (NHC) will implement an improved version of the tropical cyclone forecast cone graphic that will now include tropical storm and hurricane watches and warnings for inland areas for the continental United States, Hawaii, Puerto Rico and the U.S. Virgin Islands. 
  • NHC will begin testing an experimental version of the tropical cyclone track forecast cone that will capture a greater range of possibilities for the track of the storm by incorporating uncertainties for both direction of movement and timing.  

Advancements to Hurricane Analysis and Forecasts

Advances are not just in communication:

  • NOAA, in collaboration with the Unified Forecast System community, is testing an experimental high-resolution Seasonal Forecast System that utilizes the latest modeling technology and new methods to assess the evolution of the global ocean-atmosphere system. The system is helping forecasters better simulate tropical storms and hurricanes, and more effectively predict the number of hurricanes and major hurricanes. 
  • NOAA’s Atlantic Oceanographic and Meteorological Laboratory (AOML) is using machine learning to quality-control data collected from tail Doppler radar — a specialized radar system mounted on the back of NOAA’s “Hurricane Hunter” aircraft. This new method gathers more than 25% more meteorological data than the current method and leads to more high-quality data to support structure and wind analysis by forecasters.

New, Innovative Forecasting Technologies

The 2026 Atlantic seasonal outlook will be updated in early August, ahead of the historical peak of the season, which typically extends from mid-September through October.

Posted by Bob Rehak on 5/21/2026 based on information from NOAA and NWS

3187 Days since Hurricane Harvey

On Eve of Hurricane Season, NOAA, NWS, NHC, FEMA Struggle with Cuts

5/31/25 – The 2025 Hurricane Season starts tomorrow, 6/1/25. But ironically, despite predictions of an above-average season, the federal agencies that help forecast hurricanes, issue warnings, and provide disaster relief are struggling with significant funding, staff and program cuts.

Poignant Letter in New York Times

Michael Lowry, who served as a senior scientist at the National Hurricane Center (NHC), a planning chief at FEMA, and a hurricane expert at the Weather Channel, wrote a poignant letter published in the New York Times today under the headline “A Hurricane Season Like No Other.”

The letter began with an anecdote about data collection from inside Hurricane Milton last year by a Hurricane Hunter crew. The data they collected about “vortex alignment” heralded rapid intensification of the storm. Within 24 hours, it had become the strongest hurricane in 20 years with 180 MPH winds.

Milton satellite
Milton as it began intensifying and heading toward the Florida Coast

But there was no surprise on the Florida coast. The forecasts gave “enough time for people in the highest-risk areas to safely evacuate and businesses to prepare for the worst.”

Lowry then segues to budget, staff and program cuts at FEMA, NOAA, NHC, the National Weather Service (NWS), Hurricane Hunters, and more. Some examples:

  • NWS offices that have lost 60 percent of their staff members, including entire management teams.
  • Nearly half of NWS local forecast offices are understaffed, with vacancy rates of 20 percent or higher.
  • Weather balloon launches are down 15 to 20 percent nationwide. The balloons increase forecast confidence and let evacuation orders be made sooner. 
  • New budget documents released Friday propose eliminating NOAA’s research wing, the Office of Oceanic and Atmospheric Research, which lends mission-critical support to the hurricane hunters.

Along the way, Lowry points out that “The National Weather Service costs the average American $4 per year in today’s inflated dollars — about the same as a gallon of milk — and offers an 8,000 percent annual return on investment, according to 2024 estimates.”

“Without the arsenal of tools from NOAA and its 6.3 billion observations sourced each day, the routinely detected hurricanes of today could become the deadly surprise hurricanes of tomorrow,” he says.

Bottom line: Lowry says we’re jeopardizing decades of progress that have increased forecast accuracy and warning times. And that will put more people at risk.

Dizzying Days for FEMA: Cuts and More Cuts

Andrew Rumbach, a Senior Fellow with the Urban Land Institute writes about policies for disaster risk reduction. He wrote a Substack post in early May called “100 Dizzying Days for FEMA.” It details the dismantling of disaster-relief and flood-mitigation capabilities including:

Could States Do What FEMA Does?

An article in the June 9 issue of Time Magazine addresses whether states could do what FEMA does. The consensus: it makes more sense to manage disaster response at the federal level. Why? It’s more efficient. If you spread disaster responsibilities among 50 states, you will have a lot of people sitting around a long time between disasters. FEMA can shift people from state to state, disaster to disaster, and keep them busier.

Experts cite the need for reform. But getting rid of the system without a meaningful replacement is likely to cause harm.

My takeaway from the article: Surgeons experience better outcomes with scalpels than cannons.

Erosion of Safety Margins

We live in a time of uncertainty. I’m not sure which is scarier: major hurricanes, a reduction in forecasting capabilities, or the loss of disaster-relief and flood-mitigation assistance.

These cuts will erode safety margins. Sixty million Americans reportedly live in areas regularly impacted by hurricanes.

If you haven’t already completed preparations for hurricane season, check out this NWS page on Hurricane Safety Tips and Preparations. Before someone takes it down to save a buck.

Posted by Bob Rehak on 5/31/25

2832 Days since Hurricane Harvey

NWS Publishes 2025 Hurricane Guide Tailored for SE Texas

The National Weather Service in Houston has published a 2025 Hurricane Guide tailored for the southeast Texas area. The guide includes information about how to prepare for all hazards associated with hurricanes, including strong winds, storm surge, flooding, and tornadoes.

The 38-page guide is filled with helpful tips, explanatory visuals, checklists, evacuation routes, easy-to-read text and helpful links. Whether you grew up in the area or recently arrived, this guide contains updated information for you.

Bolivar after Ike
Destruction on Bolivar Peninsula After Hurricane Ike
Contents

The guide begins with lists of hurricane names for this and the next four years and a readiness checklist. Next, it discusses changes to familiar National Hurricane Center graphics, including a new 2025 look for forecast cone graphics.

For boaters and beachgoers, the brochure contains a discussion of hurricane surf and rip currents, and why even distant hurricanes can be deadly.

One of the most eye-opening sections discussed how storm surge from Category 1, 3 and 5 hurricanes would affect communities from the Bolivar Peninsula to Matagorda Bay. I was shocked to see that surge from a Cat 5 storm could reach inside Loop 610 through the bayous and up to the Lake Houston Dam.

Next came a series of preparation tips for people who live and work in different types of structures. They include but are not limited to recommendations for:

  • Protecting vital records
  • Pet safety
  • Insurance (before and after the storm)
  • Emergency contacts
  • Supply kits
  • Time-sensitive checklists:
    • Actions to take when a storm is in the Gulf
    • Final actions to take if leaving
    • Final actions to take if staying
  • Where to find forecast/emergency information
  • Tourist safety

The guide concludes with sections on:

  • How people with special needs or disabilities can register for assistance
  • Evacuation routes
  • Evacuation zones by zip code
  • Returning home
  • Cleanup
  • Emergency management contacts for counties and cities throughout the region

Start Now

This is a great all-in-one guide. You can download the English version here. Or the Spanish version here.

Remember, hurricane season starts in less than a month and storms may strike even before then.

Posted by Bob Rehak on 5/2/25 with thanks to NWS/Houston.

2803 Days since Hurricane Harvey

Despite Drought in Second Half, 2024 Was 8th Wettest Year in the Last 25 at IAH

2/2/25 – National Weather Service statistics show that despite drought in the second half, 2024 ranked as the 8th wettest year in the last 25 at Bush Intercontinental Airport.

8th Wettest Year in Last 25

Bush received 59.17 inches in 2024 compared to:

  • 71.19 in 2001 (the year of TS Allison)
  • 59.71 in 2002
  • 65.06 in 2004
  • 65.52 in 2007
  • 70.03 in 2015 (Major Storms included May 25-27 [11″ in 3 hrs] and October 31 [up to 12″ in 12 hours])
  • 60.96 in 2016 (the year of Tax Day and Memorial Day Floods
  • 79.69 in 2017 (the year of Harvey)

2017 was the highest year in 25. And 2011 was the lowest at 24.57 inches.

Abnormal Rainfall Distribution

In 2024, more than half of the normal rain for the year (52.1 inches) fell in just three months. They totaled 30.71 inches.

  • January had 8.77″ (more than double the mean of 3.94″ for the month)
  • May had 11.05″ (almost double the mean of 5.83″ for the month)
  • July had 10.89″ (more than double the mean of 4.45″ for the month)

Hurricane Beryl struck Houston on July 8 and dropped a normal month’s worth of rain in one day (4.72″). Beryl was the earliest Category 5 hurricane on record.

Graphics Tell the Story

The table below shows the official National Weather Service totals for each month since January 2000, plus the means, maximums and minimums.

In graphical form, here’s how 2024 compared to the high, low and normal years.

Note how slope of green line decreases after Beryl. That’s when drought struck SE Texas.

The distribution of heavy rainfalls throughout the year was unusual. January doesn’t normally have heavy rainfall. Neither does July. And while May ranks as one of our wetter months, last year we got almost twice the normal amount of rain in May.

At the other end of the spectrum, October usually ranks as our second wettest month.

But last October, it was our driest of the year by far…with less than a half inch of rain.

NWS provides a wealth of climate information for those willing to take the time to explore it. It doesn’t always fit popular narratives. If you want to teach critical thinking skills to your students, have them try to prove or disprove claims they see online by consulting data from trusted sources, such as NWS.

And make sure when they report their findings that they don’t just say “8th wettest year,” even though it may seem like that to them. Make sure they specify a date range, i.e., “2024 was 8th wettest year in last 25,” so no one assumes “ever.”

Posted by Bob Rehak on 2/2/25

2714 Days since Hurricane Harvey

NWS Issues Cold Weather Advisory, Winter Storm Watch

1/18/25 – Don’t get a flood in your attic. The National Weather Service (NWS) has issued a cold weather advisory and a winter storm watch for the entire Houston region. Sub-freezing temperatures and extreme wind chills mixed with ice and snow are expected. The:

  • Cold-weather advisory runs from 3 AM to 12 PM on January 19th.
  • Winter-storm watch takes effect on Monday January 20, 2025 at 6PM and will last until Tuesday at the same time.

For more details on each, see below.

Cold Weather Advisory Details

WHAT: Very cold wind chills below 20 degrees are expected.

WHERE: Portions of south central and southeast Texas.

WHEN: From 3 AM to noon CST Sunday, January 19, 2025

IMPACTS: Wind chill values can lead to hypothermia with prolonged exposure.

PRECAUTIONS: Use caution while traveling outside. Wear appropriate clothing, a hat, and gloves. Keep pets indoors as much as possible. Make frequent checks on older family, friends, and neighbors. Ensure portable heaters are used correctly. Do not use generators or grills inside.

Winter Storm Watch Details.

WHEN: Monday evening through Tuesday afternoon

WHAT: Heavy mixed precipitation is possible with total snow and sleet accumulations up to 3 inches and locally higher amounts. Ice accumulations of up to one tenth of an inch possible for portions of south central and southeast Texas.

IMPACTS: Roads, and especially bridges and overpasses, will likely become slick and hazardous. Plan on slippery road conditions. The hazardous conditions could impact the Tuesday morning and evening commutes.

PRECAUTIONS:

  • Be where you plan to be by 6:00 PM Monday for the duration of this winter storm event.
  • Monitor the latest forecasts for updates on this situation. Delay all travel if possible.
  • If travel is absolutely necessary, drive with extreme caution and be prepared for sudden changes in visibility.
  • Leave plenty of room between you and the motorist ahead of you, and allow extra time to reach your destination.
  • Avoid sudden braking or acceleration, and be especially cautious on hills or when making turns. Make sure your car is winterized and in good working order.

WHERE: Houston; Trinity; Madison; Walker; San Jacinto; Polk; Burleson; Brazos; Washington; Grimes; Montgomery; Northern Liberty; Colorado; Austin; Waller; Inland Harris; Chambers; Wharton; Fort Bend; Inland Jackson; Inland Matagorda; Inland Brazoria; Inland Galveston; Southern Liberty; Coastal Harris; Coastal Jackson; Coastal Matagorda; Coastal Brazoria; Coastal Galveston; Matagorda Islands; Brazoria Islands; Galveston Island; Bolivar Peninsula.

What to Expect within Metro Area

Jeff Lindner, Harris County’s meteorologist provided this additional detail.

As a cold front moves through the area today, look for increasingly colder conditions into Sunday and next week. Expect a substantial drop in the temperatures tonight into Sunday.

The freezing line will make it down toward the north and western sides of the metro area Sunday morning. When combined with gusty northerly winds of 15-25mph, wind chills will fall into the 10’s and 20’s for much of the area.

A more significant freeze is likely Monday morning with lows into the 20’s for much of the area and into the low 20’s north of HWY 105. Expect similar lows on Tuesday morning. Coldest temps will be on Wednesday morning with possible ice/snow cover and clearing skies resulting in maximum cooling conditions.

The duration of sub-freezing temperatures will be critical. Much of the area looks to fall below freezing Monday early evening and not rise above freezing until Wednesday afternoon.

Even then, it may only be a few degrees above freezing for a few hours. We could potentially experience sub-freezing temps for 36-45 hours over much of the area – and possibly longer.

Monday AM Forecasted Low Temperatures: 
  • North of HWY 105: 22-26
  • North of I-10: 25-29
  • Houston metro (inside Beltway): 27-29
  • Coastal Counties: 28-30
  • Beaches/Galveston: 31-33
Tuesday AM Forecasted Low Temperatures:
  • North of HWY 105: 22-26
  • North of I-10: 26-30
  • Houston metro (inside Beltway): 27-29
  • Coastal Counties: 28-30
  • Beaches/Galveston: 30-32
Wednesday AM Forecasted Low Temperatures: 
  • North of HWY 105: 17-20
  • North of I-10: 18-21
  • Houston metro (inside Beltway): 19-21
  • Coastal Counties: 19-24
  • Beaches/Galveston: 30-32
  • Maximum preparations and precautions for sub-freezing conditions for many hours should be completed this weekend. Failure to complete proper precautions may result in significant damage to vegetation and infrastructure.  
Winter Precipitation: 

Once the cold air is in place on Monday, another front will move through. Expect snow along and north of I-10 with the potential for a mixture of freezing rain/sleet/snow south of I-10. Models suggest the storm may move across the area in bands, resulting in much higher precipitation totals locally. This scenario occurred in 2004, 2008 and 2009.

Snow accumulations of 1-3 inches (or more locally) are possible along and north of I-10. Expect lower amounts south of I-10.

There is a:

  • 70-85% chance much of the area will see at least a tenth of an inch of snow.
  • 35-50% chance the area south of I-10 will get ice.

We could still be dealing with travel issues into Thursday morning. Aviation will be heavily impacted. Snow will clog runways and de-icing of planes will likely be necessary.

Forecast Graphics

Monday AM Low Temps:
Tuesday AM Low Temps:
Wednesday AM Low Temps:
Probabilities of Snow and Freezing Rain:
Snow Accumulation through Tuesday 600am (additional accumulation is likely after 600am)
Ice Accumulation through Tuesday 600am (additional accumulation is likely after 600am)

Posted by Bob Rehak on 1/18/25 based on information from NOAA, NWS and Jeff Lindner

2699 Days since Hurricane Harvey

NHC Issues Advisory on Potential Tropical Cyclone 9

9/23/24 at 12 PM – The National Hurricane Center has designated a disturbance in the northwestern Caribbean as Potential Tropical Cyclone 9. Currently, NHC gives the storm a 90% chance of development in the next two days.

According to Harris County Meteorologist Jeff Lindner, models indicate it will likely escalate into a Category 4 hurricane as it heads north over the warm waters of the Gulf.

However, it will likely make landfall along the Florida Panhandle. Current forecasts indicate no threat to Texas. Overnight, the projected track of the storm shifted farther east.

Projections as of Noon Monday

I’m posting this because Houston residents may have friends, relatives or travel plans in affected areas. See below.

Center of storm has equal change of tracking anywhere within cone. Cone does not indicate width of storm.

Tropical storm force winds associated with Potential Tropical Cyclone 9 should arrive in the big bend area of the Florida panhandle sometime between Wednesday night and Thursday morning.

NHC predicts a 50:50 chance for tropical storm force winds extending north into Georgia.

The National Weather Service has this to say for people in the Panhandle and southern Georgia, “There is a potential for significant storm surge; heavy rainfall and flooding; and strong winds across the north and eastern Gulf Coast.”

“Impacts could begin as early as Wednesday night and last into Friday,” says NWS. “More detailed and specific impacts will be highly dependent on future track/intensity and we’ll be including those in future updates in the next day or two.”

Winds have a 95 percent chance of a 75 MPH increase during the next 72 hours.

National Hurricane Center

Frequency of Major Hurricanes

When/if the Potential Tropical Cyclone 9 reaches 39 MPH, NHC will dub it Helene.

We’ve already had one major hurricane in the Gulf this year – Beryl. The second major hurricane usually develops in the Atlantic Basin by September 19. So, even though this season has fewer than normal named storms, it will have an average number of major hurricanes for this part of the season if Helene becomes a Category 3 or higher.

Average hurricane season stats
From NHC’s Climatology Page

Current Status

At present, NHC says the area of concern in the northwestern Caribbean between Honduras and Cuba continues to produce disorganized showers and thunderstorms. Some mid-level rotation is evident in visible satellite images.

A  gradual turn toward the northwest is expected during the next day or so. Models agree that the center of the system should reach the northeast Gulf on Thursday.

Since the disturbance currently lacks a  well-defined center, future track adjustments may be required. Given the large size of the  tropical-storm-force wind field and fast forward speed that is forecast, storm surge, wind, and rainfall impacts will likely extend well away from the center, particularly to the east of the system.  

While the system is currently broad and not well organized, the  models suggest a more well-defined center should develop during the  next day or so.

Once the system becomes better organized and develops an inner core, the environmental and oceanic conditions appear favorable for significant strengthening. The sea surface temperature anomaly chart below shows that temperatures in the Caribbean and Gulf are up to 8 degrees Fahrenheit warmer than average for this time of year.


An Air Force Reserve reconnaissance aircraft will investigate the system this afternoon.

Tropical Storm Warnings and Hurricane Watches have already been issued for portions of western Cuba and the Yucatan  Peninsula of Mexico.

Key Messages

  • The disturbance will strengthen and be near hurricane strength when it reaches the far northwestern Caribbean Sea Tuesday night.
  • The system will intensify and could become a major hurricane when it reaches the northeastern Gulf Coast on Thursday.
  • There is an  increasing risk of life-threatening storm surge and damaging  hurricane-force winds along portions of the northern and  northeastern Gulf Coast, including the Florida Panhandle and  portions of the Florida west coast. But it is too soon to  specify the exact location and magnitude of impacts.
  • Potential Tropical Cyclone Nine will bring heavy rain to portions of the western Caribbean. That may lead to flooding and possible  mudslides in western Cuba.  
  • Potential Tropical Cyclone Nine will likely produce total rain accumulations of 4 to 8 inches over western Cuba and the Cayman Islands with isolated totals around 12 inches.
  • Heavy rainfall will spread into the Southeast U.S. starting on Wednesday and continuing through Friday, bringing a risk of flash and river flooding.  
For the latest rainfall forecasts associated with Potential Tropical Cyclone Nine, see the National Weather Service Storm Total Rainfall Graphics.

Posted by Bob Rehak on 9/23/24

2582 Days since Hurricane Harvey 

2024 Hurricane Season Update, PTC 5 Status and Learning Resources

8/12/24 – An August 8 update to NOAA’s 2024 Atlantic Hurricane Season Outlook still calls for an extremely active hurricane season with 17-24 named storms, including four so far with a fifth brewing in the Atlantic. The main difference between this and NOAA’s May predictions? A higher confidence level.

The main factors that affect the latest predictions for the 2024 hurricane season include:

  • Sea surface temperatures remain near record highs in the Atlantic main development region
  • Weaker-than-normal trade winds
  • Near record-low vertical wind sheer
  • Above-normal West African monsoon rains
  • No El Niño is expected to develop this year.
  • We are in the warm phase of the Atlantic Multi-decadal Oscillation (AMO)
  • Development to date, including Beryl and Debbie and an impending Ernesto, puts us ahead of the 30-year running average.

For more on the science behind the outlook, visit NOAA’s Climate Prediction Center.

#5 in the Hurricane Season About to Form

As of 2PM EDT, NHC indicated that sustained winds from Potential Tropical Cyclone (PTC) 5 averaged 35 MPH. That puts it just 4 MPH from becoming the fifth named storm of the year, Ernesto. Here’s what it looks like this afternoon.

PTC 5 as of 8/12/24 Noon CDT.

NHC gives PTC 5 a 100% chance of formation. It should intensify into a tropical storm later today and a hurricane by Thursday. However, it will curve northward into the open Atlantic and does not pose a threat to the Gulf Coast.

We normally don’t get a fifth named storm in the Atlantic until August 22. After that, we normally get a named storm every 7-10 days through October 11. This year, they will likely be more frequent.

Teach Your Family about Hurricanes

The National Hurricane Center website provides an almost bottomless well of free, educational resources. Today, I clicked on Outreach Resources and found presentations and publications geared to all age and professional levels.

Learning Opportunities for K-12 Students (Resources for Teachers) includes:

Hurricane Readiness for Coastal Communities

  1. Hurricane Basics (14 MB)
  2. NWS Products (15 MB)
  3. Forecast Uncertainty (23 MB)
  4. Making Better Decisions (10 MB)
  5. Student Guide (42 MB)

The guide (#5) contains a narrative embellishes the slides in the first four presentations.

Hurricane Readiness for Inland Communities

  1. Tropical Cyclone Basics (36 MB)
  2. National Weather Service Products (26 MB)
  3. Understanding Forecast Uncertainty (7.5 MB)
  4. Inland Hurricane Preparation in Practice (23 MB)
  5. Student Manual (30 MB)

Again, #5 contains additional explanation when slide graphics in presentations 1-4 may not be totally intuitive.

Information that Saves Lives

FEMA geared the presentations in the second two groups to adults, both in an out of government. The coastal presentations contain more emphasis on storm surge. The inland presentations emphasize riverine flooding from the heavy rains that often accompany hurricanes.

The information in both groups can benefit teachers, parents, first responders, emergency managers, and government leaders.

They explain various tools, terms and graphics used by NOAA, NHC, NWS, and NHP to help everyone make informed decisions when planning for and responding to hurricane threats.

For instance, I found the discussion on inundation mapping that involved forecasts and “nowcasts” very illuminating. Ditto for the discussion about how NHC determines the timing and probabilities in its graphics. How much water it takes to make cars float and lose traction. How emergency planners work together. And more. Much more.

Posted by Bob Rehak on 8/12/24

2540 Days since Hurricane Harvey

Study on Flood Inundation Mapping Seeks Focus Group Participants

The Nurture Nature Center, a nonprofit organization in Easton, Pennsylvania, is conducting focus group studies nationwide on National Weather Service hydrologic forecast products for NOAA. Next month, they will conduct a group in the Houston area.

US59 at West Fork during Harvey
Looking S across San Jacinto West Fork toward Humble from over US59 bridge during Harvey.

Purpose of Study

The research team is currently studying new Flood Inundation Mapping Products. The goal: make sure people get the information they need to prepare for possible flooding.

The study will explore the kinds of decisions users will make with new maps. The researchers will use feedback they get to provide recommendations to NWS based on focus group testing about how to:

  • Integrate key information
  • Eliminate confusion
  • Provide clarity.

This is part of a series of focus groups being conducted nationwide. Researchers will conduct this particular group in conjunction with the Houston/Galveston Weather Forecast Office. It will focus on the San Jacinto River Basin.

Focus Group Details

Researchers will hold the San Jacinto focus group:

  • On Tuesday, July 23rd from 6-8 PM
  • At the Jacinto City Branch Library Meeting Room
    921 Akron St
    Houston, TX 77029
  • Refreshments and light snacks provided

Participants will each receive $50.

To qualify, participants must live and/or work in the Houston, TX – San Jacinto River Basin area and be at least 18 years of age.

To Register…

Registration is required and limited to 15 participants.

Please circulate this post to anyone vulnerable to flooding, interested in sharing their experiences, and willing to help improve flood forecast products.

Posted by Bob Rehak on 6/23/24

2490 Days since Hurricane Harvey

Heavy Rainfall, Hail, High Winds, Tornados, Street Flooding Possible Today

The National Weather Service (NWS) Storm Prediction Center and Harris County have issued outlooks for today that include risks of heavy rainfall, hail, high winds, tornadoes and street flooding.

NWS predicts an “enhanced risk” of severe weather (3 on a scale of 5) with a 10%-14% chance of tornados. NWS rates the excessive, heavy rainfall risk as slight (at least 15%).

Light rainfall has already begun in the Lake Houston area and will increase throughout the morning hours as storms approach and pass through. The threat should be past us by 3-4 PM, just in time for school pickup.

NWS severe weather outlook as of 12:01 a.m. CST.
NWS tornado outlook as of 12:01 a.m. CST.
NWS excessive rainfall outlook as of 1:55 a.m. Houston time.

Rainfall Accumulation

Jeff Lindner, Harris County’s meteorologist, warns, “Forecasters have tended to increase rainfall amounts over the last 24 hours with the potential for storm clustering and cell training in southwest to northeast bands.”

Lindner says rainfall amounts of 1-3 inches appear to be common today with higher isolated totals of 4-5 inches especially for areas south of I-10, where activity may linger into the evening hours.

Moisture levels will be high for late November. Plus onshore winds will feed more moisture into the area. Widespread showers and thunderstorms are likely.

Some models show banding and training of storms this afternoon into the evening hours. But that’s for areas mainly south of I-10 and around Galveston Bay (SE Harris, Liberty, Chambers, Galveston, Brazoria Counties).

Potential for 1-2 Inches Per Hour, Street Flooding

Soils are generally dry over the area, but hourly rainfall rates of 1-2 inches per hour may result in some street flooding at the usual flood-prone locations.

The front will sag off the coast tonight into early Friday, but you can expect additional disturbances across the region on Friday with showers and thunderstorms expanding inland toward the I-10 corridor.  

Wind and Hail

While much focus has been on the tornado threat, we also have the potential for damaging wind and large hail. Stronger showers may produce 40-50mph winds today. Additionally, gradient winds of 25-30mph with a few higher gusts will be common over the area for much of the day with the coastal locations seeing the stronger winds.

Posted by Bob Rehak on 11/30/23 at 7:40 a.m. based on information from NWS and Jeff Lindner

2284 Days since Hurricane Harvey

Tropical Forecast Suddenly More Active

Still three weeks from the peak of hurricane season (September 10), the tropical forecast has suddenly become more active. The latest seven-day outlook from the National Hurricane Center (NHC) shows four areas of concern. Two will not affect the Texas Gulf Coast. Eventually, the other two could get close.

Chances of Tropical Formation

According to the NHC 8 a.m. update:

  • The red area at the right currently has a 70% chance of tropical formation in the next seven days.
  • The orange area has a 40% chance. Environmental conditions are only marginally conducive for further development of this system, but a tropical depression could still form during the next couple of days while it moves west-northwestward at 10 to 15 mph across the central tropical Atlantic.
  • Neither of those systems poses a threat to Texas.
  • The yellow area in the middle approaching the Lesser Antilles has a 30% chance of formation.
  • The yellow area on the left will move toward the Gulf of Mexico by early next week. It also has a 30% chance of tropical formation.

The NHC updates its website several times a day during hurricane season. So bookmark it and check back often for the latest forecasts.

Local Impact Felt by Next Tuesday

Jeff Lindner, Harris County’s meteorologist, has been sending out updates all week long on the last system. Here’s what he had to say on Friday morning, 8/18/23. “A low chance of tropical cyclone formation remains possible over the western Gulf early to mid next week.”

“A tropical wave will reach the eastern Gulf of Mexico late this weekend. As high pressure over Texas lifts northward and centers over the Midwest early next week, this wave will continue westward and approach the Texas coast by Tuesday or Wednesday,” said Lindner.

Possibilities include a tropical wave, tropical depression, or weak tropical storm moving inland along the lower or middle Texas coast. Conditions appear to be generally favorable for some slow development, but dry air is lurking along the U.S. Gulf coast that could wrap into any developing system. Also any developing system could encounter wind shear over the western Gulf from the outflow of powerful Hurricane Hilary in the eastern Pacific Ocean.

Any Development Most Likely Near Coast

“With that said, the system will be moving over warm sea surface temperatures and systems, especially in the NW Gulf under the right conditions can tighten up just prior to landfall. This may be a situation where whatever is going to happen with any development occurs very near the coast,” said Lindner. 

Most Moisture Near Coast and West of Houston

Lindner concludes, “Regardless of development, tropical moisture will surge into the Texas coast as early as late Monday, but more likely Tuesday or Wednesday. For now, the greatest moisture looks to remain along and south of the I-10 corridor with areas north of I-10 still under the influence of the high pressure ridge over the Midwest. There will likely be a strong gradient in rain chances from south to north over the area next week with the potential for some desperately needed rainfall across the coastal locations.”

Subsiding air from the high to the north will determine how far inland the moisture and rain/bands reach. This map from the National Weather Service (NWS) helps visualize what the situation will look like by Monday, August 21.

Flood Risk Less than 5%

The risk of excessive rainfall that could cause flash flooding is less than 5% according to the NWS.

It’s pretty sad when you start wishing for a tropical storm. But we sure could use something to break the drought and cool us off. Yesterday’s high of 105 was the highest temp recorded in Houston since 1909, according to ABC13. And it could get close to that again today.

Posted by Bob Rehak on 8/18/23

2180 Days since Hurricane Harvey