5/17/2024 – The Hallett sand mine on the San Jacinto West Fork appears to have dug a trench across the maintenance road of its settling pond to lower the pond’s level. Murky wastewater is draining into the West Fork while the SJRA is currently releasing 10,875 cubic feet per second (CFS) from Lake Conroe in the wake of yesterday’s heavy rains.
Sediment released from the mine is being picked up by the Lake Conroe water and carried downstream. Note below how sediment has discolored the West Fork.
Picture taken 5/17/24, at the confluence of the West Fork, Spring Creek and Cypress Creek. Cypress joins Spring slightly upstream on the left.The branch on the right is immediately downstream from 20 square miles of sand mines between US59 and I-45.
Where The Sludge is Coming From
In the last few weeks I’ve posted extensively about how the West Fork has breached the dikes of a pit formerly owned by Hallett. As of this afternoon, the river continues to run through that pit. No attempt has been made by the new owner to re-establish the dikes. And that certainly contributes to downstream sedimentation.
But this afternoon, I discovered an additional source of sedimentation thanks to a tip from a nearby fishermen who stumbled across a breach in Hallett’s settling pond. See video below.
Video supplied by fishermen.
It’s hard to get a sense of the location from the close up, so here’s the location of the breach in a satellite image from Google Earth.
General location of breach and path to river in red oval.
And here’s a more detailed look at the path the water took on its way to the river.
Looking N. Silty water leaves Hallett’s settling pond through a trench dug in the tree-line. From there it flows through an abandoned sand mine and then through another breach into the West Fork.Reverse angle shows silty water flowing out of Hallett settling pondinto abandoned neighboring mine.Detail cropped from shot above shows how heavy equipment worked the area.Looking S downstream. Abandoned mine on left, West Fork in middle and breach through another pit on right.
Timing of Release Should Raise Eyebrows
The timing of this release is suspect: Friday afternoon just before regulators headed home for the weekend.
I’ve documented a history of breaches from this pond dating back to 2019 and the fishermen say they’ve seen breaches before that.
Hallett flushed water from this and other ponds after the January floods in 2024 but via different routes.
Lest you think I’m picking on Hallett, it isn’t the only sand mine emptying its settling pond into the West Fork.
I also documented an instance when the West Fork ran white from a release at the LMI Moorhead Mine upstream from Hallett. TCEQ estimated they released 56 million gallons of sludge into the river. That pond dropped 3-4 feet according to the TCEQ.
Regular Occurrence
The montage below shows the confluence of the West Fork and Spring/Cypress Creeks from different angles on different days. In all cases, the polluted branch was the West Fork. I took these shots while photographing West Fork sand mines from a rented helicopter.
A former West Fork mine operator and a former water quality manager for the City of Houston tell me that releasing sediment-laden water under the cover of floods is standard operating procedure for many mines on the West Fork.
Who Will Bear the Cost of Clean Up, Dredging?
Think this doesn’t affect you? It affects your water quality and the cost of cleaning it up. Lake Houston supplies drinking water for more than two million people.
And if you live between the mines and Lake Houston, it probably will affect you another way.
Most sediment moves during floods. During Harvey, the West Fork swept through 20 square miles of sand mines between I-45 and I-69. According to the Army Corps, deposited sediment blocked the West Fork by 90%. That reduced the conveyance of the river and caused water to rise into homes and businesses. Almost 20,000 flooded in the Humble/Kingwood area.
Since then, taxpayers have spent more than $200 million on dredging. And the City is getting ready to launch another $34 million dredging program.
However, that program won’t address the mouth of the Kingwood Diversion Ditch at the River Grove Park boat launch.
KSA has obtained bids north of $800,000 to dredge the blocked area. Spending that kind of money will be necessary to keep the KSA boat launch open. It has become badly blocked by sediment during two floods since the start of the year.
Here’s what that area looked like yesterday afternoon when the SJRA release rate was closer to 1500 CFS.Water level in river was still up about a footabove normal.
Living with sediment is all part of life on the river. But dredging intervals at River Grove have gone from 8 years before Harvey to 4 to 2 years since Harvey.
If this continues, KSA may be forced debate whether it can afford to keep the boat docks open.
Harris County Precinct 3 Commissioner Tom Ramsey, PE is trying to work with upstream authorities to reduce sedimentation that can lead to flooding. But it’s an uphill slog. No pun intended.
Posted by Bob Rehak on 5/17/2024
2053 Days since Hurricane Harvey
The thoughts expressed in this post represent opinions on matters of public concern and safety. They are protected by the First Amendment of the US Constitution and the Anti-SLAPP Statute of the Great State of Texas.
The U.S. Department of Housing and Urban Development (HUD) has clouded the future of dozens of Texas flood-mitigation projects worth billions of dollars.
HUD has alleged racial discrimination by the Texas General Land Office (GLO), which distributes HUD money in Texas. HUD based its finding of discrimination on complaints by two advocacy groups. The complaints stem from a statewide competition – the firstof several rounds of HUD awards relating to Hurricane Harvey.
Now, deadlines for actually spending the money are fast approaching. But the uncertainty created by the racial discrimination allegations is causing entities that won HUD grants to question whether HUD will revoke funding and leave half-completed projects in limbo.
The GLO vehemently denies all allegations of discrimination and points out that:
HUD imposed the key rule governing competition for grants now in dispute
HUD approved the competition’s scoring criteria
More than two thirds of the beneficiaries of the funds are Black and Hispanic
100% of the mitigation projects benefitted communities with a majority of low-to-moderate income (LMI) residents, when only 50% was required
GLO and HUD ultimately awarded Houston-area entities about $1.5 billion.
Allegations by Texas Housers and Northeast Action Collective
According to the Houston Chronicle, two advocacy groups (Texas Housers and the Northeast Action Collective) filed charges of racial discrimination after the first round of Harvey grant awards in 2021. They allege that the Houston area got zero dollars and are standing by their accusations, despite all the money the area received at the time and since then. (See amounts in timeline below.)
When developing the competition for Harvey grants, HUD insisted that the GLO could not base awards on actual flood damage. Regardless, Texas Housers and the Northeast Action Collective complained that rural areas received the majority of funding even though Houston and Harris County had the majority of flood damage.
After results of the competition became apparent, GLO attempted to remedy the rural/urban disparity by recommending to HUD that $750 million in remaining Harvey competition funds should go to Harris County – without a second competition. HUD approved.
GLO also recommended increasing the amount going to the Houston-Galveston Area Council (H-GAC) from the Regional Mitigation Program. H-GAC’s allocation more than doubled from $209 million to $488 million – again without a second competition. And again, HUD approved.
Regardless, HUD’s “finding” of discrimination based on allegations by the two advocacy groups still stands. Moreover, HUD issued administrative subpoenas to depose GLO executives, even though the Department of Justice (DOJ) already reviewed the racial discrimination complaints and declined to pursue them.
This mess is like throwing trip wires in front of exhausted marathon contestants.
While GLO defended its actions with more than 1,000 pages of documentation, HUD has reportedly produced only a four-page letter laying out vague generalizations.
HUD has not responded to requests from the GLO or ReduceFlooding.com for specifics regarding the allegations.
Uncertainty, Fear of Clawbacks Slow Progress
After spending years and millions of dollars to win HUD grants, the award winners now face the specter of not having enough money to finish their projects should Texas Housers and the Northeast Action Collective succeed.
Imagine your bank rescinding a mortgage commitment after you bought a lot and began building a new home.
Worse, HUD could try to claw back the money that grantees have already spent. According to GLO, many of the smaller communities awarded grants don’t have the funds to pay back HUD should that happen.
Faced with that kind of uncertainty, some awardees are reluctant to start construction on their projects – even though they face two looming “use it or lose it” deadlines. The first is only three years away – barely enough time to complete many projects.
As a result, the GLO issued a scathing press release last week, accusing HUD of “destabilizing vital funding.”
Timeline: Who Got What, When?
Is all that chaos necessary? Not if you look at the final score as opposed to the first inning. Houston and Harris County received far more than “zero dollars.” See below.
On February 9, 2018, Congress approves mitigation funds for 2015 and 2016 floods as well as Harvey-eligible areas. Two months later, HUD allocated money to Texas.
2019: Federal Register Notice
On August 30, 2019, HUD finally published the Federal Register notice enabling the State of Texas to proceed in drafting an action plan for the CDBG-MIT funds. GLO then conducted a public outreach campaign and collected thousands of comments from 117 meetings and 936 individuals.
2020: HUD Approves Action Plan
HUD finally approved the GLO action plan which called for conducting a statewide competition for funding. The scoring criterion included in the state action plan for distribution of the funds was approved by HUD on March 27, 2020.
$502.5 million for 2018 Flood Control Bond Projects
$100 million for Partnership Projects, i.e., with City of Houston
$50 million for Other County Flood Mitigation Projects.
June 6, 2023: Third Award
GLO recently reallocated $322.5 million in unspent disaster relief funds from Harvey to Harris County Flood Control for mitigation projects. This is in addition to $222,519,672 Harris County received in infrastructure funding from the initial CDBG-DR allocation.
Still, the Chronicle article alleges that the GLO somehow ran afoul of of the Civil Rights Act and Fair Housing laws by giving the Houston area “zero.”
The DOJ took less than 48 hours to review and dismiss the claim. But the continued legal harassment by HUD is distracting the GLO from its vital mission as deadlines loom.
Could this be politically inspired? Two Houston-based politicians running for election next year have close ties to the groups making the claims. More on that in a future post.
Baseless Racial Discrimination Accusations Have Backfired
Despite the vast majority of Harris County flood-control spending since 2000 already going to LMI areas, the baseless charges of racial discrimination seem to have backfired on Texas Housers and Northeast Action Collective.
In one notable instance, the Northeast Action Collective brought more than a hundred members to a Commissioners Court meeting. They pushed the meeting into the wee hours of the next day, repeatedly demanding the resignations of key Harris County Flood Control executives. Since their resignations in 2021 and January 2022, flood control spending has steadily declined – exposing the constituents that the groups represent to more flood risk.
Data obtained from HCFCD via FOIA request. Covers 1/1/2000 through 3/31/2023.
And the effects are across Harris County. For instance, in the first quarter of this year compared to the fourth quarter of last year, spending was down in two thirds of the county’s 23 watersheds.
Data obtained from HCFCD via FOIA Request.Only significant increase was in Greens Bayou watershed.
The HUD/Houser/Collective accusations could produce a similar outcome across Texas – backfiring again.
HUD refuses to discuss its allegations of racial discrimination. HUD did not respond to a ReduceFlooding request for an interview, nor would it meet with GLO Commissioner Dawn Buckingham MD.
Posted by Bob Rehak on 7/8/23
2139 Days since Hurricane Harvey
The thoughts expressed in this post represent opinions on matters of public concern and safety. They are protected by the First Amendment of the US Constitution and the Anti-SLAPP Statute of the Great State of Texas.
https://i0.wp.com/reduceflooding.com/wp-content/uploads/2023/07/20211217-DJI_0079.jpg?fit=1100%2C733&ssl=17331100adminadmin2023-07-08 20:10:092023-07-09 19:09:54HUD Clouds Future of Flood-Mitigation Funding in Texas
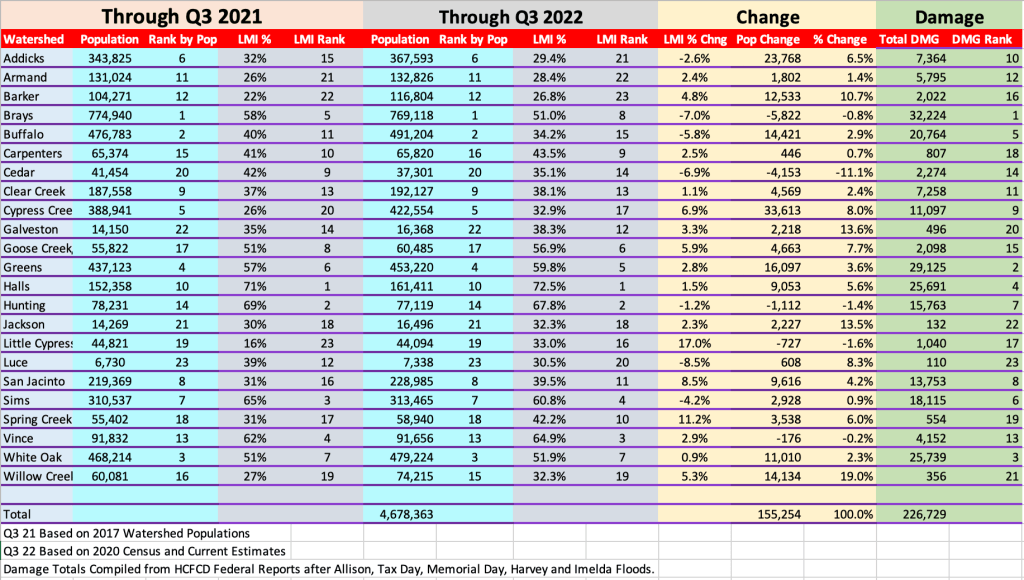
Like damage, population is one of the “weighting factors” considered in the distribution of flood-mitigation dollars. Compared to 2017 estimates of watershed populations in Harris County, 2022 estimates show that five watersheds have lost population. But overall, the county has gained 155,254 people.
The map below shows the location of each of these watersheds.
Harris County Watersheds by Harris County Flood Control District
Reasons for Shifts Unclear
I had wondered whether the five major floods in Harris County between 2000 and 2020 (Allison, Tax Day, Memorial Day, Harvey and Imelda) would cause the most heavily flood-damaged areas to lose population. But that seems not to be the case.
The most heavily damaged watershed (Brays) lost the most population (in raw numbers). But the second most heavily damaged watershed (Greens) gained more than 16,000 people, the second largest gain.
I found no meaningful correlation between flood damage and population loss or growth. Nor do data suggest that flood-mitigationspending has much influence either. Contradictory examples abound. And statistical correlations rate as negligible to weak.
Five Watersheds Lost Population
Compared to the previous Census estimates from 2017:
Brays lost 5,822 people (0.8%)
Cedar lost 4,153 people (11.1%)
Hunting lost 1,112 people (1.4%)
Little Cypress lost 727 people (1.6%)
Vince lost 176 people (0.2%).
In percentages, Cedar Bayou lost the most population. Cedar was the sight of the Arkema disaster which blocked evacuation routes along Highway 90 during Harvey. The watershed currently has only about 37,000 people, ranking it 20th among the 23 watersheds in Harris County.
In five major storms between 2000 and today (Allison, Tax Day, Memorial Day, Harvey and Imelda), flood damage varied widely within those five watersheds:
Brays flooded 32,240 structures, the most of any watershed.
Cedar flooded 2,274.
Hunting flooded 15,763.
Little Cypress flooded 1,040.
Vince flooded 4,152.
18 Watersheds Gained Population
Eighteen other watersheds gained population and also had widely varying degrees of flood damage. These, too, showed little correlation.
Altogether, the county’s watersheds gained 155,254 people, despite 226,729 damaged structures during the five major storms.
Negligible Correlation of Flooding and Population Gain/Loss
The “population flees flooding” hypothesis didn’t hold much water.
Flood damage and “number of residents lost” correlated at only a 0.16 level – insignificant. Flood damage and “percent of residents lost” correlated at only 0.28, extremely weak.
A perfect correlation is 1.0. It indicates that for every unit of change in one variable, there is a corresponding unit of change in another variable. However, that was far from the case here. Variations seemed random.
The County has a strong draw: jobs. Also, family, friends, neighbors and support networks remain powerful attractions that keep most people anchored.
The new HCFCD data do not suggest why gains and losses occurred.
Top reasons for relocation typically include: greater safety, better schools, better housing, new jobs, and upgrading from apartments to homes.
LMI Population Trends
HCFCD also measures “LMI population.” LMI stands for Low-to-Moderate Income. The Census Bureau defines LMI as “families making less than the average for the region.”
Harris County has 42.6 % LMI residents. So 57.4% of residents make above the average for the region.
This is important because the LMI percentage plays a huge role in partnership grants from the US Department of Housing and Urban Development (HUD). Most, but not all, HUD grants go to areas with LMI populations higher than 70%. A notable exception is the pending $750 million HUD Harvey flood-mitigation grant. It only requires that 50% of the money benefits LMI households.
The latest HCFCD data shows that watersheds at bothends of the income spectrum lost LMI population. We still have the same eight LMI-majority watersheds we had in 2017. However, one deserves special mention.
Brays’ LMI population declined so significantly that it almost flipped from the “majority LMI” category to “majority upper income.” It went from 58% to 51% LMI.
Sixteen other watersheds gained LMI population. Some had huge flood losses; others had few.
The correlation between total flood damage and LMI Population Gain/Loss is .34, slightly higher than for the entire population but still considered “weak.”
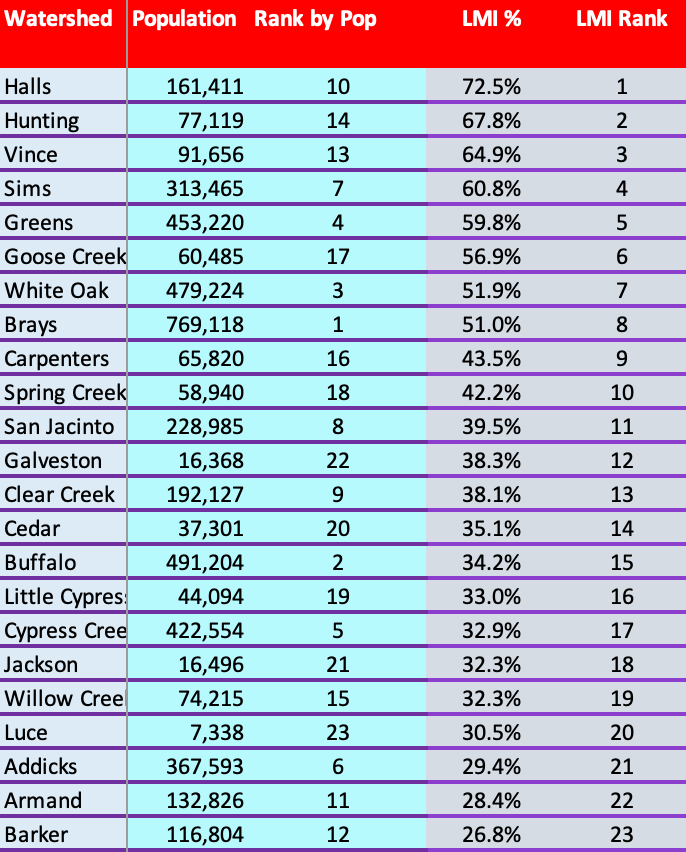
Here are Harris County’s watersheds ranked in order of LMI population percentage.
As of 11/21/2022
My next post will discuss how the distribution of flood-mitigation funds relates to population changes and other factors. I will also discuss what the prospects for flood mitigation in the Lake Houston Area are during Lina Hidalgo’s second administration. Don’t miss it.
Posted by Bob Rehak on 11/21/22, based on data provided by HCFCD in response to a FOIA Request
1910 Days since Hurricane Harvey
The thoughts expressed in this post represent opinions on matters of public concern and safety. They are protected by the First Amendment of the US Constitution and the Anti-SLAPP Statute of the Great State of Texas.
https://i0.wp.com/reduceflooding.com/wp-content/uploads/2018/10/HarrisCountyWatersheds.jpg?fit=1500%2C972&ssl=19721500adminadmin2022-11-21 11:40:152022-11-21 12:46:59Five Watersheds Lose Population While Harris County Gains Slightly
The Houston Chronicle has endorsed Republican Alexandra del Moral Mealer for County Judge over incumbent Democrat Lina Hidalgo. I won’t recap the lengthy Chronicle article here; you should read it firsthand. But I will expand on it, especially vis-a-vis flood control, which the Chronicle touched only lightly.
Let me start by saying that after watching four year’s of Hidalgo’s missteps in flood mitigation, I support Mealer, too. It comes down to concerns about Hidalgo and the promise I see in Mealer. Let’s discuss Hidalgo first.
Hidalgo Slights Area With Worst Flooding
The person in the driver’s seat has a huge influence on where flood-mitigation money goes. And more than half of all flood-bond money spent to date has gone to Brays, Greens, White Oak, Halls, and Hunting Bayous. Those five have received more than $550 million from the flood bond through May. That’s more than half of all bond money. See below.
Flood Bond Spending through May 2022. Data obtained from HCFCD via a FOIA Request.
Here’s how that looks in a graph. Keep in mind that the San Jacinto watershed is the largest in the county.
The San Jacinto also had the highest flooding in the county during Harvey – more than 20 feet above flood stage.
Chart showing feet above flood stage at 33 gages on misc. bayous in Harris County during Harvey, including the 5 LMI watersheds listed above.
And as a result, the San Jacinto was among the most heavily damaged.
So, you would think this would get Judge Hidalgo’s attention. Instead, she brags about her equity prioritization framework. She claims it gives preference to the “worst first.” The only thing is, she doesn’t define “worst” the way most people would. She ignores severity of flooding and damaged structures.
Hidalgo’s Definition of Worst
Hidalgo’s formula measures Low-to-Moderate Income (LMI) residents, the CDC’s Social Vulnerability Index, and population in an area. But many of those densely populated neighborhoods are crowded with apartments. So …
People who live above ground level and don’t flood get prioritized over people who live at ground level and do flood.
But Hidalgo can’t even tell how many residents in a watershed live with different degrees of flood risk. So, Hidalgo’s “worst first” mantra is clever but misleading. It intends to deceive.
While rewarding her core constituents with mitigation projects worth hundreds of millions of dollars, the entire Lake Houston Area has only $2,000 of capital-improvement flood-bond construction projects underway.
Flood-control spending is just one of the county’s “disaster areas.” Consider the County’s IT department, Universal Services, which is in meltdown. The reason you see five-month-old data above is that the county has gone through a disastrous change in its IT systems.
The department has been dogged by incompetence since Hidalgo appointed Rick Noriega to take over. He has no IT background and has pushed out people who do. The managers of every group beneath him have turned over.
Employees complain Universal Services now hires new people for their political affiliation, not professional qualifications.
The incompetence is widespread, according to multiple sources. Things have gotten so bad that many qualified staff are burning out from having to shoulder more and more of the workload. And they are quitting.
As a result, accurate, timely information is rare. And yet, Hidalgo keeps bragging about “transparency.”
Lacking Leadership, Direction on $750 Million Flood-Mitigation Allocation
Universal Services is not alone. See the org chart below.
Changes under Hidalgo. Red X’s represent changes in leadership. Green boxes represent new departments.
So whom did she choose to develop a plan for spending $750 million in Harvey flood-mitigation funds? Community Services, not Flood Control!
Community Services may be knowledgeable about disaster relief. That’s about helping individuals recover from past floods. But flood mitigation is about lessening the severity of future floods. One requires social workers; the other requires engineers, like they have in Harris County Flood Control.
The Texas General Land Office (GLO) administers those flood-mitigation funds for the US Department of Housing and Urban Development (HUD).
The GLO signaled its intention to allocate $750 million to Harris County on August 23, 2021, but Community Services hasn’t even started compiling a list of potential projects yet.
They are still waiting on “direction from leadership,” according to an internal memo obtained by ReduceFlooding. In 14 months, Community Services has only defined a “process” for determining the list.
Community Services has, however, determined that it wants to spend almost a hundred million of the $750 million on planning and administrative costs.
Meanwhile, H-GAC which covers a much larger area and includes many more governmental entities received notification of a $488 million allocation – also on 8/23/21. Yet H-GAC has already submitted its project list, received approval, and is working with sub-recipients to secure and validate bids.
Also, their “Fix Flooding First” program lost its leader and has reported no progress in months. Fix Flooding First was especially important to people on the periphery of the county. Its objective was to get neighboring areas that drain into Harris County to adopt minimum drainage standards.
In my opinion, Hidalgo’s biggest problem is that she’s just a bad manager. She:
Doesn’t attract and retain top talent
Pushes out those who disagree
Hires people based on political affiliation, not qualifications
Doesn’t value experience and institutional knowledge
Blatantly discriminates against Republican-leaning precincts.
Hidalgo repeatedly says that she’s proud of what most would consider screw-ups.
Hidalgo never “owns” her problems. She just waves them away. In my opinion, another four years of Hidalgo would leave the county in disastrous and unrecoverable shape.
County spending is up. Crime is up. Taxes are up. And virtually all the flood-mitigation money promised to the Lake Houston Area has so far gone elsewhere.
About Alexandra del Moral Mealer
Mealer comes to the job with much more life and leadership experience than Hidalgo did. She has a way of confronting the truth head on.
You would expect that from a West-Point-educated Army Captain who commanded a bomb squad in Afghanistan. Mealer understands:
The necessity of accurate intel
That peoples’ lives and livelihoods depend on the decisions she makes.
Alex Mealer spent days touring the Lake Houston area to understand local flooding issues first hand. Hidalgo has not.
Mealer also has MBA and JD degrees from Harvard. She was a VP at Wells Fargo where she helped put together billion-dollar oil-and-gas deals before deciding to run for County Judge. In flooding as with law enforcement…
Mealer’s focus is making sure the county spends money wisely.
Straight Talk Vs. the Flood-Control Fairy Tale
Before this campaign, Mealer acquired a wealth of knowledge about how the county works. And she has surrounded herself with experts on various subjects.
The Chronicle described her as a data wonk. In my opinion, that’s what the county needs: someone grounded in reality. In one commissioner’s court meeting after another, Hidalgo, Garcia and Ellis, have spun a flood-control fairly tale.
It goes something like this. “Flood control has ignored poor neighborhoods. Rich ones like Kingwood get all the flood-mitigation money.” Why? They point to institutional racism!
If we had a judge who knew where her money was actually going, she could have challenged this myth. The reality is that LMI neighborhoods have consistently received the lion’s share of flood-mitigation funding going back decades.
I have discussed flooding issues with Mealer a dozen times since the primary last spring. In my opinion, she is laser focused on accurately diagnosing problems. National and state issues over which she has no control do not distract Mealer.
Mealer is determined to provide a safe and secure community with well-maintained public infrastructure that support growth and opportunity for all.
Accurately diagnosing problems is the key to fixing them quickly and cost effectively.
I, for one, don’t plan to support Hidalgo. She continually says she needs more money when she doesn’t know where billions of flood-mitigation dollars have gone. Nor does she seem eager to deploy another $750 million already in her hip pocket. I’m voting for Mealer.
Posted by Bob Rehak on 10/16/22
1874 Days since Hurricane Harvey
The thoughts expressed in this post represent opinions on matters of public concern and safety. They are protected by the First Amendment of the US Constitution and the Anti-SLAPP Statute of the Great State of Texas.
https://i0.wp.com/reduceflooding.com/wp-content/uploads/2022/10/20220314-RJR_9297.jpg?fit=1200%2C800&ssl=18001200adminadmin2022-10-16 19:08:532022-10-18 22:33:46Chronicle, ReduceFlooding endorse Mealer over Hidalgo
The Harris County Flood Control District (HCFCD) August update to County Commissioners on the progress of the 2018 flood bond shows a continued lopsided distribution of funds in favor of low-to-moderate income (LMI) watersheds. It also showed slowing activity overall.
Separately, the County has posted a new website and scheduled input sessions for Adrian Garcia’s proposed new $1.2 billion bond proposition(s). The dates of input sessions relative to the legislative deadline for bond language make it clear that the bond language will not reflect much voter input.
Lopsided Distribution of Funds Continues for Flood Bond
Five watersheds with a majority of LMI residents have received 39% of all the flood bond spending. LMI is defined as “below median income for the region.” Brays, Greens, White Oak, Halls and Hunting watersheds received a total of $430.4 million – an average of $86 million each. Together, the other 18 watersheds received $443.5 million – an average of $24.6 million each. Countywide projects received the rest – $217 million.
Awarded only one new construction contract valued at $1 million.
Awarded three new agreements with other contractors but spent $0 with them.
Completed 19 buyouts compared to 21 the previous month.
Spent $2.4 million on buyouts compared to $6.6 million the previous month.
The total value of active capital improvement construction projects fell to $225.8 million from $231.9 million in July and $235.6 million in June. Out of that, the Lake Houston Area still only has $2,000 or 0.0009% of the total. Although that should improve in the future, it could also worsen, depending on election outcomes in November.
Total reported bond spending increased to $1.1 billion, up from $1.06 billion the previous month, an increase (with rounding) of slightly more than $40 million.
Overall progress of the bond program? 23.5% complete – four years into a 10-year program.
However, HCFCD believes it is only slightly behind schedule. The District’s key performance indicators stayed steady at .97 percent.
Major-Maintenance Flood-Bond Spending Holds Steady, but Still Lopsided
Major maintenance projects held fairly steady. HCFCD spent $78.4 million in August compared to $78.8 million in July. But there’s only one maintenance project in the entire northeastern section of the county – some drainage system repairs in the Jackson Bayou watershed with an unspecified value. It’s unspecified because the report lumps it together with two projects in the Halls Bayou watershed. The total for all three is about $1 million. Assuming each project got one third of that million, the entire northeastern section of the county received 0.42% of all the maintenance spending from the bond last month.
The largest group of maintenance projects is along Cypress Creek and its tributaries. There are 14 projects valued at $48.1 million. That’s 61.4% of the major-maintenance total.
That’s right. Garcia wants to spend twice as much on hike-and-bike trails as public safety.
The county will hold four open houses in each of the four precincts during the next five weeks. It will also hold four virtual open houses. For a complete schedule, see HarrisCounty2022Bond.org.
The one input session in the northeastern section of Precinct 3 will be at the Humble Civic Center at 6PM on October 4th. Neither Kingwood, Huffman, Atascocita, nor Crosby will have its own input session.
Bond Language Will Not Reflect Voter Input
The county must post bond language by September 30 at the latest. But the input sessions run until October 20th. Early voting starts on October 24. And Election Day is November 8. So the bond language will not reflect much voter input. Neither the county, nor media, will have much time to digest voter input. It’s pure political theater.
The bond website simply says that “Input will be shared with Harris County Precinct staff as they make decisions regarding future projects.”
The bond website provides absolutely no detail about SPECIFIC PROJECTS or WHERE projects would be – despitepromises made by the County Administrator to Commissioners Court.
Equity and Political Leaning Will Guide Distribution of Garcia-Bond Funds
Commissioners Ramsey and Cagle argued for months to delay the bond referendum until details could be nailed down, but Hidalgo, Garcia and Ellis refused.
During debate in Commissioners Court, it became clear that Hidalgo, Garcia and Ellis intend to use “equity principles” to divvy up the money, not just to prioritize the start date of projects as they did with the 2018 flood bond. Hidalgo, Garcia and Ellis even passed a motion that would give Democratic-leaning Precincts about 40% more money than Republican-leaning Precincts. For instance, Precinct 3 would be guaranteed only $220 million. That’s 18% of the total even though P3 has 47% of the county’s unincorporated area to maintain, improve and patrol.
Why Trust in Government is Eroding
During debate, Rodney Ellis even bragged about how he redefined “equitable distribution of funds” in the 2018 Flood Bond text after the election.
My takeaway: Hidalgo, Garcia and Ellis don’t want to be held accountable. They talk transparency, but this is nothing more than a slush fund. And this is why trust in government is eroding in my humble opinion.
Posted by Bob Rehak on 9/20/22
1848 Days since Hurricane Harvey
The thoughts expressed in this post represent opinions on matters of public concern and safety. They are protected by the First Amendment of the US Constitution and the Anti-SLAPP Statute of the Great State of Texas.
https://i0.wp.com/reduceflooding.com/wp-content/uploads/2022/09/20220920-Screen-Shot-2022-09-20-at-2.22.40-PM.jpg?fit=1200%2C923&ssl=19231200adminadmin2022-09-20 20:03:512022-10-01 12:54:45Flood- and Garcia-Bond Updates
New data obtained from Harris County Flood Control District via a FOIA Request breaks down flood-mitigation funding by watershed through the end of 2021. It shows where your flood-bond money is going. It also debunks some popular myths. Those include the oft repeated:
Rich watersheds get all the funding; poor watersheds get none.
Partner funding favors rich watersheds because home values are higher.
HCFCD has historically discriminated against low-to-moderate income (LMI) watersheds.
Eight out of 23 watersheds in Harris County have a majority of residents that fall into the LMI category. That means a majority make less than the average annual income for the region. As the data below shows, those eight LMI watersheds get the vast majority of county, partner, and total funding. In fact, four have received 54% of total flood-mitigation funding since 2000.
Funding now correlates more highly with LMI population than damage!
Before I dive into the data, though, let me point out that between the 3Q21 and the end of last year, the county changed the way it compiles historical data. Instead of using the start/stop dates in project management software and reporting only completed projects, the county is now using invoice dates. This produces much higher accuracy. Dollars do not spill over from one period into another. The new data also reflects spending on projects that are ongoing, but still open.
In response to my FOIA Request, the county provided spending using both the old and new methods. They differ by roughly $615 million. Of that, approximately $215 million reflects actual fourth-quarter spending and $400 million reflects the change in when expenses are recognized.
Spending by Watershed
The rank order of spending by watershed has not changed much since last year. Several watersheds moved up or down by a place or two.
The top four are still the top four in the same order. But some of the amounts changed radically, mostly due to the change accounting. For instance, White Oak increased from $387 million to $521 million. But out of the $134 million difference, $102 million comes from when expenses are recognized.
Because this gets so confusing, and because the rank order did not change much, I will use only the new totals compiled by invoice date from now on. I will not compare old and new totals based on the different accounting methods.
Spending by watershed between 1/1/2000 and 12/31/2121 broken down by county and partner contributions, and LMI/Other watersheds.
Graphs of Spending
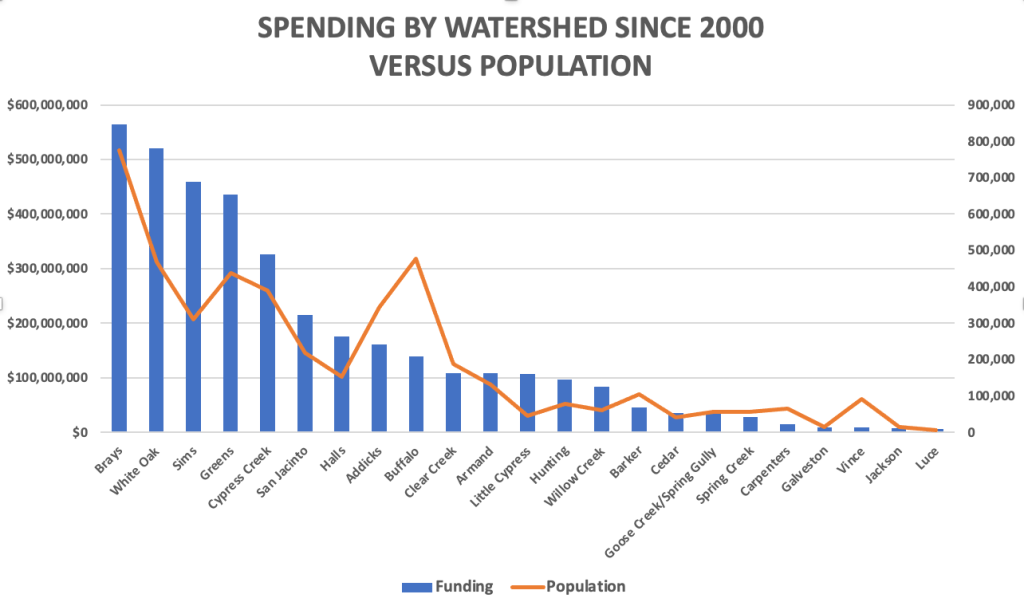
Here’s a graph of total funding by watershed since 2000, arranged from highest to lowest.
Watersheds rank ordered by amount of flood-mitigation funding received between 1/1/2000 and 12/31/2121.
Funding correlates with population. But you can see notable exceptions below. Some watersheds get far more funding than their proportion of the population, i.e., White Oak, Sims and Greens. Others get far less.
Spending is not allocated proportionately to population in all cases. Six out of eight LMI watersheds received more funding than their population alone would justify.
But population alone does not tell the whole story. Some watersheds are huge and some small. So I also looked at population density per square mile. The curves correlated even less.
Graphing population density vs. total spending shows more variance. Of the eight LMI watersheds, four (Brays, White Oak, Sims, and Greens) get far more than their population density alone would dictate.
As we saw last year, funding flows primarily to damage. The chart below plots funding versus the total number of structures in each watershed damaged in five major storms (Allison, Tax Day, Memorial Day, Harvey, and Imelda). The slope of the curves closely match. But several major exceptions exist.
Historical Discrimination?
Many community groups from LMI neighborhoods have alleged historical discrimination in the distribution of flood-mitigation funding. I just don’t see it. All of the pie charts below take into account all funding between 1/1/2000 and 12/31/2021 based on invoice dates.
The county itself sent almost 60% of its flood-mitigation funding to one third of the watershedswith majority LMI populations.An even larger percentage came from partner funding.Whether you look only at county funding, partner-funding, or the total, the picture is still roughly the same.One third of the watersheds get almost two thirds of the funding.Top 4 include Brays, White Oak, Sims and Greens. All have an LMI percentage higher than 50%.
LMI Population Now Correlates Higher with Funding than Damage
A coefficient of correlation of 1.0 is considered perfect. A good example: between gallons of gas in your car and the distance they will take you.
As a result of the constant tweaking of the equity funding formula, “Population” and “LMI Population” now correlate more highly with “Funding” than “Damage.” The correlation between “Funding since 2000” and:
Population Density = .54
Damage = .85
Population = .87
LMI Population = .89
Statisticians consider all of the last three very high.
A myth being promulgated in Harris County Commissioners Court and certain low-to-moderate income (LMI) watersheds these days goes something like this:
The FEMA Benefit/Cost Ratio (used to rank grant applications for flood-mitigation projects) favors high-dollar homes.
That disadvantages less affluent, inner-city neighborhoods compared to more affluent suburbs.
Therefore, less affluent neighborhoods get no help and the more affluent neighborhoods get it all.
This post busts that myth. But it won’t stop activists from demanding more “equity.”
If you look at all flood-mitigation spending in Harris County since 2000, on average, less affluent watersheds already receive 4.7X more partner funding per watershed than their more affluent counterparts.
Analysis of data obtained via FOIA request
Myth Ignores Other Factors, Frequently Leaps to Wrong Conclusions
Like much of political discourse these days, the myth focuses on a narrow sliver of truth, ignores other factors, and frequently leaps to the wrong conclusions.
An analysis of Harris County Flood Control District data going back to the start of this century shows how far off the myth can be.
Today, I focus on partner grants because they represent such a huge percentage of the flood-bond budget and because there is so much misinformation floating around about them.
And I will look at partner funding from the standpoint of outcomes, not just processes (as in the myth).
Methodology for Analysis
For this analysis I obtained Harris County Flood Control District spending data between 1/1/2000 and 9/31/2021 via a Freedom of Information Act (FOIA) request. I requested the data by watershed, decade, pre-/Post Harvey, source of funding (local vs. partner), and type of activity (i.e., engineering, right-of-way acquisition, construction and more). I cross-referenced this with other data such as flood-damaged structures, population, population density, and percentage of low-to-moderate income (LMI) residents.
When considering grants, the percentage of LMI residents in a watershed takes on special significance. Department of Housing and Urban Development (HUD) grants often require high percentages of LMI residents in the area under consideration.
In the charts below, you will see references to watersheds with LMI populations above and below 50%. Above 50% means more than half the residents in the watershed have an income LESS THAN the average for the region. Below 50% means more than half the residents earn more than the regional average.
Harris County has 23 watersheds. Eight have LMI percentages above 50% (less affluent). Fifteen have LMI percentages below 50% (more affluent).
When reviewing the charts below, pay particular attention to the italicized words: Total, Partner, and On Average. They represent three different ways to look at the same question: Do housing values disadvantage an area when applying for grants?
For this analysis, I focused only on the long term, since decisions on more than a billion dollars in flood-bond grants are still outstanding.
FOIA Analysis Contradicts the Popular Myth
One of the first things you notice when you look at watersheds above and below 50% LMI, is that the eight least affluent watersheds have gotten more than 60% of all dollars actually spent on flood mitigation since 2000.
Less affluent watersheds, despite being half as numerous, received 60% of all dollars since 2000.
Because the allegation was that partnership grants favored affluent areas, I then analyzed whether partner dollars went mostly to affluent or less-affluent watersheds. The answer is less affluent…overwhelmingly.
More than 70% of all partner dollars in the last 22 years went to the eight less-affluent watersheds.
The last observation by itself is telling. But because of the widely different number of watersheds in each group, I also wanted to calculate the average partner dollars per watershed in each group. This blows the “rich neighborhoods get all the grants” argument to pieces. Less affluent watersheds got, on average, 4.7X more.
Dividing the total partner dollars by the number of watersheds in each group shows that less affluent watersheds average 4.7X more than affluent ones.
This busts the myth. But digging even deeper into the data reveals two things: wide variation between sources of funding and withinLMI groupings.
USACE Funding Skews Partner Totals
The U.S. Army Corps of Engineers (USACE) accounts for much of the partner funding. USACE has provided significant funding for projects in the Sims, Brays, White Oak, Hunting, and Greens Bayou watersheds. The Clear Creek watershed will also soon see work on a new USACE project. USACE has completed its planning process and proved positive benefits to national economic development. That made projects worthy of Federal investment.
Halls Bayou: Digging Deeper
The Halls Bayou watershed also went through the USACE planning process, but the results did not show enough flood-damage-reduction benefits to outweigh the costs of the proposed projects. Thus, the Halls Bayou watershed currently has no USACE-funded projects.
Despite that, Halls has received more partner funding than 16 other watersheds since 2000. Only two watersheds in the affluent group of 15 received more partner funding. See the table below.
Total and partner spending by watershed since 2000 arranged in order of highest to lowest LMI percentages.
USACE also evaluated the more affluent Buffalo Bayou; results showed that costs outweighed the flood-damage-reduction benefits there.
Despite Halls having the highest percentage of LMI residents in Harris County, Halls has received more total funding and 2.5X more partner funding than Buffalo Bayou in the more affluent group.
FEMA Considers More than Home Values, Not All Grants Come From FEMA
While it’s true that FEMA considers housing values as a factor in benefit/cost ratios, benefit/cost ratios (BCRs) also consider factors such as:
The number of structures damaged
Threats to infrastructure
Proximity to employment centers
Need for economic revitalization
Percentage of low-to-moderate income residents in an area
Number of structures that can be removed from the floodplain by a project.
USACE funds dozens of different types of flood-mitigation programs. Many support national defense, the national economy, strategic interests, the environment, commerce and navigation.
So don’t settle for soundbites. They often mislead.
Posted by Bob Rehak on 12/30/2021
1584 Days since Hurricane Harvey
https://i0.wp.com/reduceflooding.com/wp-content/uploads/2021/12/Screen-Shot-2021-12-29-at-4.53.47-PM.png?fit=1366%2C740&ssl=17401366adminadmin2021-12-29 21:28:052021-12-30 14:37:20Equity Myth Buster: “Rich Neighborhoods Get All the Flood-Mitigation Funding”
Widening of Hunting Bayou, one of the poorest and most flood-damaged watersheds in the county, is kicking into high gear.
Annual Rate of Spending Almost Quadruples since Harvey
According to data obtained as part of a Freedom of Information Act (FOIA) request, Harris County Flood Control District and its partners (mainly the Army Corps and City of Houston), spent $44 million on flood mitigation in the Hunting Bayou watershed between 1/1/2000 and Hurricane Harvey.
That averaged $2.4 million per year for those 18 years. However, in the 4 years since Harvey, HCFCD has spent $37 million – more than $9 million per year.
That rate of spending averages 3.75X higher after Harvey than before.
HCFCD Spending Data Obtained via FOIA Request
Here’s a breakdown.
From FOIA Request.Hunting Bayou flood-mitigation expenditures by time period and category since 1/1/2000 through end of third quarter 2021.
Focus of Current Construction Activities
The upstream portion of Hunting Bayou parallels the south side of Loop 610 for most of its length. Where North Loop 610 turns south, Hunting cuts under it between McCarty and Wallisville Roads. From there it continues east. It then turns southeast at San Pedro Street and eventually joins Buffalo Bayou and the Ship Channel.
Note width of floodplains in red box. HCFCD is now widening Hunting between the left and right boundaries of the box.From Harris County Flood Education Mapping Tool. Blue = 100-year. Green = 500-year floodplain.
The Hunting Bayou watershed has the second highest percentage of low-to-moderate income (LMI) residents in the county (69%) after Halls Bayou (71%) immediately to the north.
Hunting also is heavily industrialized with rail yards, tank farms, manufacturing, and shipping companies. The highest points of land are the railroad tracks. Within the red box above, you can see how they affect the flood plain.
After driving around the neighborhoods along Hunting Bayou for an entire day, it appears that the worst storm damage is in the red box above. Many homes are boarded up and abandoned in this area. Others have been elevated. Some have been renovated and are waiting for the next flood.
Current Construction Photos of Bayou Widening Efforts
HCFCD bayou-widening efforts focus on this area right now. They extend from US59 on the west to approximately Wayside Drive on the east. Bayou widening may be an understatement. HCFCD appears to be creating a long series of connected detention basins, some more than 450 feet wide and several city blocks long that narrow at bridges.
This should help drain water from nearby neighborhoods during heavy storms. See pictures below all taken on Sunday, 12/19/2021. They generally trend from west to east, starting at US59 and heading downstream.
Looking east at first of numerous ponds along channel of Hunting Bayou. Photographed from over US59. Loop 610 is in upper left.
Looking east over Hunting Street. Loop 610 on left.Note new hike and bike trails in this and other pictures below.
Looking east from Kashmere Street at a previously excavated area now covered with grass and newly excavated areas beyond it.
Looking east from over Wipprecht Street at work in progress.
Looking east toward Lockwood from Pickfair Streetand one of the constrictions mentioned above.
Closer shot of constriction at Lockwood.
Looking east from Hutcheson Park
Opposite angle. Looking west over expanse of Hutcheson Park. Loop 610 on right.
Looking NE from the eastern end of Hutcheson Park, where Hunting cuts under 610.
Looking NE from over Loop 610 toward Homestead Detention Pond in background.Kelly Street cuts left to right through top of frame.s
Looking east from over Homestead at limit of current downstream work.
Funding Flows to Damage
Altogether, the current excavation work stretches 3.33 miles.
In the last five major storms (Allison, Tax Day, Memorial Day, Harvey, Imelda), 15,763 structures have flooded along Hunting Bayou. That ranks 7th among all Harris County Watersheds. But one must remember, that Hunting, comprises only 31 square miles. That ranks it 19th in size out of 23 watersheds. The damage per square mile ranked #2 (508.5 structures).
Another reason spending has accelerated here is political policy – namely the Equity Prioritization Framework implemented a year after the flood bond passed.
https://i0.wp.com/reduceflooding.com/wp-content/uploads/2021/12/20211219-DJI_0152.jpg?fit=1200%2C799&ssl=17991200adminadmin2021-12-19 20:53:442021-12-19 23:31:42Widening of Hunting Bayou Kicks into High Gear
Harris County Commissioners Court considered a motion today by the County Administrator to change the prioritization of flood-bond projects for the fourth time. By a 3-2 party-line vote, they approved a proposal that could soon lead to depriving outlying neighborhoods of flood bond funding. The vote today was preliminary. Before they take a final vote, they will submit the proposal to the Community Flood Resilience Task Force (CFRTF) for input, then take a final vote in 60 days. Based on past experience, the CFRTF will likely rubber stamp the three recommendations in the proposal:
Exclusion of partner funding
Inclusion of street flooding in 500 year floodplain
Counting people not structures when measuring benefits
Exclusion of Partner Funding
The exclusion of partner funding will mean that 90% match grants from the US Department of Housing and Urban Development (HUD) will no longer be available to anyone. Inner city neighborhoods will use flood-bond money to complete their projects instead of HUD money. And more affluent, outlying neighborhoods do not qualify for HUD grants.
County Judge Lina Hidalgo, Precinct 1 Commissioner Rodney Ellis, and Precinct 2 Commissioner Adrian Garcia all admitted during debate that there wasn’t enough money to complete all the bond projects. But they voted to consider the allocation changes regardless.
Precinct 4 Commissioner Jack Cagle and Precinct 3 Commissioner Tom Ramsey also agreed there wasn’t enough money to complete all bond projects. However, they voted against the proposal.
The 3-2 vote will send the proposal to the CFRTF for input. To date, the CFRTF has rubber stamped everything proposed by Democrats that benefits low-to-moderate income (LMI), inner-city neighborhoods at the expensive of outlying neighborhoods.
That means construction funds may not be available for outlying projects by the time inner city neighborhoods complete theirs.
Those who compiled the list of bond projects were counting on approximately $2.5 billion in partner funding. The Flood Control District has already secured more than a billion just three years into a ten year bond. But this move could now jeopardize a large portion of the remaining partner funding.
Inclusion of Street Flooding
Not one project in the flood bond addressed street flooding. That is not within HCFCD’s scope of responsibility.
Regardless, Commissioner Garcia said, “People don’t care where they flood from. They just want it fixed.” He never addressed the budget issue or who was responsible for cleaning out those roadside ditches – Garcia, Ellis, Turner and other City mayors!
Expanding the scope of the bond and eliminating partner funding will mean even fewer dollars left over to address flooding in outlying neighborhoods.
I have photographed hundreds of clogged roadside ditches like these in watersheds inside Beltway 8. Dems now want to use what’s left of your flood bond money to clean them out even though the flood bond never mentioned them.
Counting People Not Structures
Typically, the objective of flood-mitigation projects is to remove structures, not people, from a flood plain. By counting people, not structures, in an evaluation matrix, you push funding toward more densely populated neighborhoods. Normally, helping more people is good. But what if the density is vertical, not horizontal?
Let me give you an example. Consider an apartment building with a hundred residents. But none lives on the ground floor.
Now consider 25 single family homes each with three people. All live on the ground floor.
Project A could take a 100 people out of the flood plain whose apartments would not flood. Project B would take 75 people out of the floodplain and prevent damage to 25 structures that would flood. Should A or B get the flood-mitigation project?
This provision would also drive funding away from outlying neighborhoods which generally have fewer apartments.
The People Spoke and Are Being Ignored
The People – with a Capital P – voted on the flood-bond and approved it overwhelmingly. Now its being repeatedly changed by a few individuals to push ever more funding to inner-city neighborhoods which already get the lion’s share. These latest moves could deprive outlying neighborhoods of construction dollars needed to complete projects.
Seems to me that the three Dems and their proxies are depriving half the county of their votes and taxes.
The two Republicans on Commissioners Court, Precinct 4 Commissioner Jack Cagle and Precinct 3 Commission Tom Ramsey, argued against the changes.
Commissioner Cagle argued that “We must do what we say. We must work on projects in the bond.” He went on, “Changing the projects included in the 2018 flood bond is a bad idea. The promises we made to voters in 2018 are sacred. While I support the concept of asking to finance more flood mitigation projects in the future, the public has to know that we can be trusted to keep our word.”
Top 4 LMI Watersheds Receive 53% of All Funding since 2000
However, when you look at spending to date and the ever-changing “equity” guidelines, we’re far from approaching anything that resembles equity. And we’re getting farther from it with each round of changes to the so-called “equity” guidelines.
Four LMI watersheds out of 23 (Greens, Sims, Brays and White Oak) have received 53% of ALL funding since 2000, yet their representatives complain about historical prejudice and demand more.
Analysis of HCFCD Spending Data from 1/1/2000 through Q3 2021 obtained via FOIA request
For the record, that’s $1.6 billion out of $3.1 billion during the period of comparison.
Top LMI Watersheds Get More than Twice as Much as Top NON-LMI Watersheds
Comparing those 4 LMI watersheds with the most dollars to the four NON-LMI watersheds with the most, we can see that LMI watersheds have received more than two dollars for every dollar received by a non-LMI watershed.
Pie represents total dollars spent among top four LMI and NON-LMI watersheds. An LMI watershed is one where more than half the residents earn below the average annual income for the region.
The four LMI watersheds receiving the most money included Brays, Greens, Sims, and White Oak Bayous.
The four NON-LMI watersheds receiving the most included Cypress Creek, Addicks, San Jacinto and Buffalo.
All dollars include HCFCD and partner spending from 1/1/2000 through Sept. 30, 2021.
Bottom 4 LMI Watersheds Get 3X More than Bottom 4 NON-LMI
At the opposite end of the spectrum, the four LMI watersheds receiving the least money have received 3X more dollars than the four lowest NON-LMI watersheds since 2000.
Comparison of total dollars spent in the four lowest LMI and NON-LMI watersheds since 2000 through the end of Q3 2021.
There are only 8 LMI watersheds hence the comparison of groups of four.
The four LMI receiving the least dollars since 2000 include Halls, Hunting, Goose Creek/Spring Gully, and Vince.
The four NON-LMI watersheds receiving the least include Luce, Galveston, Jackson and Carpenters.
But what about those other NON-LMI watersheds in the middle of the spending pack? Simple. Altogether, the scale is already so tilted, they can’t tilt the balance back much. See comparison below of ALL LMI and NON-LMI watersheds.
LMI vs. Non-LMI flood-mitigation funding through Q3 2021 for ALL watersheds. Note Non-LMI watersheds outnumber LMI watersheds almost 2:1, yet have gotten only a little more than a third of total funding.
Partner Funding Also Favors LMI Watersheds, Not Affluent Ones
Anyone who doubts the percentages above can check my calculations. Here’s the raw spending data for each watershed with percentages of low-to-moderate income residents – including pre- and post-Harvey spending.
I’ve also included partnership funding since 2000 for each watershed. Because the dollars involved vary widely and because Non-LMI watersheds outnumber LMI watersheds 2:1, the fairest way to compare partner funding is by looking at it as a percentage of total funding for each watershed since 2000.
Watersheds with a high percentage of LMI residents are not disadvantaged in total spending or partner funding. LMI watersheds are those with a percent of LMI residents above 50%.
During that period, 26% of all flood mitigation funding in Harris County has come from partners, such as FEMA, HUD, the Army Corps, TWDB or cities. However, LMI watersheds have attracted a higher percentage of partner spending: 30%.
While that’s not a huge advantage, it shows conclusively that LMI watersheds, as a rule, are not disadvantaged when it comes to partnership funding.
The correlation between total dollars and partnership dollars spent in all watersheds is not a perfect (1.0), but very high at .79.
In fact, the two highest partner percentages both belong to LMI watersheds (Sims at 55% of the watershed total and White Oak at 33%). The two lowest partner percentages belong to two of the most affluent watersheds (Willow Creek at 6% and and Barker at 3%).
This debunks another myth frequently heard in commissioners court, i.e., that partner dollars always go to the watersheds with the highest home values.
Conclusion: Organize, Protest
Outlying communities must organize and protest en masse before commissioners take a final vote on shifting even more dollars to LMI communities based on bad information. If they change the deal on this flood bond, they’ll do it again on the next.
Fool me once, shame on you. Fool me twice, shame on me.
Posted by Bob Rehak on 12/14/2020
1568 Days since Hurricane Harvey
The thoughts expressed in this post represent opinions on matters of public concern and safety. They are protected by the First Amendment of the US Constitution and the Anti-SLAPP Statute of the Great State of Texas.
https://i0.wp.com/reduceflooding.com/wp-content/uploads/2021/12/Screen-Shot-2021-12-14-at-8.56.24-PM.png?fit=1616%2C854&ssl=18541616adminadmin2021-12-14 22:23:322021-12-15 09:44:23Move by Dems Could Mean Flood-Bond Projects in Outlying Neighborhoods Never Get Built
For years now, certain Commissioners have argued that poorer watersheds should get more help because their residents are financially less able to recover from floods. But none has ever said what a fair split should be. They just incorrectly assert that rich neighborhoods like Kingwood get all the money to justify shifting even more money toward poorer neighborhoods.
Where Money Really Goes
So let’s look at where the money is really going. Via a Freedom of Information Act (FOIA) request, I obtained Harris County Flood Control District (HCFCD) spending data by watershed dating back to 2000. The numbers below go through the end of the third quarter this year.
LMI Watersheds Already Receive 61% of All Spending
Because of damage patterns during floods and “equity guidelines” established by Commissioner’s Court, eight LMI watersheds have received 61% of all flood-mitigation spending since 2000. Fifteen other watersheds cover twice as much area but receive only 39%.
LMI = residents earning less than half of average income for region. An LMI watershed is one where more than half the residents qualify as LMI.
But the lopsided spending is even more dramatic when you look at the distribution within the LMI category. Just four watersheds have received more than half of all spending since 2000.
Spending by watershed since 2000.Includes HCFCD plus partners.
The top four LMI watersheds alone (Brays, White Oak, Sims and Greens) have received 53% of all flood-mitigation spending since 2000 even though they comprise just one quarter of the square mileage in the county.
HCFCD spending data through end of q3 2021.
Proposed Changes in Allocation Formula Could Accelerate Spending in LMI Watersheds
The changes being considered tomorrow would let projects in poorer neighborhoods move forward immediately before the status of $750 million in HUD funding becomes clear – reportedly in January. They would also let flood-bond money be used to cover street flooding, something never contemplated in the flood-bond project list and something that is not part of HCFCD’s charter.
These changes could ultimately leave projects in more affluent watersheds without enough money to complete them. For a fuller discussion of the impacts, see this post. What’s Fair?
As certain commissioners seek to increase spending in LMI neighborhoods even more, the question arises: “Are others getting their equitable share?” I’ve asked that question many times and can never get an answer. I’m always met with silence. Regardless, tomorrow, certain commissioners will try to tilt the scales even further. I’ll be watching to see how they try to justify it.
To comment on the proposal (Item 17 on the agenda), you must sign up to speak before 10:00 a.m. on Tuesday, December 14, if you attend the meeting in person. If you attend virtually, you must sign up to speak no later than 8:00 a.m. at https://appearancerequest.harriscountytx.gov/. If you sign up to speak, you will be placed in a queue and called when it is your turn.
Posted by Bob Rehak on 12/13/2021
1567 Days since Hurricane Harvey
The thoughts expressed in this post represent opinions on matters of public concern and safety. They are protected by the First Amendment of the US Constitution and the Anti-SLAPP Statute of the Great State of Texas.
https://i0.wp.com/reduceflooding.com/wp-content/uploads/2021/12/Screen-Shot-2021-12-13-at-2.58.23-PM.png?fit=1708%2C1120&ssl=111201708adminadmin2021-12-13 16:19:242021-12-13 16:22:39Should Already Lopsided Flood-Mitigation Spending Tilt Even More Toward LMI Neighborhoods?