Houston Planning Commission’s “Livable Places” Initiative Could Increase Flooding
Second in a series on the Houston Planning Commission’s Livable Places Initiative
“Livable Places” is a new initiative by the City of Houston Planning Commission designed to increase housing affordability and equity while increasing the walkability of neighborhoods.
To achieve these goals, the Commission is recommending new rules that govern development, platting and parking. They would also result in greater housing density especially in inner city neighborhoods. However, they affect the entire city.
Moreover, greater density usually comes at the expense of more impervious cover, which contributes to flooding. Despite several attempts to minimize the growth of impervious cover, the Planning Commission has not studied what the aggregate impact could be.
City Council will consider approval of the recommendations on Wednesday, 6/21/23. This Planning Commission website explains how you can sign up to speak.
ReduceFlooding.com recommends that City Council does NOT approve “Livable Places” recommendations until any potential impact on flooding is known and residents can decide whether the potential increased risk is worth any benefits developers may gain.
Proposed Changes
Specifically, ordinance changes to Chapters 42 and 26 of the City Code would allow:
- Second Dwelling Unit: Lets this housing type be larger with parking based on the unit size. Think of apartments over garages or small backyard homes. Only available where deed restrictions do not prohibit their construction.
- Multi-Unit Residential: Brings back this affordable housing type which is small scale 3–8-unit apartments with a height restriction to fit better within neighborhoods.
- Courtyard Style Development: Promotes this housing type where lots are located around a common courtyard, and do not require street frontage. The proposal includes green space requirement per lot, parking could be separate from the units and height restriction so that homes are at neighborhood scale.
- Narrow Lot Development: Incentivizes this housing type where lots take rear access or shared access to reduce the number of times pedestrians come in potential conflict with automobiles. In addition, these regulations help the redevelopment be more walkable by reducing the driveway widths and preventing vehicles from hanging into the sidewalk.
- Market Based Parking: For all the four residential development types mentioned above, the proposal is to allow market-based parking in proximity where other transportation options exist and make housing affordable. This means the City will not have a minimum parking requirement, and the property owner can provide parking based on market needs.
Impervious-Cover Impact Unknown
The recommended changes encourage greater density by allowing subdivision of lots. That generally means more rooftops and concrete per acre. Rooftops and concrete are called impervious cover because they do not let stormwater soak into the ground.
Here are the proposed changes to ordinances. They mention impervious cover only once – in the context of courtyard development. And that mention says, courtyards “may be a mix of impervious or pervious material…” They specify no percentages.
Neither do they mention pier-and-beam foundations that could elevate new buildings above flood risk without reducing floodplain storage. Any reduction in the volume of floodplain storage could affect the flood risk of existing homes.
Several department spokespeople pointed out, however, that any development would have a 65% cap on impervious cover. Above that, developers would have to build stormwater detention basins. But the wording of that requirement is reportedly being reconsidered at this time by the Public Works Department.
The Planning Commission did not conduct a comprehensive engineering study to estimate any increase or decrease in impervious cover associated with the recommended changes. That raises the question:
Will impervious cover increase, decrease or stay the same?
The City knows how much impervious cover we have now because the City charges us a Drainage Fee for it. And even though the City cannot predict which types of housing developers will want to build and in what quantities, it could easily calculate the increase or decrease for representative scenarios and make guesstimates.
But we may not know a definitive answer for decades until the impact of these recommendations become visible on the ground or during the next large flood.
Fortunately, the Planning Commission has recommended several changes that may help offset increases in density. They include, but are not limited to:
- Elimination of some mandatory parking requirements in neighborhoods where car ownership is low and access to public transportation is high.
- Making greater use of alleys to preserve green space in public right of way at the front of lots.
- Allowing shared driveways that are narrower than two individual driveways.
Density, Impervious Cover and Drainage Fees
Back in 2010, the City taught us that impervious cover was bad. The City even created a fee to discourage it called the Drainage Fee. Since then, the City has collected 3.2 cents per square foot of impervious surface from each home and business owner with curb and gutter drainage in the City. Those with street ditches pay a slightly lower rate. The total collected to date is reportedly approaching $1.3 billion.

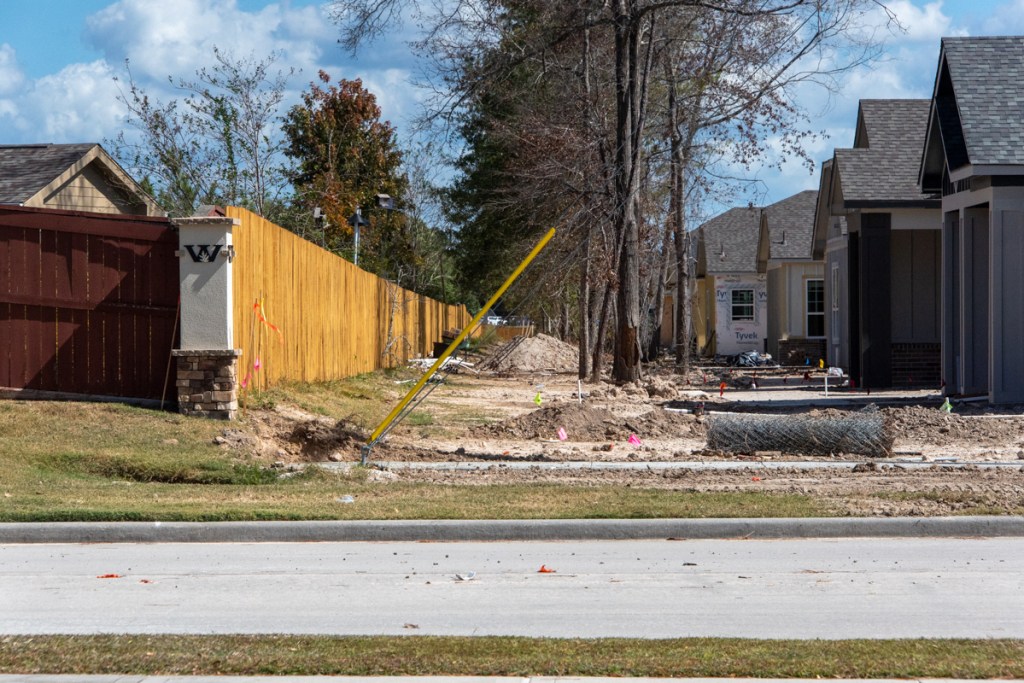
The proposed changes could make neighborhoods like the one above even denser and tax the capacity of storm sewers/roadside ditches even more. Many of the ditches are already blocked and in serious need of restoration.

More Resources
To learn more about the Planning Commission’s Livable Places initiative and what the Commission believes to be the benefits, visit these resources.
Livable Places Housing Recommendations FAQ 6-16-2023
Proposed Draft Ordinances (C42 and C26)
Planning Commission changes as part of the action.
Proposed Market-Based Parking map for Housing Recommendations
Summary of Amendments Flyer in English or Spanish *Updated
Streetscape exhibit for small lots *Updated
Letters received about Housing Amendments *Updated
Comments matrix.
Livable Places does have the potential to provide some benefits to some market segments. So to make sure we get this right, I encourage comment from members of the planning commission, local governments, affected citizens, and flood experts. To submit a guest editorial, reach out to me through the Contact page of this website.
Posted by Bob Rehak on 6/16/2023
2117 Days since Hurricane Harvey
The thoughts expressed in this post represent opinions on matters of public concern and safety. They are protected by the First Amendment of the US Constitution and the Anti-SLAPP Statute of the Great State of Texas.