Harris County and the Houston area are receiving $863 million from the U.S. Department of Housing and Urban Development (HUD) via the Texas General Land Office (GLO) for disaster relief and flood mitigation. So, on Thursday, April 25, 2024, GLO Commissioner Dr. Dawn Buckingham met with a group of Lake-Houston-Area leaders to discuss the area’s flood mitigation needs.
The meeting, arranged by State Representative Charles Cunningham, also included Director Tina Petersen of the Harris County Flood Control District (HCFCD); Director Thao Costis of Harris County Community Services (CSD); Humble Mayor Norman Funderburk; and Dustin Hodges, Chief of Staff for City of Houston Council Member Fred Flickinger.
(L to R) Dustin Hodges; Tina Petersen; Thao Costis; Dr. Dawn Buckingham; Rep. Charles Cunningham; Norman Funderburk; Alice Rekeweg; Scott Elmer, HCFCD; and Kathleen Jordan.
Projects Vie for Funding
As reported on 4/23, Buckingham was in Houston to discuss Disaster Relief and Mitigation projects totaling $863 million. But there are more deserving projects than money to fund them all. So Buckingham, her team, HCFCD and CSD met with area leaders to discuss needs.
The GLO administers the distribution of HUD funds in Texas. Among Lake Houston Area projects discussed for funding were:
No commitments were made at the meeting, but the mood was positive and everyone left smiling.
Buckingham is still collecting information. She listened attentively, asked probing questions and left with a better understanding of the area’s needs.
Splitting the Woodridge Basin into two phases helps ensure that at least one compartment will get funded and provide enough mitigation to let the Taylor Gully Channel Improvements move forward.
Other Topics
Several other topics came up toward the end of the hour-long meeting. They included sedimentation, dredging, and the need for sand to nourish beaches along the Texas coast. The GLO needs sand to replace eroding beaches…and this area needs to remove sand collecting in streams and Lake Houston.
That raised the tantalizing possibility of collaboration for mutual benefit and solving two problems at once.
More news to follow.
Posted by Bob Rehak on 4/26/24
2432 Days since Hurricane Harvey
https://i0.wp.com/reduceflooding.com/wp-content/uploads/2024/04/Buckingham-Meeting.jpg?fit=1100%2C413&ssl=14131100adminadmin2024-04-26 11:38:552024-08-01 16:41:46Area Leaders Meet with GLO Commissioner Buckingham
Harris County Flood Control District (HCFCD) will soon start building the new Mercer Stormwater Detention Basin, a large flood-risk reduction project along Cypress Creek adjacent to Mercer Botanical Gardens. HCFCD issued a notice to proceed to the contractor in December 2023 and the contractor is now mobilizing.
The basin is north of FM-1960, east of the Hardy Toll Road, south of Cypress Creek and west of the Memorial Hills.
Combined 512 Acre Feet in Two Basins
The Mercer Stormwater Detention Basin project will include the excavation of 512 acre-feet of soil and other materials from the site. Once complete, the $14.8 million dry-bottom stormwater detention basin will provide approximately 166.8 million gallons of stormwater storage during heavy rainfall events.
The U.S. Department of Housing and Urban Development’s Community Development Block Grant Disaster Recovery program provided a $15.4 million grant for the project. Another $9.7 million comes from the 2018 Bond Program.
Arrowstone Contracting, LLC received a $14,846,391 contract for construction. Land acquisition, engineering and administration will consume the rest of the budget.
The stormwater detention basin will include two separate compartments, north and south, with an equalizer pipe connecting them. An 54″ outfall pipe will also be constructed along the north compartment so stormwater can slowly flow back into Cypress Creek after storms pass.
Construction Caution
Contractors will access the work area via FM-1960 or Lazy Ravine Lane in the Memorial Hills Subdivision. The contractor may use heavy construction equipment such as dump trucks, excavators and bulldozers. Motorists should be aware of truck traffic when passing near construction access points and along truck routes.
The HUD Grant stipulates that construction needs to finish by Fall 2024. And construction is scheduled to take 348 days.
Reducing Backwater in Tributaries
This is among multiple stormwater detention basin projects the Flood Control District is developing in the Cypress Creek watershed.
A regional drainage study for the watershed found that flooding along tributaries of Cypress Creek is predominately caused by rising stormwater in Cypress Creek backing up into tributaries. Flooding is not caused by a lack of sufficient stormwater conveyance or drainage capacity on the tributaries themselves. Therefore, stormwater detention basins could be a beneficial project to reduce that backwater issue.
Project Benefits
The Mercer Basins will remove the 100-year area of inundation from 30 structures and the 500-year area of inundation from an additional 17 structures.
The project also includes a 30’ wide berm to accommodate maintenance and future recreational amenities.
The project avoids wetlands and will lower the water surface elevation by .35 feet during a 100-year storm event, according to HCFCD.
Upstream detention was one of three major prongs of the strategy to reduce flooding in the Lake Houston Area. This and every other little bit will help downstream.
The regional drainage study found here recommends nearly 25,000 acre-feet of additional stormwater detention in the Cypress Creek watershed. That would be enough to hold back the peak flow during Harvey for almost 5 hours. In lesser storms, the benefit would last even longer.
Posted by Bob Rehak on 1/2/24based on information from HCFCD
2317 Days since Hurricane Harvey
https://i0.wp.com/reduceflooding.com/wp-content/uploads/2024/01/Mercer_Map-e1704245017906.png?fit=1100%2C1100&ssl=111001100adminadmin2024-01-02 19:34:562024-01-02 19:47:54Construction Beginning Soon on Mercer Stormwater Detention Basin
Note: This story was updated on 7/26/23 to include more information about phasing of the Northpark Drive expansion project.
After what turned out to be a ceremonialgroundbreaking on 4/13/23, the Northpark Drive expansion project appears to have started in earnest on 7/25/2023. Northpark is a vital evacuation route for tens of thousands of Kingwood and Porter residents during floods.
Cones and Culvert Line Northpark Center Ditch
Traffic cones line the center ditch between Russell-Palmer and the Kingwood Diversion Ditch.
Looking west toward Russell-Palmer Road
Contractors have also stacked what looks like six-foot reinforced-concrete pipe on the edge of the Northpark Drive ditch where it enters the Kingwood Diversion Ditch.
Looking SE across Northpark from Fireworks Stand parking lot to Flowers of Kingwood.
They have also begun excavating the Northpark center ditch.
Looking E to Kingwood and City Limit (Green sign).
Project Partners
Project partners include:
Lake Houston Redevelopment Authority
City of Houston District E
Montgomery County Precinct 4
Texas Dept. of Transportation
Harris County Flood Control
Plan Vs. Execution
In general, the project partners plan to widen Northpark by a lane in each direction (toward the middle). But instead of taking land and parking from merchants, the project partners plan to replace the center ditch with culvert then pave over it.
Early plans indicated that the area between US59 and Russell-Palmer would be Phase One and that Russell-Palmer to the Diversion Ditch and eventually beyond Woodland Hills would follow.
However, Ralph Deleon, a TIRZ engineer/project manager indicated that contractors are taking pieces of the phases out of order. Why? Contractors are ready to go. But not all the right-of-way and utility issues have been resolved.
So they’re approaching drainage first and starting at the downstream end – a best practice. In coming days, we should see additional activity on other portions of Northpark Drive. But Deleon emphasized that the public should have two lanes of traffic in both directions at all times.
The first thing that popped into my mind when I looked at the size of the culvert and the size of the ditch was that the culvert could not possibly convey all the water that the ditch used to.
Google Earth shows width of v-shaped ditch is 50 feet. Circular pipe is 6 feet.
Then I read this letter from Harris County Flood Control to the engineering company. It states, “The proposed improvement includes enlarging the proposed storm sewer system to provide inline detention and modeling the restrictors needed to meet allowable outflow requirements for both outfalls.”
The pipes shown above would definitely act as restrictors. I sure hope they don’t back water up into the street.
Having worked near Northpark for 22 years, I’ve seen the ditch overflow on multiple occasions. I’ve seen cars plunge to the bottom, emergency rescues, and stalled vehicles.
Harris County has put 37 of 93 subdivision drainage projects associated with the $2.5 billion 2018 Flood Bond on hold.
Reasons include:
Lack of funding
Inflation
Shortfalls in expected partner contributions
Constructibility of some projects
Social-vulnerability scores within the County’s Equity Prioritization Framework.
Of the 37 projects whose funding was cut, 24 were in Precinct 3 – a whopping 65 percent.
Technically, the projects have not been “cancelled.” The county has just run out of money to do them. But it has set no deadline for revisiting the projects on hold; is diverting HCTRA backstop funding for other uses; has articulated no other plan for raising additional funds; and is submitting projects for HUD funding that weren’t in the flood bond.
Commissioners court cut funding for projects in all three tables.
Impact of SVI Threshold on Disproportionate Budget Cuts
The deciding factor in many cases was the area’s social vulnerability index (SVI), which measures English language fluency plus minority and ethnic concentrations.
Precinct 3 Commissioner Ramsey argued to lower the SVI requirement for these projects to 50%. That would have met HUD requirements and also meant fewer budget cuts for Precinct 3.
But his Democratic colleagues proceeded to set the threshold at 75%, resulting in the lopsided cuts. The chart below shows how dramatically that affected Equity Prioritization Index rankings in the tables above.
But according to this motion, they will be paused, put on hold, and have their funding cut.
Harris County Engineering, Flood Control, Daniel Ramos from the Office of Management and Budget and the Harris County Toll Road Authority all recommended the funding cuts on 2/21/23.
Their rationale: It will provide funding certainty for the highest ranked projects using the Equity Prioritization Index and free up the Toll Road Funds for other uses. The toll road funds were backstopping bond funds.
Unfortunately, six years after Harvey, no large pots of money remain out there dedicated to the storm. Ramsey has his work cut out for him against 4-1 odds.
Is Race-Based Funding Even Constitutional?
To justify the unequal cuts, the other three commissioners and county judge relied on complicated race-based formulas that favor minorities. Then they justified the funding cuts with the usual misleading “worst first” mantra when they aren’t even measuring actual flood damage.
The recent Supreme Court Ruling on Affirmative Action calls into question whether race-based funding is even constitutional.
I’m eager to hear from lawyers on the constitutionality of distributing billions of dollars on the basis of racial discriminators, such as SVI.
Posted by Bob Rehak on 7/11/23
2142 Days since Hurricane Harvey
The thoughts expressed in this post represent opinions on matters of public concern and safety. They are protected by the First Amendment of the US Constitution and the Anti-SLAPP Statute of the Great State of Texas.
https://i0.wp.com/reduceflooding.com/wp-content/uploads/2023/07/Screenshot-2023-07-11-at-4.11.55-PM.png?fit=988%2C1558&ssl=11558988adminadmin2023-07-11 20:09:502023-07-12 09:43:2665% of Harris County Flood-Bond Projects that Lost Funding Are in Precinct 3
Harris County Community Services Department (CSD) has finally shared a high-level summary of how it would spend $750 million in Hurricane Harvey Flood Mitigation Funds from the U.S. Department of Housing and Urban Development (HUD). The plan, called a Method of Delivery (MOD), was submitted to the Texas General Land Office (GLO) in December for preliminary approval, but returned to the county in January for tweaks to make it HUD-compliant.
CSD’s presentation is informational; the Department is not yet seeking approval from Commissioner’s Court. But this will be the public’s first peak at CSD’s direction.
While the presentation predictably emphasizes support for low-to-moderate income and socially vulnerable groups, it also contains some surprises. For instance, it mentions supporting activist groups, but fails to mention protecting bridges, hospitals and schools.
Damage to I-69 bridge disrupted areas to the north for 11 months after Harvey.Harvey flooded 6 of 9 buildings at Lone Star College/Kingwood. Repairs cost $60 million and disrupted classes for more than a year.
Long-Awaited
George P. Bush, former GLO Commissioner, requested a $750 million allocation for Harris County from HUD in May of 2021. HUD formally approved that amount in March of 2022. But Harris County Commissioner’s Court didn’t approve the grant agreement until August 31, 2022. And CSD didn’t submit its plan to the GLO for review until late December 2022.
The CSD plan reflects both HUD’s mission and the requirements spelled out in the State’s Action Plan. However, the GLO required CSD to make some tweaks to the initial plan to make it HUD compliant. During the tweaking process, Commissioners replaced CSD Director Dr. Adrienne Holloway with a new Interim Director, Thao Costis, the department’s SIXTH leader under County Judge Lina Hidalgo in four years. Costis previously led a non-profit group in Houston that provided services to homeless people.
“These funds intend to mitigate and build resiliency against flood risks in the region.”
Harris County Community Services Department
The Department claims it conducted ample data analysis and public input on the MOD. It says constituents lobbied for prioritizing “(1) low- and moderate-income population, (2) social vulnerability, (3) total population, and (4) National Flood Insurance Program repetitive loss properties.”
However, the presentation does not specify whether:
Repetitive losses will be weighed against previous mitigation investments. Will an area that once had high repetitive losses, but which already received hundreds of millions of mitigation dollars, still be prioritized over other areas that have received no flood-mitigation money?
Severity of flooding will be considered. Will one inch of flooding in a low-income home count for more than ten feet of flooding in a middle-income home?
Threats to infrastructure will be addressed. For instance, the loss of interstate highway bridges, hospitals and schools.
There’s no measure of “current risk,” nothing that addresses “threats to life,” and nothing that balances impacts to the community vs. impacts to individuals…at least in the summary that CSD is now sharing.
Plagued by “Vague”
CSD claims it prioritizes flood control and drainage improvements, natural or green infrastructure, water and sewer facilities, provision of generators, buyouts, and planning activities. I say “claims” because CSD did not provide a list of projects with the presentation. Nor did it provide a matrix for scoring projects.
The CSD presentation also referenced 2018-Flood-Bond Projects. But it’s not clear at this time if a potential project list goes beyond Hazard-Mitigation-Action-Plan Projects and Flood-Bond Projects … or even if there is a list. Nor does the presentation hint at which Haz Mit and Bond Projects would be included.
Finally, the summary makes no mention of any effort to ensure transparency and accountability. The public deserves to know where its money goes!
CSD says it would administer the $750 million grant and work with Harris County Flood Control District to “reduce flood risk and increase resiliency to future natural disasters for Harris County’s nearly 5 million residents.”
But we still don’t know who will get how much for what. Nor do we know what the expected benefits will be.
Partnerships
Though only Harris County and the Flood Control District are eligible to receive HUD’s $750 million, CSD states it will partner with other entities, including cities, within Harris County, that have “shovel-ready” flood mitigation projects. “Additionally, Harris County could sign [emphasis added] a Memorandum of Understanding with the Flood Control District to increase the amount of funding devoted to the 2018 Flood Control Bond,” says CSD. In other words, the County might send some of its share to HCFCD. But there’s no guarantee.
The CSD presentation shows that Harris County Flood Control will get only $326.25 million from the $750 million. The rest will go to Harris County. Out of the other $423.75 million, the county plans to spend $97.5 million on administration and planning. That would leave both Flood Control and Harris County with $326.25 million for actual mitigation work.
Word on the street in the engineering community is that the Harris County Engineer’s Office will handle the County’s portion of the money. Adrian Garcia appointees lead the Engineering Department and that would help Garcia influence where the money goes.
Inconsistencies, Typos Raise Questions
CSD’s presentation boils over with contradictions and typos that don’t speak well for “attention to detail” in a grant where $750 million is at stake. For instance, the plan says:
Projects will help the county’s entire population, but it prioritizes projects in low- and moderate-income, socially vulnerable areas.
CSD needs a 3-year extension … for shovel-ready projects.
The County will partner with other entities within Harris County, but cities and towns get $0.
I can’t wait to hear the explanations…especially how the money will help neighborhoods outside the Beltway given inside-the-Beltway priorities.
Nor can I wait to hear whether the cities in Harris County rebel against a plan that seemingly guarantees them nothing.
The presentation literally underscores CSD’s priorities:
“Once the MOD is approved by GLO, Harris County MOD entities reserve the right to partner with local governmental entities and special districts in the county to perform eligible projects, including but not limited to cities and Flood Control District. Harris County may also partner with local non-profit agency [sic] regarding public service activities that support mitigation and resiliency, particularly in areas were [sic] drainage or other mitigation activities are affecting low-to-moderate income households [sic] stability.”
Yikes! Three typos in one sentence!
Next Steps
This presentation only informs Commissioner’s Court and the Public about the grant’s status. CSD will not ask for approval of any projects on Tuesday. That will come later. The next steps include:
Public comments
Determining how to partner with other entities (Still, after almost 2 years)
Preparation of final MOD that incorporates public comments and responses
Approval of final MOD by County Commissioners (2/21/23)
GLO review and approval (March/April)
After GLO approval:
“Call for information of projects” (whatever that is)
Submit project packets to Commissioners Court
Submit project packets to GLO
Start projects (Fall 2023) six years after Hurricane Harvey!
Commissioner’s Court begins at 10AM on Tuesday. If you wish to make a public comment, here’s how to sign up to speak.
Posted by Bob Rehak on 1/28/2023
1978 Days since Hurricane Harvey
The thoughts expressed in this post represent opinions on matters of public concern and safety. They are protected by the First Amendment of the US Constitution and the Anti-SLAPP Statute of the Great State of Texas.
https://i0.wp.com/reduceflooding.com/wp-content/uploads/2018/08/Flooded-Sign.jpg?fit=936%2C590&ssl=1590936adminadmin2023-01-28 20:07:262023-02-20 12:41:00County Outlines Plan for $750 Million in Flood-Mitigation Funds
On Dec. 2, I printed a story about an upcoming virtual community meeting on Taylor Gully. At the time, Harris County Flood Control District (HCFCD) had not yet released details yet on how to attend. They have now. See their press release below. Please share it with family, friends and neighbors if you live anywhere along Taylor Gully. That includes parts of Sherwood Trails, all of Elm Grove, all of North Kingwood Forest, parts of Mills Branch, Woodstream Forest, and even parts of Porter in Montgomery County. Yes, plans will affect Porter also.
Virtual Community Engagement Meeting for the Taylor Gully Flood Risk Reduction Project
HCFCD PROJECT G103-80-03.1-E001
BOND PROJECT F-14
The Harris County Flood Control District will hold a community engagement meeting for the Taylor Gully Flood Risk Reduction Project. The purpose of this meeting is to inform residents about the project’s status, share project information and gather important community input on this effort.
The Taylor Gully Flood Risk Reduction Project focuses on improvements to Taylor Gully and the mitigation required to build the project. This project will be partly funded through the 2018 Bond Program, which was approved by Harris County voters on August 25, 2018. Community engagement is a foundational component of the Bond Program, and we invite your participation and input as projects are implemented.
Register Now
The virtual community engagement meeting will be held on:
Or by phone* at 855-925-2801 with Meeting Code: 3364
The meeting will begin with a brief presentation to share project updates, followed by a moderated Q&A session with Flood Control District team members. Residents will be able to submit questions, comments and input before, during and after the meeting, which will be considered during project development. Any comments not addressed during the Q&A session will receive a response at the conclusion of the public comment period.
Even if you are unable to attend the live meeting, residents are encouraged to register for the meeting to receive future project updates. A recorded version of the meeting will be available on the Flood Control District’s website and YouTube channel after the event. Meeting accommodations can be made for those with disabilities. If needed, please contact 346-286-4040 at least three business days prior to the meeting. For questions, please contact the Flood Control District at 346-286-4000, or fill out the comment form online at hcfcd.org/taylor.
Esta reunión de participación comunitaria se llevará a cabo en inglés; sin embargo, el Flood Control District proporcionará intérpretes de idiomas y materiales traducidos a pedido. En caso de necesidad, comuníquese al 346-286-4040 al menos tres días hábiles antes de la reunión.
*If you attend by phone only, maps and other exhibits will not be visible. However, information will be available after the meeting on the project webpage at hcfcd.org/taylor.
Posted by Bob Rehak on 12/8/2022based on a press release from HCFCD
1927 Days since Hurricane Harvey and 1176 since Imelda
https://i0.wp.com/reduceflooding.com/wp-content/uploads/2022/12/20221206-Taylor-Gully.jpg?fit=1200%2C1200&ssl=112001200adminadmin2022-12-08 07:25:162022-12-08 07:36:21Save the Date: HCFCD Releases Details of Taylor Gully Meeting
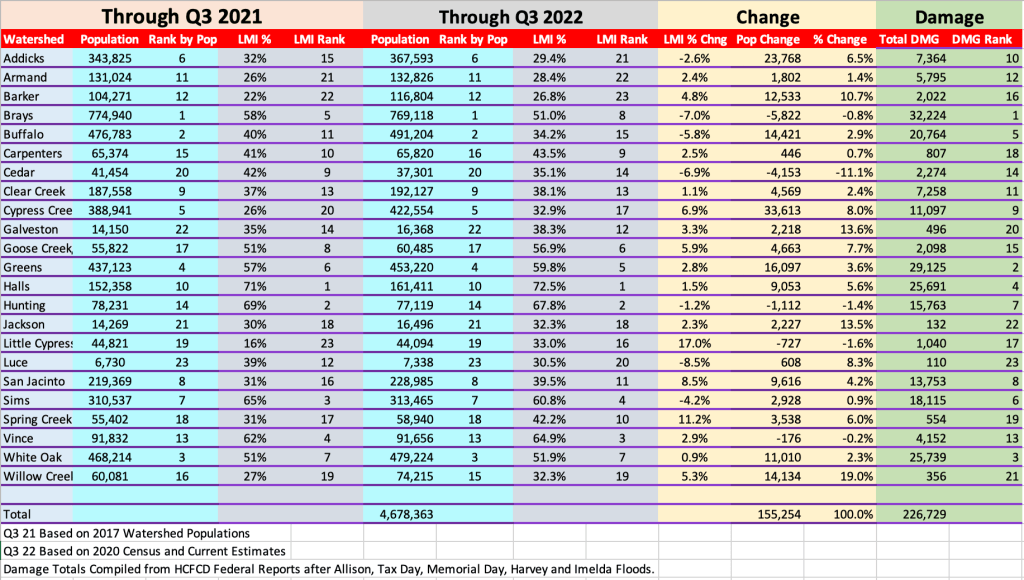
Like damage, population is one of the “weighting factors” considered in the distribution of flood-mitigation dollars. Compared to 2017 estimates of watershed populations in Harris County, 2022 estimates show that five watersheds have lost population. But overall, the county has gained 155,254 people.
The map below shows the location of each of these watersheds.
Harris County Watersheds by Harris County Flood Control District
Reasons for Shifts Unclear
I had wondered whether the five major floods in Harris County between 2000 and 2020 (Allison, Tax Day, Memorial Day, Harvey and Imelda) would cause the most heavily flood-damaged areas to lose population. But that seems not to be the case.
The most heavily damaged watershed (Brays) lost the most population (in raw numbers). But the second most heavily damaged watershed (Greens) gained more than 16,000 people, the second largest gain.
I found no meaningful correlation between flood damage and population loss or growth. Nor do data suggest that flood-mitigationspending has much influence either. Contradictory examples abound. And statistical correlations rate as negligible to weak.
Five Watersheds Lost Population
Compared to the previous Census estimates from 2017:
Brays lost 5,822 people (0.8%)
Cedar lost 4,153 people (11.1%)
Hunting lost 1,112 people (1.4%)
Little Cypress lost 727 people (1.6%)
Vince lost 176 people (0.2%).
In percentages, Cedar Bayou lost the most population. Cedar was the sight of the Arkema disaster which blocked evacuation routes along Highway 90 during Harvey. The watershed currently has only about 37,000 people, ranking it 20th among the 23 watersheds in Harris County.
In five major storms between 2000 and today (Allison, Tax Day, Memorial Day, Harvey and Imelda), flood damage varied widely within those five watersheds:
Brays flooded 32,240 structures, the most of any watershed.
Cedar flooded 2,274.
Hunting flooded 15,763.
Little Cypress flooded 1,040.
Vince flooded 4,152.
18 Watersheds Gained Population
Eighteen other watersheds gained population and also had widely varying degrees of flood damage. These, too, showed little correlation.
Altogether, the county’s watersheds gained 155,254 people, despite 226,729 damaged structures during the five major storms.
Negligible Correlation of Flooding and Population Gain/Loss
The “population flees flooding” hypothesis didn’t hold much water.
Flood damage and “number of residents lost” correlated at only a 0.16 level – insignificant. Flood damage and “percent of residents lost” correlated at only 0.28, extremely weak.
A perfect correlation is 1.0. It indicates that for every unit of change in one variable, there is a corresponding unit of change in another variable. However, that was far from the case here. Variations seemed random.
The County has a strong draw: jobs. Also, family, friends, neighbors and support networks remain powerful attractions that keep most people anchored.
The new HCFCD data do not suggest why gains and losses occurred.
Top reasons for relocation typically include: greater safety, better schools, better housing, new jobs, and upgrading from apartments to homes.
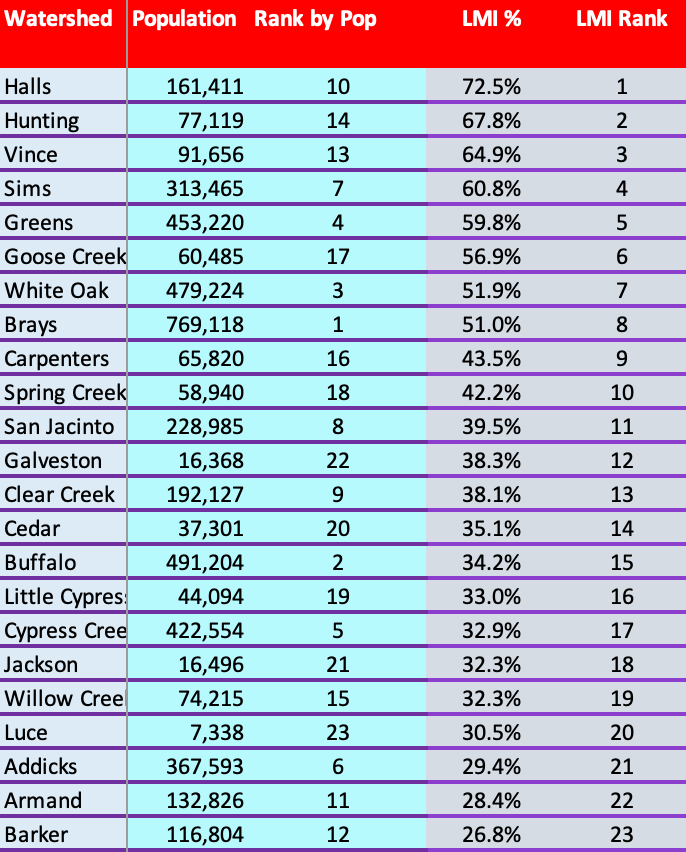
LMI Population Trends
HCFCD also measures “LMI population.” LMI stands for Low-to-Moderate Income. The Census Bureau defines LMI as “families making less than the average for the region.”
Harris County has 42.6 % LMI residents. So 57.4% of residents make above the average for the region.
This is important because the LMI percentage plays a huge role in partnership grants from the US Department of Housing and Urban Development (HUD). Most, but not all, HUD grants go to areas with LMI populations higher than 70%. A notable exception is the pending $750 million HUD Harvey flood-mitigation grant. It only requires that 50% of the money benefits LMI households.
The latest HCFCD data shows that watersheds at bothends of the income spectrum lost LMI population. We still have the same eight LMI-majority watersheds we had in 2017. However, one deserves special mention.
Brays’ LMI population declined so significantly that it almost flipped from the “majority LMI” category to “majority upper income.” It went from 58% to 51% LMI.
Sixteen other watersheds gained LMI population. Some had huge flood losses; others had few.
The correlation between total flood damage and LMI Population Gain/Loss is .34, slightly higher than for the entire population but still considered “weak.”
Here are Harris County’s watersheds ranked in order of LMI population percentage.
As of 11/21/2022
My next post will discuss how the distribution of flood-mitigation funds relates to population changes and other factors. I will also discuss what the prospects for flood mitigation in the Lake Houston Area are during Lina Hidalgo’s second administration. Don’t miss it.
Posted by Bob Rehak on 11/21/22, based on data provided by HCFCD in response to a FOIA Request
1910 Days since Hurricane Harvey
The thoughts expressed in this post represent opinions on matters of public concern and safety. They are protected by the First Amendment of the US Constitution and the Anti-SLAPP Statute of the Great State of Texas.
https://i0.wp.com/reduceflooding.com/wp-content/uploads/2018/10/HarrisCountyWatersheds.jpg?fit=1500%2C972&ssl=19721500adminadmin2022-11-21 11:40:152022-11-21 12:46:59Five Watersheds Lose Population While Harris County Gains Slightly
A reader who visited a trade show recently in Las Vegas sent me several links to news stories about flash flooding there. 1.24 inches of rain caused widespread flooding, killed at least two people, and resulted in dozens of high water rescues!
His comment: “Imagine if those types of videos were in Houston – for less than two inches of rainfall. You can’t, because it doesn’t happen.”
Why Houston Doesn’t Flood On Two Inches
While HCFCD employees take a lot of heat every time someone floods, we should remember that it takes far more rain for people to flood here. There are several reasons for that.
First, Harris County formed a flood control district in 1937. Clark County, Nevada (Las Vegas) didn’t start its until 1985. So, we had an almost 50-year head start on them.
But sadly, some fast-growing counties around Harris County STILL don’t have flood control districts! (We’ll save that discussion for the next legislative session.)
Second, our topography is different. Because Harris County is so flat, rainfall spreads out and starts soaking into the ground before flooding starts. Rainfall in Las Vegas is funneled by the rugged landscape. It picks up velocity, so it doesn’t have time to soak in. Concentrated rainfall turns into flash flooding. The Las Vegas Wash funnels a 1,879 square mile watershed toward a metro area of 2.29 million people.
I was almost killed by a flash flood in Tucson once. While hiking along a stream bed with friends in the desert, we saw rain in the distant mountains. They immediately suggested moving to higher ground. Minutes later, a wall of water 6-8 feet high came boiling down that stream bed!
Atlas-14 rainfall probabilities for northern Harris County now form the basis for building codes and flood-mitigation projects.
In other words, we build things to withstand more rain in a day than Las Vegas receives in FOUR YEARS.
That takes some talent. Especially when surrounding areas send ever-increasing amounts of floodwater downstream because of lack of comparable controls upstream. And that could be why flood control districts around the country try to recruit talented HCFCD employees.
Despite our occasional frustrations, we should never forget: They stand between us and disaster.
Posted by Bob Rehak on 8/13/2022
1810 Days since Hurricane Harvey
https://i0.wp.com/reduceflooding.com/wp-content/uploads/2022/08/20220813-Screen-Shot-2022-08-13-at-12.03.28-PM.jpg?fit=1200%2C675&ssl=16751200adminadmin2022-08-13 12:53:152022-08-13 19:42:38Giving Thanks to the Women and Men of Harris County Flood Control
Two new updates provided to Harris County Commissioners on Tuesday 8/2/22 show progress on the 2018-flood-bond and MAAPnext slowing compared to previous estimates.
Flood-Bond Progress
In many ways, the Harris County Flood Control District (HCFCD) Flood-Bond Progress Reports are a model of government transparency. They provide detailed information, even when the news is not all good. The most recent flood-bond update showed that HCFCD:
Awarded one more construction contract during July. The count increased from 46 to 47.
Awarded 5 new agreements, down from 11 the previous month.
Spent only $8 million on bond projects including:
$1 million dollars in grant money – $368 million total up from $367 million the previous month.
$6 million in bond funds – $551 million total up from $545 the previous month.
$1 million in local funds – $141 million total up from $140 million the previous month.
Completed 0.2% more of the projects in the bond – 22% up from 21.8%.
Finished 21 more buyouts – 802 up from 781.
Stayed at .97 on the Key Performance Indicator Scale – slightly behind schedule.
Step by Step, Project by Project
Updates also show the progress of each bond project in the form of detailed GANNT charts. Check pages 4-9 to see projects in your watershed.
The next two pages show the amounts spent and funded to date in each watershed. These maps give readers a good idea of where the money goes. Draw your own conclusions and remember the map below when certain politicians tell you some watersheds don’t get anything.
The last two pages describe updates on active maintenance and construction projects with spending on each. They show that – five years after Harvey – the Lake Houston Area still has only two active capital projects in construction. Both are excavation and removal contracts for $1000 each.
Pace of Projects Slowing
From looking at these reports month after month, it feels as though the pace of activity has slowed. We’re 40% of the way through the 10-year flood bond in terms of time, but only 22% complete. The gap is getting wider. Worse…
At the rate of $8 million per month, it would take 500 months to spend the next $4 billion in the bond.
That’s more than 40 years, not the 10 originally planned. We need explanation. But HCFCD executives were not immediately available to provide it due to travel schedules. I will follow up.
The timeline has slipped three months. In earlier updates, HCFCD indicated new maps would be released in spring/summer this year. Now, the target has slipped to summer/fall. A large portion of the update consisted of trying to explain why. In a sentence, “We’re waiting on FEMA.”
So I tried contacting FEMA. But FEMA could not provide a more precise estimate.
Harris County followed standard practice by submitting its findings to FEMA prior to public release. FEMA is currently reviewing all data and models. It is also producing preliminary Flood Insurance Rate Maps (FIRMS) based on those models. The data will help determine flood insurance premiums as FEMA moves to an actuarial-based system called Risk Rating 2.0.
Next Steps
When FEMA is ready, it will first brief community officials and floodplain administrators, and give them access to preliminary data. Shortly thereafter, FEMA and HCFCD will hold a series of open houses to brief the public. Public comment periods and appeals follow.
So, at best, the new maps will be released in 2024, seven years after Harvey. That’s fairly consistent with the length of time it took to finalize new flood maps after Tropical Storm Allison in 2001. Those maps became official on 6/17/2007.
But this process is far more complex because of Risk Rating 2.0. It includes individual flood-risk assessments for millions of homes. And that risk assessment will now also include street flooding, not just coastal and riverine flooding.
Posted by Bob Rehak on 8/5/2022
1802 Days since Hurricane Harvey
https://i0.wp.com/reduceflooding.com/wp-content/uploads/2022/08/20220804-Screen-Shot-2022-08-04-at-4.39.46-PM.jpg?fit=1200%2C915&ssl=19151200adminadmin2022-08-05 15:59:242022-08-05 18:52:26Flood Bond, MAAPnext Updates Show Projects Slowing
Contractors have begun clearing more than 1,100 acres owned by CH-B Kingland, LLC, north of the newly opened Grand Parkway. Construction plans obtained from Harris County Flood Control District via a FOIA request indicate the developer will build single-family residences. But the documents also indicate that engineers are using pre- not post-Harvey floodplain maps and data. That could be tragic news for unknowledgeable home buyers as well as homeowners already in the area. I have interviewed people near here whose homes flooded twice in the last five years.
While the current maps date back to Tropical Storm Allison, they are still official. But why?
The remaining 4,000 acres span three counties: Montgomery, Harris and Liberty. According to Appraisal District maps in the three counties, CH-B Kingland still owns acreage on both sides of the Grand Parkway. The opening of Segment H of the Grand Parkway will likely help the value of CH-B’s remaining land skyrocket – despite the fact that wetlands pockmark the land.
Looking east along the Grand Parkway at additional land owned by CH-B Kingland not yet being developed. This is immediately east of Kingland West in Liberty County and not part of Kingland West construction plans.
A group called Castle Hill Partners appears on construction plans. Castle Hill Partners (CHP) is a private investment firm specializing in commercial development. The company provides turnkey investment, construction, loan servicing and property management services.
Effect on Flooding
Of Montgomery, Harris, and Liberty counties, Harris has the most stringent flood regulations. And according to a source close to the engineering company (Jones & Carter), Harris refused to permit the plans unless the engineering company followed Harris’ standards in all three counties. That part is good. The summary of floodwater detention below shows that the developer meets Harris County standards.
Screen capture from Kingland West construction plans.
Here is a summary of their Stormwater Pollution Prevention Plan. It declares, in writing, that all outfall structures will be constructed in accordance with Harris County standards. The Plan also describes measures contractors should use to prevent sediment from escaping the site.
Location of sand pits matches location of detention pond in Kingland plans.Satellite photo from 12/21.
When I last photographed these pits in June 2020, they had mostly dry bottoms. But the image above shows they now have wet bottoms. I hope there’s enough room in the ponds to hold the required amount of floodwater.
Helicopter photo from 6/20, eighteen months ago.Note small ponds already holding water in pits. Water table is high because of proximity to San Jacinto East Fork.
Contractors will make more room for floodwater with additional excavation adjacent to the ponds. Here’s where the engineers plan to move fill from and to in Phase 1. But there’s still a big problem – the size of floodplains on the maps being used.
Built to Pre-Harvey, Pre-Colony-Ridge Floodplain Standards
Unfortunately, the developer is using old flood maps and data developed after Tropical Storm Allison, not after Harvey.
See the disclaimer in the screen capture below. It appears in small type on virtually every page of the construction plans.
Screen capture from The Trails construction documents explains all calculations are based on old flood maps and pre-Harvey data.
Rosemary Fain and her husband who live just blocks south and east of Kingland West might disagree with that statement about “rare occasions.” Despite being farther from the East Fork than every Kingland West home will be, the Fains flooded twice recently from the East Fork, once during Harvey and again during Imelda. Water rose so high that it bridged out of the East Fork Watershed and started flowing into Luce Bayou – miles to the east!
I saw no reference to current floodplains or recent floods in the plans.
However, more than outdated rainfall-probability statistics affect flooding in this area. Just ask the people of Plum Grove, many of whom never flooded before Colony Ridge.
The sad fact is that the massive 20,000-acre Colony Ridge development in Liberty County, immediately east and north of Kingland, has increased and accelerated drainage. Colony Ridge has ALSO made the 2007 flood maps woefully out of date; the development started after the the old maps’ release – around 2012. Their out-of-control drainage blew out FM1010 less than 2 miles north of Kingland.
So why hasn’t MAAPnext released the new maps yet? They’re reportedly complete. More on that in a future post.
Posted by Bob Rehak on July 29, 2022
1795 Days since Hurricane Harvey
The thoughts expressed in this post represent opinions on matters of public concern and safety. They are protected by the First Amendment of the US Constitution and the Anti-SLAPP Statute of the Great State of Texas.
https://i0.wp.com/reduceflooding.com/wp-content/uploads/2022/07/20220722-RJR_0575.jpg?fit=1200%2C800&ssl=18001200adminadmin2022-07-29 17:56:522022-08-29 15:11:00Kingland West Clearing 1,123 Acres at FM1010 and Grand Parkway, Using Old Flood Maps