New Interactive Maps Show Flood Insurance Premium Changes With Risk Rating 2.0
Starting Oct. 1, FEMA’s new Risk Rating 2.0 will fundamentally change the way FEMA rates a property’s flood risk and prices insurance premiums. But to what extent will that affect premium changes in your area?
To help answer that question, the American Society of Flood Plain Managers (ASFPM) and The Pew Charitable Trusts recently unveiled new interactive maps. They show exactly where flood insurance premiums will decrease, increase, or remain the same — and by how much.
Risk Rating 2.0 incorporates more flood risk data to more accurately reflect a property’s individual flood risk. Types of data include:
- Frequency and types of flooding (river overflow, storm surge, coastal erosion, heavy rainfall)
- Distance to a water source
- Property characteristics ( elevation, cost to rebuild).
Visual Tools Make Data More Accessible
ASFPM developed the interactive maps to help local leaders better communicate what’s occurring in their communities, but it’s also easy enough for an average person to grasp.
“There is a fair amount of information available on Risk Rating 2.0. But getting that data out of spreadsheets is challenging. This new tool should help,” said Chad Berginnis, ASFPM’s executive director.
“Floods are this nation’s most frequent and costly natural disasters. And the trends are worsening. It’s important that people know their risk and buy flood insurance to help protect their homes and businesses. It’s equally important that communities take steps to minimize flood risk,” said Berginnis.
ASFPM used datasets from FEMA’s NFIP policyholder information to create the easy-to-use data visualization tool. The data are broken down across four categories. They range from a decrease in premiums to an increase of $20/month or more. A color-coded scale indicates the percentage of policyholders in each category.
Interactive Maps Show Premium Changes By State, Zip
The first interactive map at no.floods.org/rr2changes breaks down projected premium changes for each state and territory.
There are also two interactive maps by zip code:
- For existing single-family home policies at no.floods.org/rr2sfh
- For all existing NFIP policies at no.floods.org/rr2all (residential, commercial, multi-family, etc.)
The data compares a snapshot of policyholder premiums from May 31, 2020 with Risk Rating 2.0 premiums, applying statutory increase limits.
The comparison does not attempt to estimate premium increases that might have occurred without the new Risk Rating 2.0 pricing methodology.
This data won’t tell you what will happen to your premiums. But it will give you a rough idea of the percentages of people in your zip code who can expect increases within certain pricing brackets. The brackets include:
- Decreases
- Increases in the $0 to $10/month range
- Increases in the $10 to $20/month range
- Increases in the $20+/month range
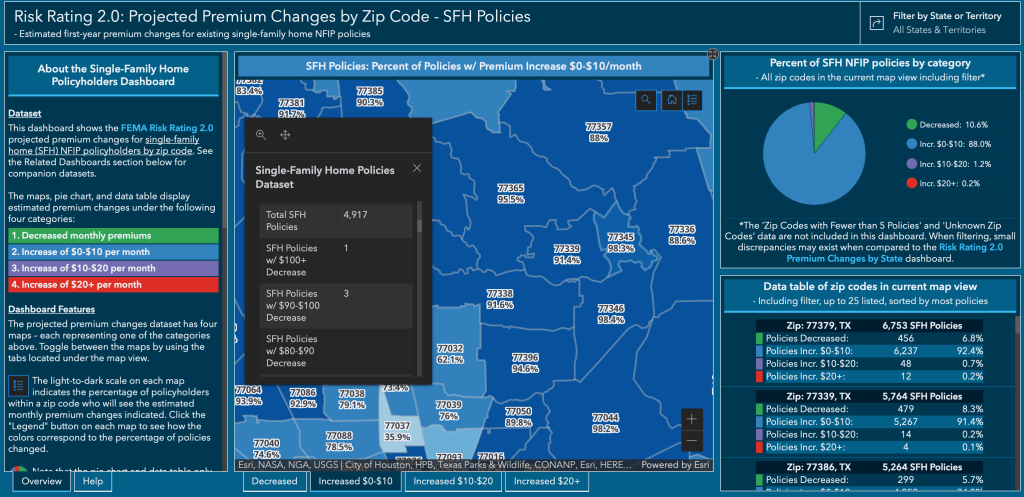
Zip Codes in Lake Houston Area
The maps for local zip codes showed that the vast majority of all local policies in the Lake Houston area will increase between $0 and $10 per month.

Clicking on the other tabs at the bottom of the map will show you the percentage of policies that fall into other ranges.
Very few people in these zip codes will see decreases. Almost everyone else will see increases greater than $10 or $20/month.

The maps contain far more detail than shown above. When you click on a zip code, areas surrounding the map and within the black pop-up box, display the data in tabular and graphic formats. Make sure you scroll through the data in the black pop-up box. It breaks the highest and lowest categories down into far more brackets. For instance, the $20+ category actually includes brackets up to $90-$100/per month.
Individual policyholders should contact their insurance agent for a personalized quote.
Use this data for comparison purposes to make sure you’re not overpaying. But remember, variations such as your proximity to water, first floor elevation, and the replacement value of your home could skew results from the average in your zip code.

First Pricing Update in 40 Years
This is the program’s first pricing update in more than 40 years.
“Under Risk Rating 2.0, FEMA is fixing longstanding inequities in the NFIP’s flood insurance pricing and establishing a system that is better equipped for the reality of frequent flooding caused by climate change,” said David Maurstad, senior executive of the National Flood Insurance Program. “Risk Rating 2.0 is not just a minor improvement, but a transformational leap forward that enables FEMA to set rates that are fairer and ensures rate increases and decreases are both equitable.”
According to FEMA, only 4% of policyholders nationwide are expected to see substantive increases. In a national rate analysis of current policyholders, FEMA has said:
- 23% will see premium decreases
- 66% will see, on average, premium increases of $0-$10/month (which is around what the average is now)
- 7% will see, on average, premium increases of $10-$20/month
- 4% will see, on average, premium increases of $20 or more per month.
Background on Risk Rating 2.0
Risk Rating 2.0 will deliver rates that are actuarially sound, equitable, easier to understand, and better reflect an individual property’s unique flood risk.
By communicating flood risk more clearly, the new methodology should help policyholders make more informed decisions on the purchase of adequate insurance and on mitigation actions to protect against flooding. FEMA is implementing the program in two phases:
- Phase I – New policies beginning Oct. 1, 2021 are subject to the new pricing methodology. Also beginning October 1, existing policyholders are able to take advantage of immediate decreases in their premiums when the policy renews.
- Phase II – Renewals of the remaining existing flood insurance policies will be written to the new plan starting April 1, 2022, allowing policyholders an additional six months to prepare for any adjustments.
Posted by Bob Rehak on 9/26/21 based on a press release from ASFPM provided by Diane Cooper
1489 Days since Hurricane Harvey

