San Jacinto Regional Flood Planning Group Submits Final Recommendations
The San Jacinto Regional Flood Planning Group (SJRFPG) submitted its final recommendations to the Texas Water Development Board on January 10. The 316-page report includes recommendations on floodplain management evaluation, strategies and projects; the plan’s impacts; administration, regulatory and legislative recommendations; and financing.

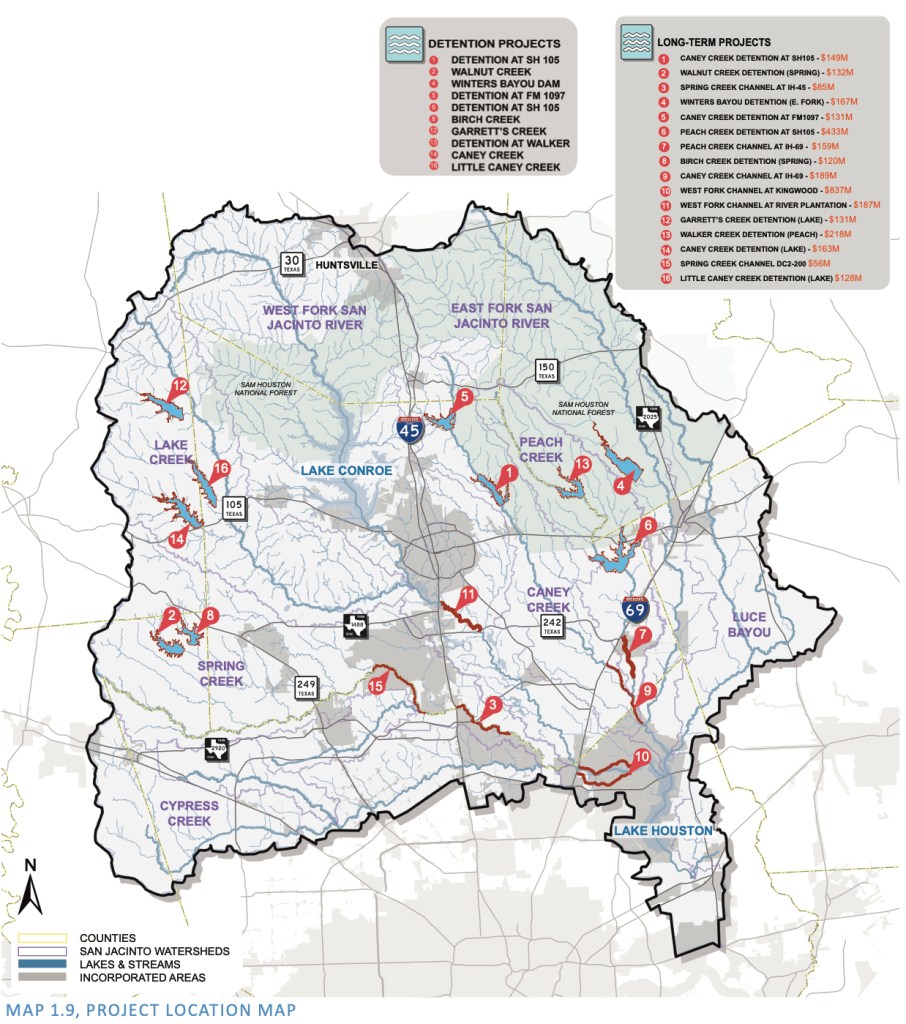
I discussed the floodplain projects and impacts when I reviewed the draft plan in August of 2022. Not much as changed with the projects and impacts except for some minor details.
Now, with the state legislature in session, I would like to review the administrative, regulatory and legislative final recommendations in Chapter 8.
Legislative Recommendations
The SJRPG made four legislative recommendations to facilitate floodplain management plus flood mitigation planning and implementation.
Provide recurring biennial appropriations to the Flood Infrastructure Fund (FIF):
In 2019, the legislature appropriated money to establish the FIF. However, it did not appropriate additional funds in 2021. We need more money to fully implement the plans in the coming years.
Provide state incentives to establish dedicated drainage funding:
State law provides municipalities with the authority to establish local drainage utilities. Those that don’t use that authority generally rely on federal partners to fund floodplain management and regulatory programs. Or else they use some combination of general tax revenues and municipal bonds. The state should incentivize local communities to fund drainage projects rather than rely solely on federal funding.
Provide counties with legislative authority to establish drainage utilities/fees:
Municipalities have that power. But the unincorporated areas of counties do not. Give counties a reliable source of revenue to implement, maintain and repair drainage projects. Let them establish drainage utilities and drainage fees in unincorporated areas.
Update the state building code on a regular basis:
Texas is missing out on a billion dollars in FEMA’s Building Resilient Infrastructure and Communities (BRIC) Grants because of antiquated building costs. To take advantage of those grants, we need to update building codes. Adopt recent versions of the International Building Code (IBC) and the International Residential Code (IRC) at a minimum. Also we should adopt updated codes regularly in future legislative sessions.
Regulatory and Administrative Recommendations
The plan also made the following recommendations for regulatory and administrative changes.
Upgrade TxDOT design criteria:
Require all new and reconstructed state roadways to be elevated at or above the Atlas-14 1.0% annual chance flood level. Use the 0.2% level if Atlas 14 has not yet been adopted. TxDOT should also consider future conditions, such as urbanization and climate variability, in its roadway design criteria. TxDOT does not in all cases design roadways consistent with minimum NFIP requirements. TxDOT should strive to meet NFIP standards, especially for critical infrastructure such as evacuation and emergency routes.
Recommend Minimum Statewide Building Elevation Standards:
Recommend statewide minimum finished floor elevations at (or waterproofed to) the FEMA effective 2% annual chance flood except in areas designated as coastal flood zones. Use the 1.0% annual chance flood elevation where Atlas 14 has been adopted. Incentivize higher building standards. Recent historic floods and NOAA’s updated Atlas-14 rainfall probabilities reveal how much base flood elevations (BFE) can change over time. Jurisdictions that have required a freeboard over the current BFE have mitigated the risk of these increasing BFEs.
Clarify the process and cost to turn Base Level Engineering (BLE) data into Flood Insurance Rate Map (FIRM) panels:
BLE efficiently models and maps flood hazard data at community, county, watershed, and/or state levels. Currently, the state and FEMA are heavily investing in BLE. Clearly communicate to local jurisdictions how to implement this data in regulations and flood insurance rate maps. The steps remain unclear to many local jurisdictions.
Establish and fund a levee safety program similar to the TCEQ dam-safety program:
The TCEQ has a program to inspect dams that fall under its jurisdiction. Levees, on the other hand, are not subject to a similar safety program despite posing similar risks during flooding events.
Promote flood awareness, education, safety and outreach:
Partner with the Texas Floodplain Managers Association (TFMA) to promote public flood awareness, education, and safety in communities. Also, partner with Texas Association of Counties to do the same for Floodplain Administrators lacking technical flooding background (e.g., some County Judges). A well-informed public can make better informed personal choices regarding issues that involve flood risk and also will be more likely to support public policies and mitigation measures to reduce that risk.
Support ongoing education/training for floodplain management:
Provide no- or low-cost online resources including training modules, webinars, and print. Target training for non-technical Floodplain Administrators (e.g., County Judges who may serve as Floodplain Administrators but not have the necessary technical background). This would help to make effective floodplain management more prevalent across the state, especially in smaller counties.
Develop state incentives to participate in the National Flood Insurance Program (NFIP) and Community Rating System (CRS) program:
NFIP works with communities to adopt and enforce floodplain management regulations that help mitigate flooding. CRS encourages practices that exceed minimum requirements of the NFIP. Both programs are essential to achieving State Flood-Plan goals. Implement State-led incentives to encourage communities to participate.
Develop a public database that tracks flood fatalities:
Fatalities have occurred during extreme flood events throughout the state’s history. A statewide database and tracking system with appropriate privacy restrictions could aid in future project planning and regulatory decision making. It could also help with future education efforts regarding actions that frequently lead to fatalities. An example is the importance of not attempting to drive through flood waters.
Help smaller jurisdictions prepare grant and loan applications or make the process easier:
Provide training for Councils of Governments (COGs) to assist with the funding process. Developing applications for project funding can be difficult, especially for smaller jurisdictions with limited experience and access to funding to obtain expert assistance. Simplifying applications and making funding available specifically for application development would serve to make the process more accessible across the state and help close knowledge gaps.
Develop interactive models that use Base Level Engineering (BLE) data:
Provide them to Regional Flood Planning Groups and their technical consulting teams. Standardize future conditions and land use data. The State’s and FEMA’s BLE data should be available in most parts of the state.
Allow partnerships to provide regional flood-mitigation solutions:
Flood risk does not recognize jurisdictional boundaries, yet many flood-mitigation programs prevent multiple jurisdictions from working together if they want to remain eligible state funding. Flood-mitigation studies and solutions require inter-jurisdictional collaboration. Update policies to encourage and permit it.
Next Step on Final Recommendations
These final recommendations sound like good ideas to me. Please communicate your feelings to your state senator and representative.
I have summarized the final recommendations above. To see their exact text, review chapter 8. Or see the entire report to put them all in context.
Posted by Bob Rehak on 1/22/2023
1972 Days After Hurricane Harvey