Breaches in Triple PG Sand-Mine Dikes Remain Open as Trial Drags into Year 8
3/1/26 – Travis County District Clerk records show that the state’s case against the Triple PG sand mine in Porter is now dragging into Year 8.
Meanwhile, breaches in the mine’s dikes remain open, allowing sediment-laden wastewater and stormwater to escape into the headwaters of Lake Houston, the source of water for more than two million people. The State of Texas originally sued the owners of the mine precisely because of such breaches.
The land on which the mine operates is under owned by Prabhakar R. Guniganti or one of several corporate entities that trace back to him. Guniganti is a cardiologist from Nacogdoches. The case began in 2019. And for a period, Guniganti kept shifting ownership of the mine through various shell companies and trusts to delay a trial. Finally, the state sued him as an individual.
Next came other delays related to discovery. Jury trials were cancelled in 2023 and 2024. In May 2025, a fourth amended scheduling order showed the discovery period should have ended in November 2025 and the trial should have started by February 9, 2026.
However, court records show that in December 2025, the court issued a FIFTH amended scheduling order. Ken Paxton’s office has stopped responding to emails regarding this case.

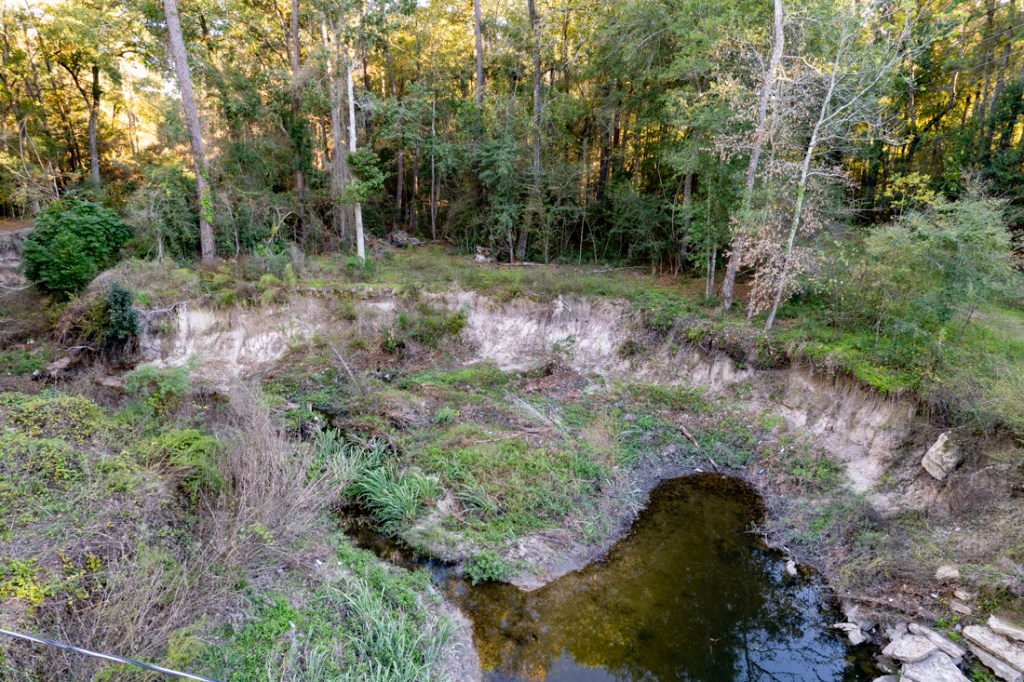
Meanwhile, erosion has created a breach into Caney Creek. It was caused by mining too close to a utility easement and now threatens pipelines carrying highly volatile liquids (HVL). It also threatens an electrical transmission tower.
Photos of Mine from 2/28/26
That particular breach has remained open at least since August 14, 2025. Here’s how it looked yesterday from several angles.
Guniganti’s mine stretches 2.5 miles from north to south. Montgomery County Appraisal District records show that he or one of his corporate entities still owns the property, despite name changes at the mine entrance on Hueni Road in Porter.


Guniganti doesn’t own the only mine on Caney Creek. Another exists upstream from his. But I didn’t see any breaches in that particular mine.
So, this may be a case of multiple mines or construction sites even farther upstream spoiling the water quality. Yesterday, I wasn’t able to work my way far enough upstream to see where the water color changed definitively.
Said another way, it’s not clear whether Guniganti’s mine 1) caused, 2) contributed to, or 3) played no role in this particular episode of Caney Creek sludge. However…
Impact on People and Fish
Two things are certain though. 1) The breaches let exposed sediment escape during storms. 2) The pollution is not good for people or fish.
For humans, sediment pollution increases filtration costs that show up in water bills. But for fish, sediment pollution can be fatal.
Yesterday, several fishermen told me that the white bass which usually spawn in this area are gone this year. So I asked ChatGPT how sediment pollution from sand mining and construction affect the spawning grounds for bass.
White bass, it seems, depend heavily on clean, course river substrates – typically gravel or cobble – for successful reproduction. Sediment pollution from sand mining operations and construction runoff can significantly degrade those spawning grounds through several mechanisms.
- Egg suffocation by fine sediment
- Filling the void spaces between stones. For many river fish, including white bass, >25–30% fine sediment content in spawning gravel begins to significantly reduce survival.
- Increased turbidity disrupts spawning runs through reduced visibility and clogged gills. White bass often migrate upstream tens of miles from reservoirs or large rivers to spawn; sediment plumes can disrupt these movements.
- Channel changes including bank collapse, loss of shallow riffles and channel downcutting
- Burial of eggs during storm pulses. Even a few centimeters of sand can eliminate a spawning bed.
- Impact on food chain. Even if eggs hatch, juveniles have a lower survival rate because sediment pollution also kills aquatic insects on which they feed.
For a deeper dive into the sediment pollution impacts from construction and sand mining on fish spawning, click here.
Volume of Sediment
Most sediment moves during storms. Scientists call these “sediment pulses.” And the bigger the storm, the bigger the pulses. One study suggests that Harvey moved 7.5 million metric tons of sediment in the San Jacinto watershed.
Loose sand in mines can dramatically increase sediment mobility.
Based on flood-damage studies and sediment-transport modeling, breaches of dikes around one large, sand pit can release 50-200 tons of sediment in a single storm.
Erosion happens naturally, even in heavily forested areas. But sand mines amplify sediment release because they:
- Store unconsolidated sand directly next to the river
- Remove vegetation and soil structure
- Use levees that can breach during floods
- Create pits that connect to the river during high water.
Relative Impact of Sediment Sources
ChatGPT compared the relative sediment contributions of several sources including:
| Source | Sediment Yield |
|---|---|
| Undisturbed forest | Very low |
| Agriculture | Moderate |
| Urban construction | High |
| Sand mining near rivers | Very high (episodic) |
Sand mines near rivers are especially problematic because:
- Exposed sand is easily mobilized
- Pit captures can deliver large slugs of sediment during floods
- Stockpiles and haul roads contribute chronic runoff.
Posted by Bob Rehak on 3/1/26
3106 Days since Hurricane Harvey
The thoughts expressed in this post represent opinions on matters of public concern and safety. They are protected by the First Amendment of the US Constitution and the Anti-SLAPP Statute of the Great State of Texas.