Ellis Equity Cuts Likely Violate Bond Language Approved by Voters
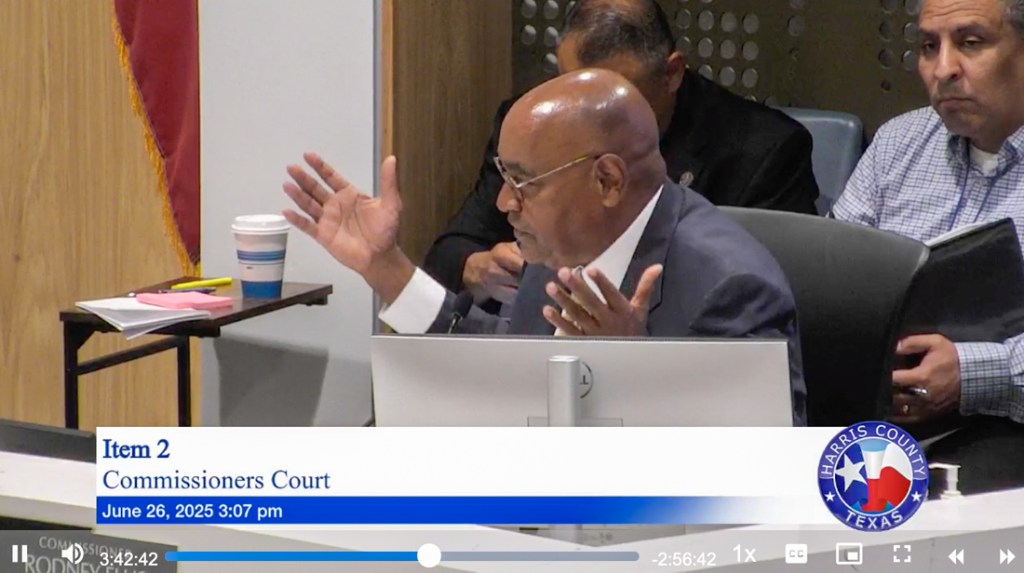
In Harris County Commissioners Court on June 26, 2025, Democrats voted 4:1 along party lines to reallocate all remaining money in the 2018 Flood Bond to projects that scored in the top quartile of Commissioner Rodney Ellis’ Equity Prioritization Framework.
That will defund all but a handful of projects that voters approved. Is that legal?
Examination of bond language that voters approved shows Ellis and his colleagues likely violated six provisions: 14 A, B, C, D, F, and G. Let’s examine each, starting with G.
Basis for Prioritization Distorted
Paragraph 14(G) specifies an “equitable” distribution of funds. Ellis “reminds” people constantly that bond language gives commissioners the right to prioritize projects. But he never mentions how he redefined the basis specified for prioritization.
Ellis uses a self-serving definition of “equity” instead of “equitable.” His race-based formula prioritizes social vulnerability instead of flood-risk and flood-damage reduction.
Open any dictionary and you will see that equitable means fair and impartial. That’s not Ellis. His self-serving formula penalizes areas that have higher flood risk than his and that have received no or little help from HCFCD.
Funds Not Used for Purposes Described
Paragraph 14(A) says that funds must be used only for purposes described.
Yet the bond came packaged with a heavily promoted list of projects, many of which are being defunded to pay for items that were not on the list.
Due to a lack of transparency and questionable accounting, it is unclear what the bond proceeds are being spent on. That may also violate 14(A).
Not Providing Benefits Throughout the County
Paragraph 14(B) says that projects will provide benefits throughout the county. Defunding all but the highest ranked “equity” projects will effectively create “funding deserts.” Remaining projects will not benefit taxpayers throughout the county.
Commissioner Tom Ramsey said, “This decision puts voter-approved funding of over $220 million in Precinct 3 at risk. It also threatens partnerships and matching funds from local, state, and federal agencies worth another $206 million. But the court voted to do just that, thus violating 14(B).
Bait-and-Switch
Paragraph 14(C) says that projects will include those described in the bond. But Ellis’ defunding will effectively kill many. Meanwhile, Ellis plans to fund others not in the bond. Promising one thing and delivering another is called bait-and-switch advertising.
The language in 14(C) was intended to focus HCFCD on delivering promised projects, not commissioners’ pet projects. But now, we are getting Ellis’ pet projects.
Rights of Way Endangered
Paragraph 14(D) says bond money will be used to purchase rights of way for the construction of future detention basins and channel improvements. The original bond list contained money to acquire land in the Little Cypress and Cedar Bayou watersheds.
But those projects fall below the cutoff in Ellis’ gerrymandering Equity formula. In the future, it may be impossible to purchase those rights of way. And without them, growth in those watersheds may doom another generation to flooding.
Slow-Motion Project Delivery
Paragraph 14(F) specifies that projects will be undertaken in an expeditious manner. But execution of the bond program has slowed dramatically under HCFCD’s current leadership.

HCFCD bid only three projects in 2024.
Slow execution has resulted in inflation undermining the bond’s purchasing power. It is unconscionable given the project output under previous HCFCD management. But Ellis doesn’t seem concerned about the slowdown or impact of inflation, either.
In fact, faced with tight Federal deadlines on HUD projects, he gave HCFCD Director Dr. Tina Petersen another 2.5 months to figure out how his equity cuts would affect projects.
Fine Print vs. Voter “Takeaway”
There may be fine print in the bond language that gives Ellis a technical “out” on some of these points. But generally, fine print does not legally excuse advertisers from creating a false or misleading impression. And this bond was heavily advertised.
In advertising law, especially under Federal and Texas consumer-protection laws:
- Overall Impressions Matter:
Courts look at the net impression an advertisement conveys to a reasonable consumer. If the overall impression is misleading, disclaimers buried in fine print generally won’t cure it. - FTC Standards:
The Federal Trade Commission explicitly states that disclosures must be clear and conspicuous. Disclaimers that consumers are unlikely to notice or understand do not meet FTC standards. - Texas Deceptive Trade Practices
If overall impressions mislead consumers, disclaimers hidden in fine print typically won’t absolve liability. The Texas Attorney General’s office has a clear standard: fine print does not cure deception. - Courts Generally Do Not Accept Fine Print as a Shield:
Judges typically base rulings on the takeaway of an average consumer at first glance, not careful study of fine print.
Fine print can clarify net impressions, but it does not excuse deception.
The Ballot Box Cure
On balance, I feel misled. But rather than sue, I plan to use my voice and vote in the upcoming election. That will likely produce results faster than the courts.
Posted by Bob Rehak on 7/5/2025
2867 Days since Hurricane Harvey
The thoughts expressed in this post represent opinions on matters of public concern and safety. They are protected by the First Amendment of the US Constitution and the Anti-SLAPP Statute of the Great State of Texas.