5/31/26 – Harris County Flood Control District’s (HCFCD) SAFER study is now entering Phase 2 of 5. SAFER stands for Solutions for Advancing Floodplain Evaluation and Resilience. It is a long-range planning effort to help Harris County and its communities become more resilient to future flood events.
HCFCD hopes to do that by developing large-scale flood-risk reduction strategies that are:
Eligible for federal funding (65% federal/35% local cost sharing)
Reflect local priorities (engineering, environmental, community)
In Phase 1, HCFCD scoped the study and screened preliminary alternatives.
Phase 2 will evaluate combinations of those alternatives, resulting in a tentative plan.
In the remaining phases, SAFER staff will:
Draft a feasibility report and environmental impact statement
Submit the final report and environmental impact statement to the Army Corps
Coordinate efforts to obtain Congressional authorization.
Study Area Includes 11 of 23 Watersheds
The SAFER study includes 11 of 23 watersheds that cover roughly half of Harris County.
Measures Being Considered for Inclusion in Comprehensive Plan
Staff is looking at alternatives that improve flood-handling capabilities of main-stem bayous and upstream tributaries.
They are integrating solutions across multiple watersheds and comparing traditional solutions, such as channel widening, to more novel solutions for Harris County, such as tunnels. The slide below shows types of measures they are considering.
Phase 2 analysis will answer the following questions.
The next two slides show the type of alternatives being considered in the various watersheds.
The staff hopes to finish evaluating alternatives by the third quarter of 2026. That will involve economic and hydrologic evaluations of each alternative. They then hope to brief the Army Corps on their tentative plan by the end of this year or beginning of next.
Phase 3 (drafting the feasibility report) should start in early 2027.
Observations
This study could someday result in flood-mitigation solutions that make a large portion of the county’s population safer. On the plus side, the SAFER study will result in a comprehensive evaluation of the most cost-effective solutions from a wide range of options.
But on the minus side, it covers less than half the watersheds in the county. The omitted watersheds, such as the San Jacinto, Spring Creek, Luce Bayou and Cedar Bayou are some of the fastest growing areas in the region. Omitting them now will make floodplain preservation and other conservation measures more difficult and expensive later.
HCFCD chose the 11 watersheds because of “existing federal interest, meaning the federal government has authorized work in these specific watersheds at some point.” Their reasoning? That makes those areas “better positioned to receive approval and funding from the Federal government.”
https://i0.wp.com/reduceflooding.com/wp-content/uploads/2026/05/SAFER-Study-Overview_Page_09.jpg?fit=2000%2C1125&ssl=111252000adminadmin2026-05-31 13:30:372026-05-31 13:33:34HCFCD’s SAFER Study Now Evaluating Alternatives for Tentative Plan
1/4/26 – January 5, 2026 is the last day to file public comments on a proposed new definition of Waters of the U.S. (WOTUS). The new definition could eliminate federal protections for roughly 80% of the wetlands in the United States.
A regulatory impact analysis by the U.S. Environmental Protection Agency estimates that approximately 70 – 75 million acres of wetlands would no longer be protected, including approximately three quarters of the 3.1 million acres of wetlands in Texas.
70 – 75 million acres represent an area roughly the size of Arizona, Nevada, or Colorado and almost twice the size of Florida. And it’s more than 175 times larger than Houston.
Under the new definition, only wetlands with a relatively permanent, continuous surface connection to navigable Waters of the U.S. would enjoy federal protection. That pretty much limits federal protection only to swamps that directly border major rivers and streams.
Texas does not have its own regulatory protection program for inland forested wetlands such as those common in the San Jacinto river basin.
How Wetlands Reduce Flooding
Wetlands reduce flood risk by storing, slowing, spreading, and dissipating floodwaters before those waters reach downstream channels, neighborhoods, and infrastructure. They act as natural detention basins, providing temporary storage during heavy rainfalls. They fill first, reducing the volume and rate of water entering streams.
Wetlands also contain dense vegetation that slows runoff, reduces erosion, and minimizes channel scouring downstream.
They spread floods laterally across wide areas. This directly reduces flood heights, velocities and structural damage.
Many wetlands disconnect runoff from channels; they intercept it before it ever reaches streams or bayous. But when developers fill in and pave over wetlands, runoff becomes directly connected. Floods peak higher and faster.
The loss of federal protection for wetlands will shift flood mitigation costs downstream from developers to the public, and from no-cost natural solutions to high-cost engineered solutions, such as regional detention basins, channel widening, lining channels with concrete, bridge widening, dikes, reservoirs, etc.
Flood control districts, reservoir operators, and watershed planners consistently view wetlands as critical flood-risk infrastructure, even when not labeled as such.
Bottom line:
Wetlands reduce flooding by doing four things simultaneously:
Storing water
Slowing flow
Spreading out flood waters
Delaying aggregation of floodwaters.
Lose enough wetlands in a watershed and floods become higher, faster, and more destructive, even if rainfall statistics stay the same.
How You Can Help Save Wetlands
Protest the proposed changes by cutting and pasting the text between the two lines below. Don’t forget to add your name and contact info at the end of the entry form. The deadline for filing a public comment is Monday, January 5, 2025.
Re: the proposed 2025 definition of “Waters of the United States” (WOTUS) as it relates to wetlands the Lake Houston watershed.
This represents one of the most hydraulically and sediment-sensitive locations in Southeast Texas. The wetlands and floodplain features here perform essential functions that directly affect downstream flood risk, sediment transport, and the long-term storage capacity of Lake Houston. Narrowing federal jurisdiction over these wetlands would have costly consequences that the proposal does not adequately analyze.
1. Wetlands upstream function as critical flood-storage infrastructure
Wetlands upstream operate as distributed flood-storage and flow-attenuation systems. During ordinary wet-season events, these wetlands temporarily store runoff, slow overland flow, and desynchronize flood peaks arriving from multiple tributaries. This attenuation function is particularly important at confluences, where coincident peak flows dramatically increase flood stage and velocity.
Loss or fragmentation of these wetlands will not merely redistribute water locally; it will shift flood risk downstream into into the Lake Houston area. Engineered detention required at individual development sites does not replicate this basin-scale function and cannot offset cumulative wetland losses across multiple upstream parcels.
2. Wetland loss directly increases sediment delivery to Lake Houston
The wetlands upstream serve as sediment traps. During flood events, reduced velocities across wetland landscapes allow suspended sediment to settle before reaching the active channel network. This function is especially important for a lake losing storage capacity that supplies water for 2 million people.
When wetlands are filled, drained, or disconnected, sediment that was previously stored on the landscape is instead delivered downstream. The result is accelerated shoaling of channels and increased sediment deposition in Lake Houston, reducing conveyance, increasing flood stages for equivalent flows, and shortening the functional life of public infrastructure.
3. Loss of storage capacity in Lake Houston imposes real and recurring public costs
Sedimentation has already measurably reduced the effective storage and conveyance capacity of Lake Houston. Maintaining that capacity has required repeated large-scale dredging projects costing hundreds of millions of dollars, funded largely by federal and state appropriations.
Upstream wetland loss increases the frequency and scale of these dredging needs. Each acre of wetland lost upstream effectively shifts long-term sediment-management costs from private land conversion decisions to the public. The proposed WOTUS definition does not quantify or even acknowledge this cost transfer.
4. Federal withdrawal from jurisdiction coincides with a pullback in mitigation funding
As federal jurisdiction over wetlands contracts, so too does the availability of federal mitigation and restoration funding that historically offset unavoidable impacts. This includes reduced applicability of Clean Water Act Section 404 mitigation and fewer mitigation-bank credits.
The combined effect is a double loss: fewer protected wetlands and fewer resources to restore or compensate for their loss. This creates a structural funding gap that local governments cannot realistically fill.
5. The proposed definition fails to address cumulative watershed-scale impacts
The proposal’s emphasis on parcel-level “continuous surface connection” tests ignores cumulative impacts across sub-basins. In the Lake Houston area, hundreds of small wetland losses—each individually deemed non-jurisdictional—can collectively produce measurable increases in flood peaks, sediment loads, and public costs.
The agencies should evaluate jurisdiction and impacts at the basin scale rather than relying on binary, site-specific connectivity tests that are not representative of watershed hydrology.
Requested revisions
I respectfully request that the agencies revise the proposed definition to:
Retain federal jurisdiction over wetlands that provide flood-storage and sediment-attenuation functions upstream of relatively permanent waters and reservoirs, even where surface connectivity is seasonal rather than continuous year-round.
Treat wetlands upstream of dams and reservoirs as integral components of the same hydrologic system, rather than as disconnected features.
Evaluate and disclose cumulative impacts to flood risk, sedimentation, reservoir capacity, and public dredging costs resulting from reduced wetland protection.
Address the loss of federal mitigation and restoration funding that accompanies jurisdictional withdrawal and explain how watershed-scale impacts will be managed in its absence.
Absent these changes, the proposed definition risks increasing downstream flood damages, accelerating sedimentation in Lake Houston, and shifting long-term infrastructure costs from private development to the public.
Cut and paste the text between the lines above and submit it to:
https://i0.wp.com/reduceflooding.com/wp-content/uploads/2018/11/Cypress-Swamp.jpg?fit=1100%2C1469&ssl=114691100adminadmin2026-01-04 18:16:122026-01-04 19:50:11Last Day to Save Wetlands
A new definition of “Waters of the U.S.” proposed by the Army Corps and EPA would eliminate the federal brakes on development of upstream wetlands, such as those in the Lake Houston Area and Montgomery County. Time is running out to file a protest letter. Less than a month remains before the close of public comment; the government must receive your letter by January 5, 2026.
I received the Bayou Land Conservancy’s protest letter this morning and am reprinting it here verbatim in case you want to borrow language from it. First, some context.
What’s at Stake?
Wetlands near Lake Houston where Romerica wanted to build a 50-story high rise and now wants to build a luxury resort.Wetlands near confluence of Spring Creek and West Fork being filled by developer
Immediately across the river…
A Dallas-based developer is trying to develop 5300 acres laced with wetlands.Wetlands near Kings Point and Royal Shores on East Fork above Lake Houston
The old definition of “Waters of the U.S.” gave the EPA and Army Corps legal authority to protect wetlands far upstream. Wetlands act as nature’s sponges. They soak up floodwater, reducing downstream impacts. They also clean water, reducing filtration costs. And finally, they provide habitat for wildlife that enriches the human experience.
What’s Changing?
The proposed new definition would stop Army Corps and EPA jurisdiction at the first dam on a river. Anything upstream would no longer enjoy federal protection. Local governments often do not regulate development of wetlands; historically they have relied on the federal government to do that.
The regulatory vacuum created by the change would open up millions of acres to development, especially in fast growing areas like north Houston where flood-prone wetlands are cheap and plentiful. Increases in impervious cover in wetland areas that once retained water will likely increase flood risk for everyone living downstream.
Bayou Land Conservancy Letter
Docket ID No. EPA-HQ-OW-2025-0322
To: Administrator Zeldin, Environmental Protection Agency
Re: Opposition to Updated Definition of Waters of the United States (89 FR 79549, November 20, 2025)
The Bayou Land Conservancy (BLC) submits this comment letter in strong opposition to the updated definition of “Waters of the United States” (WOTUS) proposed by the Environmental Protection Agency (EPA) and the Department of the Army.
About Bayou Land Conservancy and Our Standing
Bayou Land Conservancy is a community-sponsored land trust working to permanently preserve land along streams for flood control, clean water, and wildlife. As an accredited land trust, we are the primary non-profit organization preserving land within the watersheds that feed into Lake Houston, focusing our efforts on northern Harris and Montgomery counties. Since 1996 BLC has permanently preserved more than 15,000 acres of land in southeast Texas.
BLC has direct standing to comment on this proposed rule because we are not merely observers; we are property interest holders and stewards of the very landscapes this rule affects. We hold perpetual conservation easements and own fee-simple land throughout this region. Our legal obligation is to protect the conservation values of these properties in perpetuity.
Because water flows downhill, the integrity of the lands we protect is inextricably linked to the regulatory status of the waters flowing through and above them. If the definition of WOTUS is narrowed to exclude ephemeral streams and adjacent wetlands, the conservation values we are legally bound to uphold, specifically water quality maintenance and flood storage, are put at direct risk by upstream unregulated activity. Therefore, BLC submits these comments as a directly affected stakeholder whose ability to fulfill its non-profit mission is threatened by the proposed reduction in federal jurisdiction.
The Critical Importance of the Lake Houston Watershed
The Lake Houston watershed is not merely an ecological region; it is a vital piece of the Houston-Galveston metropolitan area’s public infrastructure. Lake Houston is the largest single source of surface drinking water for the City of Houston. Protecting the quality and quantity of water flowing into this reservoir is a non-negotiable imperative for public health and economic stability for millions of residents.
Our area is defined by some of the fastest-growing communities in the nation, including The Woodlands, Conroe, Tomball, and Kingwood. This rapid urbanization creates immense pressure on the natural systems, increasing runoff, sedimentation, and pollutant loads. The Clean Water Act applied broadly is essential to mitigate these impacts.
Hydrological Features at Risk
The proposed updated definition, if finalized, risks removing federal protections from essential water features that are demonstrably connected to Lake Houston and its major tributaries. A narrow definition that excludes ephemeral streams or wetlands without a continuous surface connection ignores the scientific reality of our region’s hydrology.
Specific features at risk in our area include:
The San Jacinto River System (West Fork and East Fork):
As the primary artery feeding Lake Houston, the San Jacinto River relies heavily on a vast network of headwater streams. In Montgomery County, many of these headwaters are ephemeral, flowing only after our region’s intense rain events. If these “temporary” streams lose protection, they become prime targets for development-related filling. This would sever the hydrological connection that sustains the river’s base flow and water quality, turning the San Jacinto into little more than a conveyance channel for untreated stormwater.
Spring Creek:
Serving as the natural border between Harris and Montgomery counties, Spring Creek is one of the most pristine waterways remaining in the region. Its sandy banks and associated wetlands act as a massive filtration system. However, the health of Spring Creek is dependent on the lateral connectivity of adjacent wetlands that may not have a “continuous surface connection” year-round. Excluding these adjacent wetlands from WOTUS protection would allow for their destruction, leading to immediate sedimentation of the creek, choking off aquatic life and destroying the recreational value of the Spring Creek Greenway.
Lake Creek:
This major tributary flows into the West Fork of the San Jacinto River and drains a rapidly developing portion of Montgomery County. The watershed is characterized by “flashy” hydrology; it rises and falls quickly. The wetlands surrounding Lake Creek are critical for slowing this water down. Removing protection from the smaller, non-perennial feeders of Lake Creek will eliminate the natural braking system for floodwaters, increasing the velocity and height of flood peaks downstream in densely populated areas.
Palmetto and Bottomland Hardwood Wetlands:
Our region is home to unique forested wetlands that may be separated from the main channel by natural berms or levees. Under a restricted WOTUS definition, these vital flood-storage basins could be deemed “isolated” and paved over. This would result in a direct transfer of flood volume from undeveloped land into the living rooms of downstream residents.
Additionally, three important factors should also be considered in noting BLC’s opposition to this proposal:
Drinking Water Quality
Unprotected upstream wetlands and tributaries will be subject to increased filling, dredging, and chemical/sediment runoff from development, industrial activity, and agriculture. This degradation will lead to a marked decrease in water quality in Lake Houston, requiring exponentially higher treatment costs for the City of Houston and increasing the risk of contamination.
Flood Mitigation
The wetlands and ephemeral stream systems BLC works to protect act as natural sponges, reducing the velocity and volume of stormwater during increasingly frequent high-intensity rain events. Stripping WOTUS protection from these features will allow for their unmitigated destruction, directly exacerbating the already severe and costly flooding issues in northern Harris and Montgomery counties. Protecting these small, non-perennial waters is directly linked to the safety and resilience of downstream communities like Kingwood and Humble.
Conservation Mission
A narrower WOTUS definition undermines the BLC’s mission, and the conservation investments made by public and private partners across the watershed. If the federal backstop of the Clean Water Act is removed from key headwater systems, state and local regulations will be insufficient to protect the water quality and flood storage capacity essential for this rapidly expanding region.
Conclusion and Request
The BLC respectfully urges the EPA and the Department of the Army to reconsider the updated definition of WOTUS and adopt a definition that robustly protects the waters of the United States, including all tributaries and adjacent wetlands that have a significant nexus to navigable waters. For the Lake Houston watershed, a narrow interpretation of WOTUS threatens the largest source of drinking water for the City of Houston, jeopardizes our communities’ flood resilience, and contravenes the fundamental goals of the Clean Water Act.
We urge the agencies to maintain comprehensive jurisdiction over all features that provide filtration and flood control benefits to downstream communities and critical public drinking water sources. Sincerely,
Signed,
Jill Boullion
Executive Director
Bayou Land Conservancy
Please Help
Every voice counts. Make sure the government hears yours. Please compose a letter protesting the proposed changes to the definition of “Waters of the U.S.” This post that I wrote in November contains more background on the issue.
Please feel free to write your own comment or adapt language from the letter above. But do it NOW. And get your friends and neighbors to do it too! Perhaps nothing you can personally do will have a greater impact on your safety and the safety of your home or business in the next flood.
If this proposed definition is adopted as is, it will make it easier for developers like the one I posted about yesterday to fill in wetlands near rivers and streams.
Posted by Bob Rehak on 12/10/2025
3025 Days since Hurricane Harvey
https://i0.wp.com/reduceflooding.com/wp-content/uploads/2025/04/20250411-Swamp-area-with-6-to-12-inch-deep-water-a-week-after-a-rain.jpg?fit=1100%2C716&ssl=17161100adminadmin2025-12-10 15:39:222025-12-10 15:50:03BLC Letter Protests Redefinition of “Waters of the U.S.”
Bayou Land Conservancy (BLC) has announced a conservation easement on 966 acres of critical Lake Creek property in Montgomery County. The property is just northeast of Magnolia on Tranquility Ranch, which is owned by Nathan and Lindy Ingram. BLC started working with the Ingrams in 2015.
The conservation easement is across Lake Creek from the 7,000-acre Cook’s Branch preserve owned by the Cynthia & George Mitchell Foundation. The proximity of the two large properties will benefit wildlife by maintaining the “carrying capacity” of the land.
Lake Creek flows diagonally through this satellite image from Google Earth. Note how new developments are gobbling up the natural (green) area in the middle where the conservation easement is.
The 966 acres permanently preserved at Tranquility Ranch help meet BLC’s long-term conservation goals and contribute to the environmental health of the region.
The preserve will function as a wetland and stream mitigation bank, known as the West Montgomery Mitigation Bank. It has credits available to developers seeking to offset impacts in this rapidly growing area.
Wild area along Lake Creek where it flows through Tranquility Ranch.
Featuring a mix of hardwood and pine forest, Tranquility Ranch consists of over 400 acres of existing wetland habitat, 20 acres of streams & ponds, and 13,000 linear feet (2.5 miles) of stream frontage on Lake Creek.
In addition to high quality existing habitat, over 90 acres of wetlands and 300 acres of flooded forests will be improved and restored on the land.
Bottomland hardwoods provide habitat for wildlife.
The 966-acre preserve is part of a larger 1200-acre property that hosts a special event venue called The Wyldes at Tranquility Ranch. It hosts retreats, weddings, and other events.
Benefits to People and Wildlife
Jill Boullion, Executive Director of Bayou Land Conservancy, said, “This conservation agreement makes a significant stride towards BLC’s conservation goals to preserve land in the Lake Houston watershed.”
“We’re grateful to landowner Nathan Ingram and his care and protection of this special place,” said Boullion.
“This land will provide positive impacts in the region for generations to come.”
Jill Boullion, Exec. Director, BLC
Preservation of Tranquility Ranch will provide many community benefits. They include flood control, water-quality improvements for drinking water and recreation, and wildlife habitat. The preserve also is an important nesting, wintering, and migratory stop-over site for many bird species, including owls, raptors, and songbirds.
Importance of Lake Creek Preservation to Downstream Flood Protection
Leaving natural areas natural won’t reduce flooding per se. But it will keep flooding from getting worse.
It will also reduce flood damage by ensuring generous setbacks from areas that flood.
Wetlands are nature’s sponges. They retain runoff that might otherwise quickly add to flood peaks downstream. They also clean water.
Bayou City Waterkeeper ranks the wetlands along Lake Creek as one of the five most critical wetland areas in the Houston Region.
For those who may not know where Lake Creek is, it enters the San Jacinto West Fork just south of Conroe, about 9 miles south of the Lake Conroe Dam. See the big green area in the upper left.
From this map, we can see that rainfall from seven watersheds flows under the US59 bridge. Comparing peak flow data from them during the January 2024 flood, we can see that Lake Creek had the highest discharge rate. See below. USGS graphs are arranged in order from highest to lowest, except for the last, which reflects rain falling in all seven watersheds.
Lake Creek peaked at 20,800 cubic feet per second (CFS)Lake Conroe peaked at 19,100 CFS.Spring Creek peaked at 9,810 CFS.Cypress Creek peaked at 6,580 CFS.Willow Creek peaked at 842 CFS.Little Cypress peaked at 780 CFS.
All of the streams above flow under the US59 bridge.
USGS registered a peak of 40,400 cubic feet per secondat the 59 Bridge.
Note: the first six peaks do not total up to the last because streams peaked at different times.
Of course, these numbers partially reflect uneven rainfall distribution during the January event. And rainfall totals in the Lake Creek watershed were among the highest in the area.
Looking solely at watershed size shows that even if the rainfall distribution had been uniform, Lake Creek would have contributed a major percentage of the overall flow.
And that – in a sentence – is why Lake Houston Area residents should care about conservation along Lake Creek, especially considering that the watershed is developing so quickly!
Conservation Easement Will Protect Land in Perpetuity
BLC conducted an extensive audit of natural resources including wetlands and wildlife on the Ingram property before the conservation agreement was put in place. No matter who the owner is, the easement will run with the land and protect the land in perpetuity. The audit will provide a baseline for future comparison.
Ingram reportedly had offers to buy the land from sand miners and developers but chose to conserve it instead. Said Boullion, “I commend him because obviously it’s not cheap to own and hold that much land in a natural state. So, he looked for a way to monetize his property while conserving the land and benefiting the community. He is one of the most conservation-minded people I know.”
The conservation easement held by BLC will let Ingram sell wetland-mitigation credits through the West Montgomery Mitigation Bank. He will sell them to developers who have no other choice but to disturb wetlands while developing the rest of their property.
BLC is one of the leading conservation groups in the Houston region. It preserves land along streams for flood control, clean water, and wildlife. BLC is a nationally accredited, community-sponsored land preservation organization working to permanently protect land, with a focus on the streams that feed Lake Houston, an important source of drinking water for millions of people.
Posted by Bob Rehak on 2/25/24
2361 Days since Hurricane Harvey
https://i0.wp.com/reduceflooding.com/wp-content/uploads/2024/02/20230919-Tranquility-Ranch-Sign-2.jpg?fit=1100%2C825&ssl=18251100adminadmin2024-02-15 16:08:152024-02-16 10:25:47Bayou Land Conservancy Protects Another 966 Acres in Lake Creek Watershed
On 12/13/23, Texas General Land Office (GLO) Commissioner Dawn Buckingham, M.D. announced the approval of Coastal Erosion Planning & Response Act (CEPRA) funding for a Bolivar Peninsula Beach and Dune Restoration project.
The beach-restoration project seeks to:
Restore additional essential beach and dune systems
Provide crucial protection for Highway 87, Bolivar Peninsula’s only hurricane evacuation route
According to the GLO, the CEPRA funds – initially aimed at an engineering study – will provide both economic and coastal resilience benefits.
Part of SH 87 Already Washed Away
Highway 87 once had a stretch between Sea Rim State Park and High Island that washed out repeatedly over the decades. TXDoT closed it permanently in 1990. Today, eastbound SH 87 stops at High Island. Evacuees must then turn north on SH 124 toward I-10.
The stretch being protected provides the only remaining land-based evacuation route for the 2,800 residents of the Bolivar Peninsula. Seventeen people died there on September 13, 2008, during Hurricane Ike.
The scope of this project: to develop focused beach nourishment engineering design specifications for a U.S. Army Corps permit. Beach nourishment will alleviate tidal impacts threatening SH 87’s eastern terminus on Bolivar Peninsula near High Island.
Satellite Image Sequence Shows Severity of Shoreline Erosion
This series of Google Earth images shows how shoreline erosion now has waves lapping at the shoulder of the highway in this area.
State Highway 87 near High Island in 1974. Note dunes between highway and broad beach.Same area immediately after Ike. Note erosion of beach and deposition inland from SH87.Same area in 2023. Note continued erosion of beach toward highway.Enlargement of nearby stretch shows high tide lapping at riprap which maintenance crews are replenishing (2023).
The beach nourishment engineering design specifications under this project are focused on an approximately four miles of the Bolivar Gulf-facing shoreline beginning at the Galveston-Chambers County line and extending west toward Gilchrist. This is where tides come closest to Hwy. 87 on a recurring basis.
Improving Resilience
“Ultimate benefits from this beach nourishment design work would include protection of the peninsula’s only hurricane evacuation route,” said a GLO spokesperson.
The CEPRA Program helps communities across the Texas coast implement erosion response projects and related studies to understand and reduce coastal erosion as it threatens public beaches, natural resources, coastal development, public infrastructure, and public and private property.
The Bolivar Peninsula Special Utility District, Bolivar Peninsula Chamber of Commerce, Galveston County Road Administrator Lee Crowder, Galveston County Judge Mark Henry, and Galveston County Precinct 2 Commissioner Joe Giusti played pivotal roles in securing this funding.
Nature-Based Solutions Help Protect People and Wildlife
Commissioner Buckingham said, “As a Texan who grew up near the coast and lived on Galveston Island for more than a decade, preserving our state’s precious shorelines and their communities is a top priority.”
FEMA has found that such nature-based solutions increase quality of life for both humans and wildlife. And make no mistake. This is an important wintering and nesting area for many species of wildfowl that depend on the wetlands in this area.
Snow geese flocking near High Island in December 2008, shortly after Ike.
Homebuyers beware. Flood risk is a shifting target.
This morning, I began reading more than 100 pages of legal briefs in the appeal of the upstream Addicks and Barker awards. I could not help but think how hundreds of millions of dollars in losses and untold heartbreak could have been averted with more due diligence on the part of all involved – buyers, developers and the Army Corps.
Background of Case
For those new to the area, Addicks and Barker are two reservoirs on Houston’s west side. The Army Corps built them back in the 1930s to protect downtown Houston and the ship channel. However, the Corps did not buy all the land inside the reservoirs that was subject to flooding. Later, developers started building on that land. And people bought the homes despite the risks.
During Harvey, hundreds of homes built inside the reservoirs flooded. Residents sued the Corps and won. But the Corps is now appealing the case.
In 2022, a judge ruled in favor of the residents and awarded them more than half a billion in damages. The damages included repair costs, replacement of belongings, and compensation for value lost in their property. But facing hundreds of millions of dollars in payouts, the government isn’t giving up easily. It appealed.
The case has taken more than six years to get to this point and it is far from over. No telling what the legal fees have cost both sides. Or whether plaintiffs will ever see a penny.
This should serve as a lesson to everyone buying a home and to their real estate agents, mortgage lenders, and surveyors.
Tools to Help You Avoid Becoming a Flood Victim
Although tools to identify flood risk may not have been commonly available and readily understandable when the plaintiffs bought homes inside the reservoirs, such tools do exist now.
They both show the extent of potential flooding in this area, but each has different strengths. And they show slightly different results. That should raise some cautions if you think of risk as a black-or-white issue.
Use USGS National Map for Elevations, Slopes, Contours
You can layer these maps and vary their transparency. But the real magic of the USGS National Map is in the measurement tool for elevation profiling. Below is an example.
After activating the elevation profile tool, I drew a line from a residential neighborhood inside the Barker Reservoir, across the dam, to an area outside the reservoir. I chose an area in the southwest corner of the reservoir that flooded during Harvey. It showed this.
Note elevation changes on right where line crosses the dam (gray bar). Homes above the gray are inside reservoir.
The red X shows the height of the dam (108 feet) in the elevation profile. The brown area in the elevation-profile box shows the elevation of the dam, homes, streets and drainage channels.
Homes are generally 6-8 feet BELOW the height of the dam. That should be a giant red flag for anyone considering buying a house inside the reservoir.
Next, zooming out, I turned on the hydro layer. The red circle below, indicated the approximate area and location of the map above.
Note how the flood pool of the reservoir extends beyond the entire neighborhood shown above.
FEMA National Flood Hazard Layer Viewer for Floodplain Information
FEMA actually uses the elevation information from the USGS national map. But FEMA superimposes floodplains to show flood risk in several zones.
Note difference in two maps above in their bottom left corners. FEMA shows some homes inside the reservoir that are outside of mapped flood zones. Aqua = 100-year and tan = 500-year floodplains.
The difference noted above raises an important point. FEMA’s maps are estimates of the probability of unknown future events based on the frequency of extremely rare past events. Those estimates may not have been in effect when the neighborhood in question was built around the time of Tropical Storm Allison in 2001. Maps based on Allison weren’t adopted until around 2007 and are still in effect today.
Harris County Flood Control and FEMA update flood maps periodically when new monster storms come along and surpass past rainfall probability estimates. For instance, FEMA is working on new flood maps based on Harvey, but has not yet released them.
So, if you’re thinking of betting your life savings on a home in a risky area, the best things to do are these:
Ask yourself, “Can I afford to lose everything?” Many families in the reservoirs did.
Consult an independent engineer without any financial incentive in the purchase, i.e., making the deal go though.
Evaluate a variety of homes, not just one. And look closely at the safety margins.
If a home is two feet above the 100-year floodplain, look for one that’s higher. Things change regularly, usually in one direction.
Make “flood avoidance” more important than kitchen appliances in your purchase decision.
A Cautionary Tale Based on Personal Experience
Back in the early 1980s, I owned a house in Dallas near a creek that an engineer and the city certified were 2-feet above the 100-year floodplain. The home flooded within two years, due to rapid, insufficiently mitigated growth upstream.
Several years later, when I bought a house in Kingwood, I looked at ten homes and bought the one on the highest ground. More than 30 years later, all nine of the others flooded during Harvey even though they were all reportedly above the 100-year flood plain.
For a thorough description of why flood risk is a moving target, read this post – Why Do We Flood?
After two years of drought, it’s easy to become complacent about flood risk. Don’t. Ask anyone who has flooded. They will tell you. Your life can change overnight. So homebuyers beware.
Posted by Bob Rehak on 10/21/2023
2244 Days since Hurricane Harvey
https://i0.wp.com/reduceflooding.com/wp-content/uploads/2023/10/Barker-Hydro.jpg?fit=1200%2C842&ssl=18421200adminadmin2023-10-21 18:33:462023-10-21 18:57:57Homebuyers Beware: Flood Risk is Shifting Target
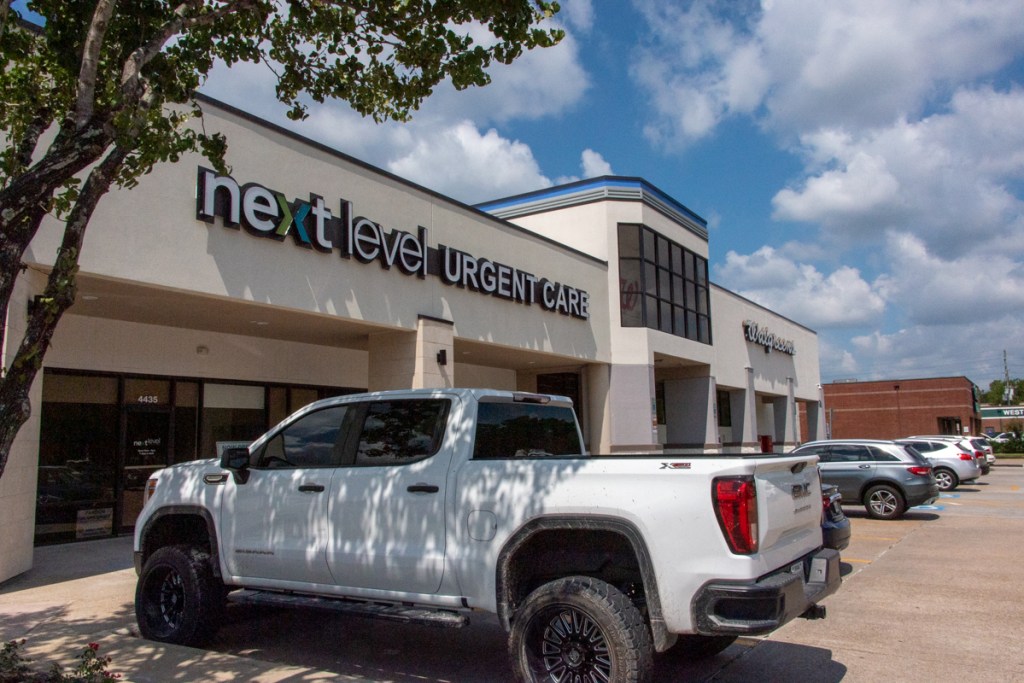
Hurricane Harvey flooded 100 percent of all the businesses in Kingwood Town Center. Recovery has been a long, hard road. Some retailers threw in the towel. Others hung on by their nails. The shopping center on the northwest side of Kingwood Drive and West Lake Houston Parkway was one of the hardest hit – caught between rising waters from Lake Houston and descending waters from Bens Branch. For several years, the entire center looked like a ghost town.
City of Houston crews remove sediment from under Kingwood Drive Bridge over Bens Branch by shopping center.
The remediation efforts seem to have bolstered confidence and encouraged the return of retailers.
Pardon Their Dust
For the last two years, loyal customers had to dodge construction as the shopping center got a facelift. But last month, the construction trailer and fencing disappeared. Today, I counted only four vacancies in the main part of the shopping center. And workmen are busy doing interior buildout on some of those.
Ghost-Town Look Gone
The ghost-town look is gone…replaced by pristine exteriors, new signage, and fresh landscaping. It will only be a matter of time before the remaining spaces refill.
Here’s how the center looks today.
A new Trek bicycle store recently opened, and makes a nice complement to other retailers. Around the corner, a fresh new look for the urgent care center and Walgreens.
Still Searching for Anchor Tenant…
Unfortunately, the center still lacks an anchor tenant.
The leasing agent, NewQuest, is rumored to have been in discussions with a large fitness center to occupy that space or part of it. This morning, I saw electricians entering the space to work. But NewQuest did not return a phone call to confirm or deny a deal with a new tenant. NewQuest’s website still shows the space officially for lease.
…But Appraised Value Quadruples Since Harvey
Regardless, you can see another sign of the shopping center’s success on the Harris County Appraisal District website. The appraised value of the center has more than quadrupled since those bleak days after Harvey.
Five-year appraised value history from HCAD.orgas of 9/8/22.Screen capture from HCAD.org as of 9/8/22.
Welcome Back, Retailers!
If you avoided this center during construction, explore what all the small business owners have to offer.
Posted by Bob Rehak on 9/8/2022
1836 Days since Hurricane Harvey
https://i0.wp.com/reduceflooding.com/wp-content/uploads/2022/09/20220908-RJR_0963.jpg?fit=1200%2C800&ssl=18001200adminadmin2022-09-08 15:17:032022-09-08 17:09:21Major Kingwood Shopping Center Almost Back
When Harris County Flood Control District (HCFCD) and the Army Corps began Project Hunting (the Hunting Bayou Federal Flood Risk Management Project) in 2014, they estimated it would cost $100 million and take until late this year.
A flyover of the construction along Hunting Bayou looks like it is nearing completion…right on schedule. It will soon be done, except for the backslapping. Compare the shots below to those I took last year.
Hunting Bayou runs just inside North Loop 610 most of the way from US59 to Wayside. However, starting at Wayside, it dips outside the Loop, then goes back inside again, and finally outside a second time. Eventually, the Bayou works its way to the Houston Ship Channel near the City of Galena Park.
Scope of Project
Project elements include:
Excavating a stormwater detention basin on a 75-acre site near the northeast corner of Homestead Road and Loop 610
Widening and deepening about 4 miles of Hunting Bayou
9 bridge replacements / 8 modifications and channel conveyance improvements under bridges
Project Benefits
HCFCD says that most neighborhoods near the bayou will see water surface elevation reductions of 3-4 feet for the 1 percent annual chance (100-year) flooding event. The number of homes and businesses subject to the 1 percent (100-year) flooding event would drop from 5,100 to 650. And all homes and businesses will benefit from the reduced frequency and depth of flooding.
Need for Project
The Hunting Bayou watershed has Harris County’s second highest percentage of Low-to-Moderate Income (LMI) residents – 69%. That means more than two out of every three people earn less than the average income for the region.
Hunting is a small watershed. It comprises only 31 square miles. Its size ranks 19th out of 23 watersheds in the county.
Population grew only by 2,323 residents between 2010 and 2020. It went from 75,908 to 78,231. That now ranks it 14th in population among all watersheds, and 8th highest in people per square mile.
In five major storms between 2000 and today (Allison, Tax Day, Memorial Day, Harvey and Imelda), floods damaged 15,763 structures in the watershed. But virtually all of that damage came from Allison (8,270) and Harvey (7,419). The other three storms combined damaged only 74 structures, according to statistics compiled from HCFCD Federal Reports.
Thus, Hunting ranked 7th in total damage out of 23 watersheds, but because of its small size and high density, it had 508.5 structures per square mile damaged by floods since 2000. That means…
Hunting ranked #2 out of 23 watersheds in damage per square mile.
Data Obtained from HCFCD Via foia request
The watershed is highly urbanized with a mixture of residential, commercial and industrial developments. It’s home to one of the largest rail yards in the Houston area.
Union Pacific Englewood Yard in NE Houston along Liberty Road (right). HCFCD had to replace three railroad bridges over Hunting Bayou as part of the project.
Aerial Survey Shows Mitigation Construction Almost Complete
On Tuesday this week, I flew over Hunting Bayou with Ken Williams and Bill Callegari. Both are fellow members of the Harris County Community Flood Resilience Task Force. The pictures below show highlights of the construction.
Looking west at Hunting Bayou while hovering over US59 North. The widening of Hunting stretches downstream for about 4 miles to where Loop 610 North (on the left) turns right and heads south.Same area. Looking SW toward 59 and downtown. Notice the rip rap (irregular chunks of broken concrete or rock) below storm sewer outlets. It disperses the force of rushing water and slows it down to reduce erosion.Work continues around two neighborhood bridges at Falls St. and Leffingwell St.Likewise, widening continues at Hirsch Road.Looking back upstream at all three bridges, plus a pedestrian bridge over a small tributary in the distance.Wider shot, looking upstream over Wayne Street.Previously finished section around Wipprecht bridge.Note how bayou narrows under Lockwood Bridge due to commercial development on either side.Looking back upstream (west) from over Kelly St. at linear park that parallels another large detention basin.Note the new pedestrian bridges.They have been widened to accommodate the wider bayou.Rotating 180 degrees from shot above, we can see downstream to rest of park and where the Bayou threads its way under Loop 610N. Also note large detention basin in distance.Looking back SW from over Kelley Street. Note concrete lining that now protects narrow section under 610 bridge.Looking SW toward Homestead Road (with the bridge) across the new 75 acre stormwater detention basin.
The Curtis M. Graves Detention Basin shown above provides approximately 1,000 acre-feet of stormwater storage capacity. That’s almost 10 inches of rain falling over a square mile. Construction of the basin began in 2020.
Looking west along 610 N at the section of Hunting that briefly dips outside of the Loop.Looking NW. Note again the new concrete lining where the channel narrows to go under the Loop 610 N bridge. Water flows toward the camera.
Compare Bayou Downstream From Project
Where the bayou narrows to go under a bridge, the increased water pressure during a flood can cause a “jetting” phenomenon that rapidly erodes banks and undermines bridge supports. Hence, the need for concrete reinforcement.
Looking S along East Loop 610 beyond the eastern end of the project. The Bayou loops around storage tanks (lower right) and heads south toward Wallisville Road, before heading east again. This shows what the bayou looked like before widening.Compare width to previous shots.
The tank farm is the approximate eastern limit of Project Hunting.
Project History
This project began on December 16, 2014, long before Harris County’s Flood Bond in 2018. It was a key project of County Commissioner El Franco Lee (who lived in the area) and Congressman Gene Green. Despite a low benefit/cost ratio, they called in favors and got the project started.
The agreement between the Army Corps and HCFCD lets HCFCD qualify for reimbursement from the Federal government for work completed.
Between the channel widening and detention basin, HCFCD has removed almost a million cubic yards of soil to create more room for floodwaters. Width of the Bayou now varies from about 30 to more than 500 feet between the project limits.
According to data obtained via a FOIA Request, HCFCD and its partners spent $96 million on Hunting Bayou between 2000 and the end of last year. Some of that money has been spent on other projects. To see a complete list of HCFCD projects in Hunting Bayou, visit the District’s Hunting page.
Since 2000, Harris County Flood Control District (HCFCD) and its partners have spent more than a half billion dollars to reduce flooding in the White Oak Bayou watershed. And they aren’t done yet. Before the flood bond is complete, they will have spent at least $575 million to create detention basins, widen channels and make other improvements.
On 7/19/2022, I flew up White Oak Bayou in a helicopter with Bill Calligari and Ken Williams, two fellow members from the Harris County Community Flood Resilience Task Force. Our goal: to learn what the money bought.
This is the second of four posts. The first covered Greens Bayou. The next two will cover Hunting and Halls Bayous.
White Oak Bayou by the Numbers
White Oak Bayou is Harris County’s sixth largest watershed but its third most populous. 51% of its residents qualify as Low-to-Moderate Income (LMI). It’s our fourth most densely populated watershed (people/square mile). Not surprisingly it had the third most damage in 5 major storms since 2000 (Allison, Tax Day, Memorial Day, Harvey, Imelda). The storms damaged 25,739 structures. Look at some of the photos below of structures crowding the bayou and you will understand why.
White Oak Bayou from the Air
White Oak Bayou flows southeast from its headwaters northwest of FM 1960 to its confluence with Buffalo Bayou near downtown Houston. The watershed comprises 111 square miles, with 146 miles of open streams. They include:
White Oak Bayou
Little White Oak Bayou
Brickhouse Gully
Cole Creek
Vogel Creek
Our helicopter started the White Oak leg of our flight near the Heights north of downtown. From there, we flew upstream. This is what the Heights looks like from the air – a study in population density which correlates highly with flood damage.
White Oak drains most of the Heights. Note the density of development. In 2010, the watershed census was 433,250. But by 2020, it had increased to 464,933.
Looking south toward downtown from over Ella and TC Jester. Most of this segment of the bayou was finished years ago and requires only repairs now.Looking W, upstream from over West 34th and TC Jester.
HCFCD now maintains White Oak and has observed a number of locations where concrete is approaching the end of its useful life.
Looking upstream from over Garapan Street just north of Tidwell at bank and concrete repairs.(Arbor Oaks buyout area is in upper right. See end of post.)
Some projects are still being studied. Some are complete or nearly so. As of June 8, 2022, HCFCD was working out a contractor issue on the largest project, which will delay the originally scheduled completion this summer.
Federal Flood Damage Reduction Project
The largest project is the White Oak Bayou Federal Flood Damage Reduction Project. This $124 million project will substantially reduce flooding risks along White Oak Bayou. It started in 1998 in partnership with the U.S. Army Corps of Engineers, with the Flood Control District designated as the lead. The two segments of the project are fully funded to completion.
Upstream segment of Federal Project.
Limits of downstream segment of Federal Project
They include:
Construction of approximately 15.4 miles of channel conveyance improvements along the bayou from FM 1960 to Cole Creek near West Tidwell in the two segments above.
Excavation of six stormwater detention basins to hold almost one billion gallons of stormwater. That’s enough to hold a foot of rain falling across almost 5 square miles.
Construction of the Jersey Village Bypass Channel
Stretch of improvements upstream from Alabonson Road.
Upon completion, HCFCD estimates that most parts of the project area will see water surface elevation reductions of 0.1 to 1.8 feet for a 1 percent annual chance (100-year) flooding event.
HCFCD
Looking S.White Oak Bayou Detention Basin near West Little York and Hollister.Looking S toward White Oak Bayou near Fairbanks North Houston Rd. Basin completed in 2021A smaller detention basin opposite the one above skirts the south side of White Oak at Fairbanks North Houston (bottom right).Channel improvements and greenbelt trail still under construction.Looking west at White Oak where it crosses under Beltway 8. Note bridge improvements and vegetated detention ponds on left on both sides of bayou.
Many smaller detention ponds like those above now line both sides of the bayou and its tributaries from upstream to down.
Arbor Oaks Subdivision Buyout
Since 2003, HCFCD has bought out more than 200 homes in the Arbor Oaks subdivision. It is still buying more on either side of Vogel Creek to build a 431 acre-foot stormwater detention basin and restore the floodplain. That would hold a foot of rain falling over 2/3rds of a square mile.
Acquisition costs in such densely populated neighborhoods can easily exceed construction costs.
This part of the White Oak story dramatizes how costly, difficult and time-consuming it can be to buy out and mitigate areas built in floodplains.
Note the large areas with streets marked, but few or no homes on them. They were bought out and this area will become another large detention basin. Image courtesy of Apple Maps.
Here’s what part of it looks like from a few hundred feet up.
Lower part of Arbor Oaks area on bottom left.Bridge is on West Little York. Looking SE toward downtown.Looking SE at floodplain south of Little York near Arbor Oaks. Note aging concrete along White Oak Bayou on right.
And then there’s the North Canal near downtown. HCFCD and the City of Houston are working to finalize an interlocal agreement. Grant funding calls for completion of the first phase of the project by May 2023.
They all add up to more than a half billion dollars…and counting! Water needs somewhere to go during a storm. If we don’t leave a floodplain for floodwaters to safely expand, they will wind up in peoples’ living rooms.
Posted by Bob Rehak on 7/20/2022
1786 Days since Hurricane Harvey
https://i0.wp.com/reduceflooding.com/wp-content/uploads/2022/07/20220719-RJR_9908.jpg?fit=1200%2C800&ssl=18001200adminadmin2022-07-20 20:54:042022-08-29 14:45:27White Oak Bayou: What A Half Billion Dollars Looks Like
In the last few weeks, Michael Bloom, a fellow member of the Harris County Community Flood Resilience Task Force, and I have debated the inherent bias and limitations of a Flood-Mitigation Benefit Index (FMBI) proposed by a majority of the Task Force to Harris County Commissioners Court.
According to Mr. Bloom, the index will:
Reveal and document patterns of historical discrimination.
Help plan where additional flood-risk reduction investments should be made.
Population-Based, Not Damage-Based Mitigation
The formula is:
Benefit = Total Cost/(Population X Risk)
…where:
Cost = total flood-mitigation construction spending (and only construction spending) that benefits a census tract.
Population = the number of people who live in census tracts.
Risk = the annual chance of flooding (applied to census tract(s)) expressed as a whole number. For instance, a 1% annual chance equals 1. And a 10% annual chance equals 10, etc.
The Task Force hopes to calculate and compare the results for each census tract in the county.
The formula measures the historical per capita flood-mitigation costs supposedly associated with the “current” level of risk in a census tract – NOT historical flood damage.
According to proponents, “a high benefit score means no more mitigation spending is needed. And a low score means more spending is needed.”
But consider these two examples:
4,000 people live with a 1% annual chance of flooding and have received $200 in prior investment. Their FMBI would be 0.05. That’s extremely low. And scores that low indicate such areas need help “regardless of prior investment.”
8000 people live in the 10-year flood plain and have received $10 million in prior investment. Their FMBI equals 125. That’s 2,500 times higher.
According to a spokesperson for the FMBI, “A high FMBI means we don’t need to make more investments in that location.” Yet twice as many people live with ten times the risk in the area with the higher index.
So, who deserves the most help? Residents with the lowest FMBI? The formulaSAYS they need help the most. But they actually have the lowest risk.
The Value of Market Testing
None of the hypothetical examples used to “sell” the formula hint at the possibility of such an upside-down result.
The example above proves several things:
The formula can produce inconsistent and misleading results.
Adjusting for population doesn’t prove historical discrimination. The most densely populated area has 50,000 times more investment.
The formula needs rigorous testing and ground-truthing before going any further. This is a best practice for any new scientific formula – especially one intended to guide future investment.
In addition to producing unintended results, the formula has several other problems that require discussion.
No Right-Of-Way Acquisition Costs Included
The FMBI formula includes only construction costs. It excludes right-of-way acquisition costs by assuming that they are “uniform throughout the county.” Therefore, “…costs included or excluded will not adversely impact results.”
In fact, Right-of-Way (ROW) Acquisition costs are huge and NOT UNIFORM throughout the county. I have documented that ROW costs typically comprise the second most expensive part of flood-control projects.
All Flood Control and partner spending on all capital improvement projects from 1/1/2000 through the end of Q3 2021.Data obtained via FOIA Request from HCFCD.
A quick glance at the Appraisal District website will tell you that land costs vary widely throughout Harris County and change over time.
The cost of buying floodplain land or wetlands for preservation in rural parts of Harris County pales in comparison to land acquisition costs in densely populated parts of the county.
In fact, acquiring land in densely populated areas for flood mitigation often costs more than construction, according to several engineers I consulted.
Compounding Problems?
I worry that other methodological issues may compound each other, not cancel each other out.
Map of Census tracts in Harris County, Texas.
Consider that:
Census tract population typically varies by up to 4X (2,000 to 8,000), according to the Census Bureau. This will produce deceptive spatial comparisons.
Some Census tracts may comprise dozens of square miles while others comprise a few city blocks. Typically, flood mitigation projects are not considered at the Census-tract level. According to three engineers I consulted, that’s too small in most cases to be workable.
Larger Census tracts may contain multiple watersheds, each with independent levels of risk – or individual watersheds with varying levels of risk. In such cases, the formula would average risk. But averaging can mask a serious problem in one area with a non-problem in another. Thus, the formula has a bias in favor of spatially smaller Census tracts. Smaller tracts tend to be more uniform in risk, so problems will likely stand out rather than get lost in an average. But in larger watersheds, flood risk will feather out with increased elevation and distance from a river. That will make it extremely difficult to calculate the number of people exposed to varying degrees of risk. Averaging takes the simple way out. But averaging risk is like comparing saints and sinners, then declaring “No problem.”
The data collection effort for the index omitsmany sources of funding. So the formula will calculate investment dollars from some entities and areas, but not others. For instance, the formula will NOT measure drainage funding from Harris County Commissioner Precincts, dozens of cities, and 389 municipal utility districts in unincorporated areas. The difficulty of data collection in these areas will produce another spatial bias. Likewise, the FMBI formula will omit the considerable drainage-improvement contributions of reputable private developers.
No one has tested how these inconsistencies will affect each other. But there’s an even bigger data integrity issue.
Partially Updated Data
HCFCD and its partners invested more than $1.5 billion in flood mitigation between Harvey and the end of 2021. Since 2000, they’ve invested more than $3.5 billion. But as of this writing, new MAAPnext flood maps only reflect the POST-mitigation risk associated with projects in FIVE bayous: Brays, Greens, White Oak, Sims, and Hunting. The Army Corps partnered with HCFCD in those.
Unfortunately, according to a knowledgeable source, HCFCD has not yet updated the risk maps for its own Capital Improvement Projects in other watersheds. So if you ran the allocation formula now, it would compare PRE-mitigation risk in 18 watersheds with POST-mitigation risk in 5.
Mitigation in those five watersheds totals $439 million out of $1.5 billion since Harvey. So true, current risk is reflected in only 29% of spending since Harvey and 13% in this century. Those percentages will no doubt increase in the future. But if you ran the numbers today, you would compare numbers with PRE- and POST-mitigation risk.
And consider this. With HCFCD spending at the current rate of about $80 million per quarter, “current risk” is a constantly changing target. So we’ll never be able to compare apples to apples in all watersheds anytime soon.
And we want to use this formula to guide future mitigation spending? Using it could send more money back to fix areas we already fixed!
Difficulty of Assigning Investments to Census Tracts
Another challenge: How do you determine which census tract(s) to apportion project benefits among? Example: Addicks and Barker Reservoirs. The Army Corps developed those back in the 1930s to protect downtown Houston…15-20 miles away!
Do you credit the investment to:
All of downtown?
People living inside the reservoirs (who have their own census tract)?
The current population of the entire Addicks and Barker Watersheds?
All census tracts along Buffalo Bayou and parts of White Oak Bayou, our second and third most populous watersheds?
And virtually all residents of the Addicks and Barker watersheds live upstream from the Corps’ investment, so they will not benefit from the investment either.
Downtown has immense commercial and economic value but relatively few permanent residents.
So, who gets the benefit? Again, lots of room for interpretation and misplaced assumptions here that numbers can easily mask! Now, multiply this problem times thousands of Census tracts.
Anti-Commercial Bias
The population-based FMBI has a built-in bias against commercial areas that have little to no residential population. For example, consider the cases of Downtown, the Texas Medical Center, and the Port of Houston. Such areas support employment throughout the region, but the formula discriminates against them by giving huge weight to population and omitting actual damage.
No Thresholds Defined
To my knowledge, the task force has never discussed threshhold “benefit” levels that correlate to “needs help” or “doesn’t need help.” The extremes may sometimes be easy to determine. But what about outcomes in the middle?
Offsetting Variables
Variables in the formula can offset each other as we saw above. In tight races for funding, who gets the next flood-mitigation investment? The area with the lowest investment, highest risk, or largest population? Such quandaries have not yet been addressed.
No Agreement on Weights of Other Factors
To help make future flood-mitigation decisions, proponents of the formula also suggest weighing (separately) other factors, such as the CDC’s Social Vulnerability Index. It includes the percentage of Low-to-Moderate residents in an area. However, no one has yet discussed the weight given the Benefit Index relative to other factors.
No Consideration of Actual Flood Damage
In deciding where to put flood mitigation projects, engineers traditionally look for damage clusters. It’s that simple. Dollars flow to damage.
Reducing flood damage is a tried and true, measurable way to evaluate projects. So why all the complexity?
What’s The Point?
What is this formula trying to prove? Is it attempting to develop a new approach to mitigation funding that eliminates a perceived bias in Benefit/Cost Ratios?
Commissioner Rodney Ellis often talks about how calculating the value of avoided damages in higher value homes disadvantages projects in poorer neighborhoods. That can be true in some instances. Expensive homes can ratchet up benefits (measured in dollars) faster than lower value homes can. And that can result in higher Benefit/Cost Ratios for projects in affluent neighborhoods – assuming density is held constant. But…
One high-value home on an acre would likely appraise less than an apartment building, also on an acre. In Kingwood, I compared the valuations of an expensive single-family home with a large apartment complex one block away. The appraised cost per acre (including structures) of the apartment complex is 4X higher.
Now consider that apartments accommodate almost half of Harris County’s population.
According to the latest census data, 54.9% of Harris County residents live in owner-occupied homes. The rest, 45.1 percent, live in apartments.
Most Americans aspire to and encourage home ownership, in part, because of the stability it fosters in communities. But this formula – because of its emphasis on population density – favors apartment areas over areas with owner-occupied homes. There’s nothing inherently wrong with that. You just need to understand what the formula does.
Difference Between Vertical and Horizontal Density
The Benefit Index favors all areas with dense population. Proponents argue that helping more people is better. I don’t argue with that. However, the generalization masks the financial pain inflicted by a flood on owners vs. renters, and on the people who live at ground level compared to those who live above it.
Ground floor renters may lose contents in a flood, but they won’t be responsible for making structural repairs. The owner will.
And many living above the ground floor may find themselves more inconvenienced by flooding than financially devastated. So, is it fair to count all people on all floors when determining who suffers the most pain?
Five-story apartment buildings crowding Brays Bayou with ground-level parking underneath. HCFCD has no way of knowing how many people live in apartments like this, yet HCFCD will be responsible for compiling the data.
In the proposed formula, higher population will lower the benefit index, making it look as though all renters (almost half the county’s population) suffered more than owners of single-family homes.
The premise underlying such “equity” arguments is that poor people can least afford floods. But most people in apartments like those shown above won’t make structural repairs as a homeowner would.
No Perfect Formula
No perfect formula exists that’s equally fair to all in all circumstances. That’s why FEMA, HUD and the Army Corps allow consideration of multiple factors when determining which projects to fund.
The Flood Mitigation Benefit Index focuses totally on population, risk, and past investment. It ignores actual flood damage.
If we use ANY formula to HELP allocate future flood-mitigation funds, we should all strive to:
Understand its built-in biases
Maintain high standards for data integrity.
If we want to test a hypothesis of historical discrimination in flood-mitigation funding, there’s a much simpler way. It’s called direct measurement. Simply locate damage centers from past storms and compare funding in the following decade designed to mitigate those areas.
For More Information
For more background on issues with the formula, see my earlier posts:
https://i0.wp.com/reduceflooding.com/wp-content/uploads/2022/07/20210520-RJR_6978.jpg?fit=1200%2C800&ssl=18001200adminadmin2022-07-14 17:54:142022-07-14 21:58:06Inherent Bias and Limitations of Flood-Mitigation Benefit Index