Mitigation Spending Correlates Even More Strongly with LMI Population than Damage
12/11/2021 – Data obtained via a Freedom of Information Act Request shows that four Harris County watersheds – those with the highest low-to-moderate income (LMI) populations – have received more flood mitigation spending than all other 19 watersheds combined since 2000.
Recent Harris County Flood Control District (HCFCD) figures show that the size of an LMI population in a watershed correlates more highly with mitigation spending than even damaged structures. Previously, I coined the phrase “funding flows to damage.” That’s still true, but the number of LMI residents in a watershed now correlates even more strongly.
The latest spending data through the third quarter of 2021 also debunks the myth that flood mitigation projects always go to neighborhoods with the highest home values.
How Correlation Works
Correlation is not causation. A coefficient of correlation indicates the strength of a relationship between two variables. In a perfect correlation (1.0), every unit of change in one variable produces a proportional amount of change in a second variable. Variables move together by the same percentage and direction 100% of the time. But in real life, one rarely finds perfect correlations. However, these come close. Statisticians consider them very strong.
Funding Correlates Strongly with Both LMI Population and Damage
Dollars spent on mitigation have the following coefficients of correlation:
- .93 for LMI population by watershed
- .84 for structures damaged in five major storms
The storms included Allison, Tax Day, Memorial Day, Harvey and Imelda. Spending included HCFCD and partner dollars from 1/1/2000 through 9/30/2021.
You would expect mitigation spending to correlate highly with damage. After all, no one spends money to fix areas that didn’t flood. And the most attention would be focused on areas that flooded the worst. So they vary closely in the same direction.
But why does flood mitigation spending correlate so strongly with LMI population? That’s less expected.
Hypothesis to Explain High LMI Correlation
Observation suggests that LMI households tend to be in older neighborhoods often built to lower standards. For instance, homes tend to be closer to street level.
Moreover, in Houston, these neighborhoods tend to have roadside ditches rather than storm sewers. And those drainage ditches tend to fill in with silt over time, trapping water in neighborhoods.
Population density is also literally twice as high in LMI watersheds compared to affluent ones (3,947.11 people per square mile for watersheds above 50% LMI vs. 1,831.52 for watersheds below 50% LMI). So homes tend to be closer together, have a higher percentage of impervious cover, and crowd floodplains. Said another way, more people live in harm’s way.
Brays Bayou is a good example. It has the largest LMI population, the highest density and the most damage. It has received the most flood mitigation money since 2000 – $544 million or $158 million more than any other watershed.
At the opposite end of the spectrum, Luce Bayou has the smallest population and suffered the least damage. It received the least flood mitigation spending – only about 1% of Brays’ total.
LMI neighborhoods also tend to be in areas (inside the Beltway) surrounded by more upstream development. When developers built those older neighborhoods, they probably weren’t expecting the Houston Metro Area to explode from 700,000 people in 1950 to almost 7 million today.
We also didn’t know as much about flood mitigation in 1950. We didn’t force upstream developers to build detention ponds and didn’t reserve rights of way for future channel expansion. (Or at least not as much as we needed.)
Buying that additional right of way typically costs almost as much as construction – even more in densely populated areas. White Oak Bayou, for instance, has the third highest population and the fourth highest population density. Out of the $386 million it has received since 2000, a whopping 61% has gone toward right-of-way acquisition and 20% toward construction.
As a result of all these complex historical factors and dependencies, LMI population, damage and flood-mitigation spending tend to co-vary. That’s the best explanation I can offer.
In Harris County, Mitigation Spending Favors Low-, Not High-Income Areas
The narrative often heard in commissioners court is that higher home values increase the benefit cost ratio (BCR) for flood mitigation projects and that FEMA favors the highest BCRs. Those, in turn, theoretically favor mitigation projects in affluent communities. But that argument ignores:
- Factors discussed above.
- Political policy in Harris County which strongly favors socially vulnerable areas
- Factors that FEMA considers beyond BCRs when awarding grants.
- The different priorities of HUD, TWDB and local partners.
For proof positive, see the charts below.
Brays, White Oak, Sims and Greens all have the highest LMI populations. And all have received the most flood-mitigation dollars since 2000. In fact, those four LMI watersheds alone received more money than all other 19 watersheds combined.

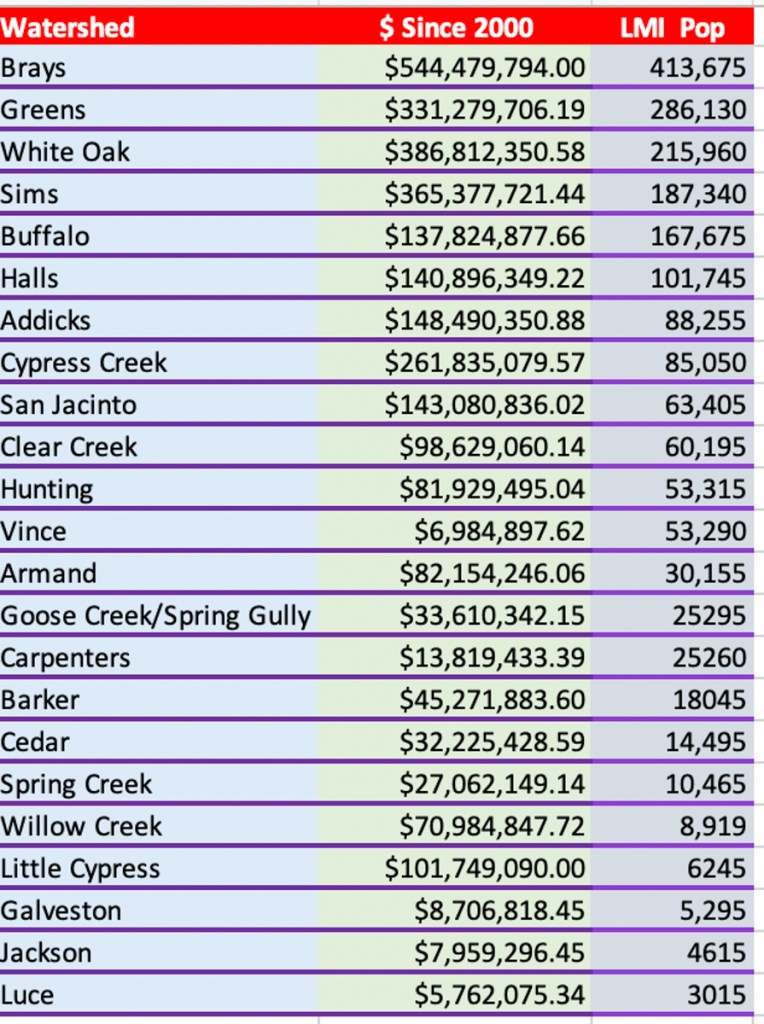
To me, this debunks the myth that having less-expensive housing disadvantages some areas. In Harris County, density, public policy and other factors more than compensate for any influence home values exert on BCRs and the allocation of flood-mitigation dollars.
Posted by Bob Rehak on 12/11/2021
1565 Days since Hurricane Harvey
The thoughts expressed in this post represent opinions on matters of public concern and safety. They are protected by the First Amendment of the US Constitution and the Anti-SLAPP Statute of the Great State of Texas.