
Three Online Tools To Help You Better Understand Flood Risk
Hopefully, by now, regular readers of this website should know all about FEMA’s National Flood Hazard Layer Viewer and be able to identify whether they are in a recognized flood zone. But fully understanding flood risk can be far more complicated.
In a heavy rain, will water run toward or away from your home? Exactly how far below the 500-year flood plain is a given location? When water at a river gage reaches X, how much water will you be standing in at Y?
Every week, people alert me to new online tools that help assess different aspects of flood risk. Last week, I learned about three.
Elevation Profiling in Google Earth Pro
One is actually a feature within Google Earth Pro called “Elevation Profiling.” Many parts of Houston are so flat, it’s often hard to tell with the naked eye whether your home is at the high point or low point in your neighborhood. Which way does the land slope? How steep is the grade? What are the average and maximum grades? These are all good things to know if you want to make sure you don’t buy at the bottom of a bowl or waterfall.
For yesterday’s post about a family that flooded in North Kingwood Forest, I checked the elevation profile between various points in Woodridge Village and their neighborhood.
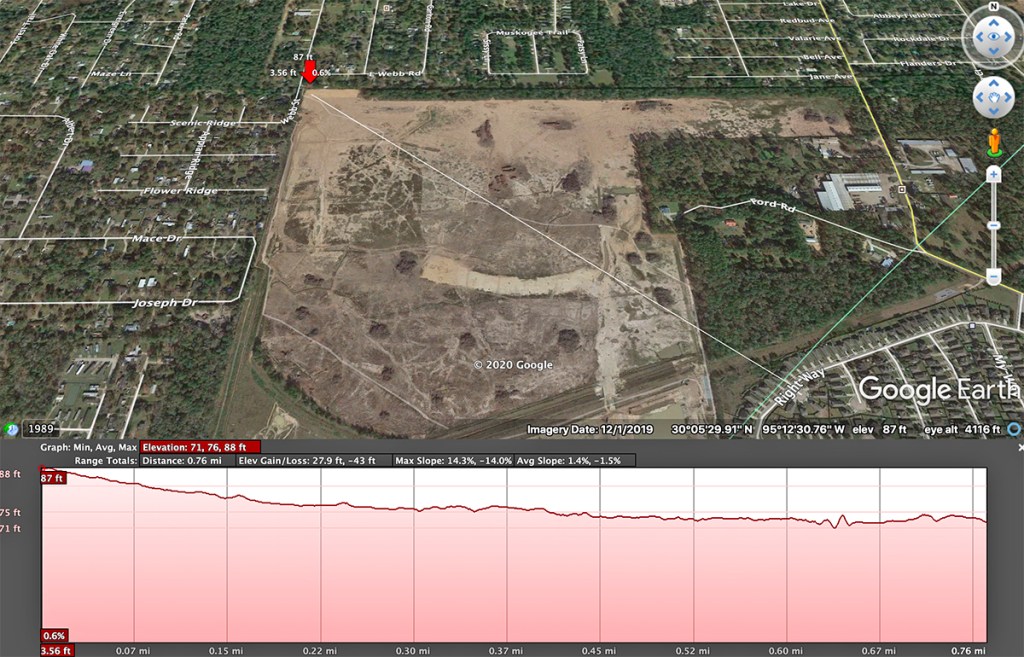
Elevation dropped 15 feet along the eastern border of Woodridge, 12 feet along the western border and 3 feet from west to east along Taylor Gully. No matter which way you look at it, everything on Woodridge sloped in their direction.
To use this feature in Google Earth Pro:
- Select the Path tool.
- Define a path. It can contain multiple points. For instance, you might want to trace the elevation along street that curves.
- Highlight the path in the side bar.
- In the Edit menu, select “Show Elevation Profile.”
- The red box will then appear at the bottom of the screen with the profile and related information.
- Running your cursor across the elevation profile will highlight the corresponding point on the satellite image and show you its elevation, distance from the start, and grade from the start.
Houston Public Works Floodplain Map

Houston Public Works offers a variation on FEMA’s floodplain maps. It shows you in one foot increments how far below the 500-year floodplain (the City’s new benchmark for building) you are at any given location in the City. Are you barely in it? Or more than five feet below it? Knowing the answer can help you assess how much risk you’re taking on when you buy a new home. Said another way, it gives you much more detail.
National Weather Service Inundation Viewer
Want to know how deep the water will be in your home when a river gage near you reaches a certain level? This is the tool for you.

Start by clicking on Inundation and a gage height in the left hand column. As you click on different levels, watch the floodwaters expand or contract. (This shows the extent of floodwaters when the gage is at 66 feet.) Then click on another point within the floodwaters. A pop up box tells you how deep the floodwater will get at that location.

This viewer is not available for all gages. However, it is available for two in the Lake Houston Area. The two are at US59 on the West Fork and FM1485 on the East Fork. There are five others in the Houston region.
Here’s how it works:
- Locate your gage then click on Inundation in the left column.
- Next, select a level of flooding.
- Within categories (Minor, Moderate, Major), you can select one foot increments.
- Then on the map, click on any other nearby location.
- Within a pop-up box, it will tell you how much water you can expect for any given gage height.
- This information will be useful in deciding when and whether to evacuate. For instance, clicking on a bridge will tell you at what point it goes under water.
Clicking on other tabs, will show you hydrographic and probability information, and more.
I look forward to the expansion of this powerful tool to other gages.
Posted by Bob Rehak on 7/19/2020
1055 Days after Hurricane Harvey and 304 after Imelda

